
Following futures positions of non-commercials are as of February 23, 2021.
10-year note: Currently net long 2.8k, down 100.6k.
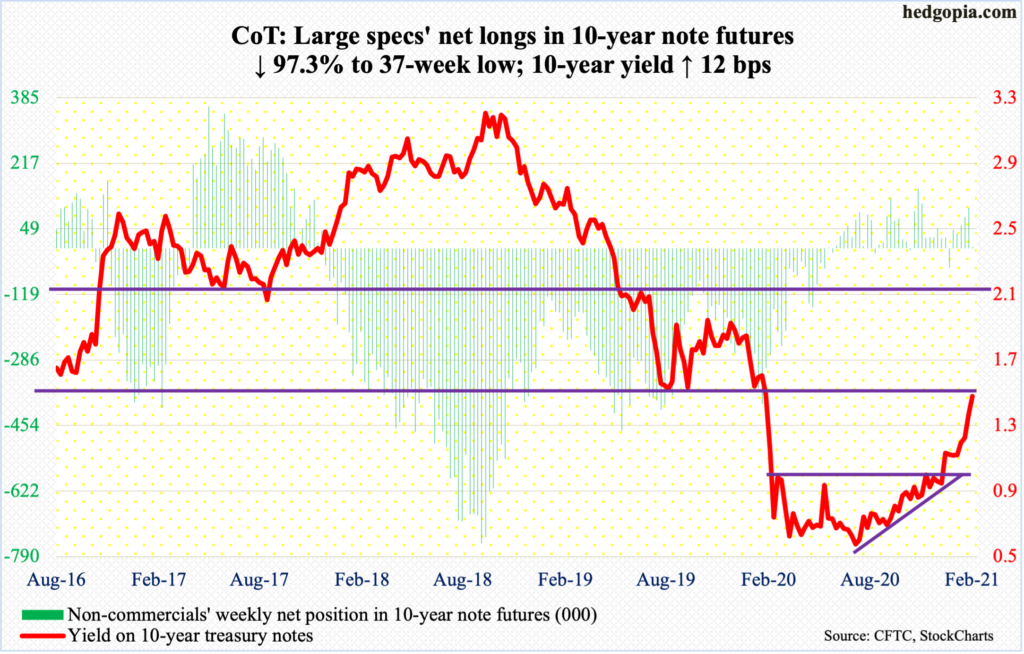
Bond vigilantes and central banks look ready for a duel. The former fired the opening salvo, with long rates rising meaningfully everywhere this week. In the US, the 10-year treasury yield (1.46 percent) rallied 12 basis points and was up as much as 27 basis points at Thursday’s high when rates reached 1.61 percent – a one-year high. Until January 5, these notes yielded sub-one percent.
A whole host of assets, not the least of which are equities, are hoping this does not continue (more on this here). Markets are beginning to sense that a sustainable recovery is just around the corner and that a tightening in policy comes sooner than central banks are telling us. The latter continue to convey that low rates are needed and that they would continue to support the bond market.
On Friday, some central bankers went into action. Bank of Japan Governor Haruhiko Kuroda reiterated his commitment to buying Japanese bonds. The Bank of Korea said it planned to buy ₩5 trillion to ₩7 trillion worth of government bonds by June. The Reserve Bank of Australia surprised markets by buying A$3 billion worth of three-year government bonds.
Currently, most of the action is in the long end of the yield curve. Once markets begin to reassess the short end, that is when the Fed’s hands will be forced. The two-year T-yield is the most sensitive in this respect. On Thursday, it rose five basis points to 0.17 percent, but nothing major. The fed funds rate is in the range of zero to 25 basis points. Besides, these notes were back at yielding 0.12 percent by Friday. It is worth a close watch.
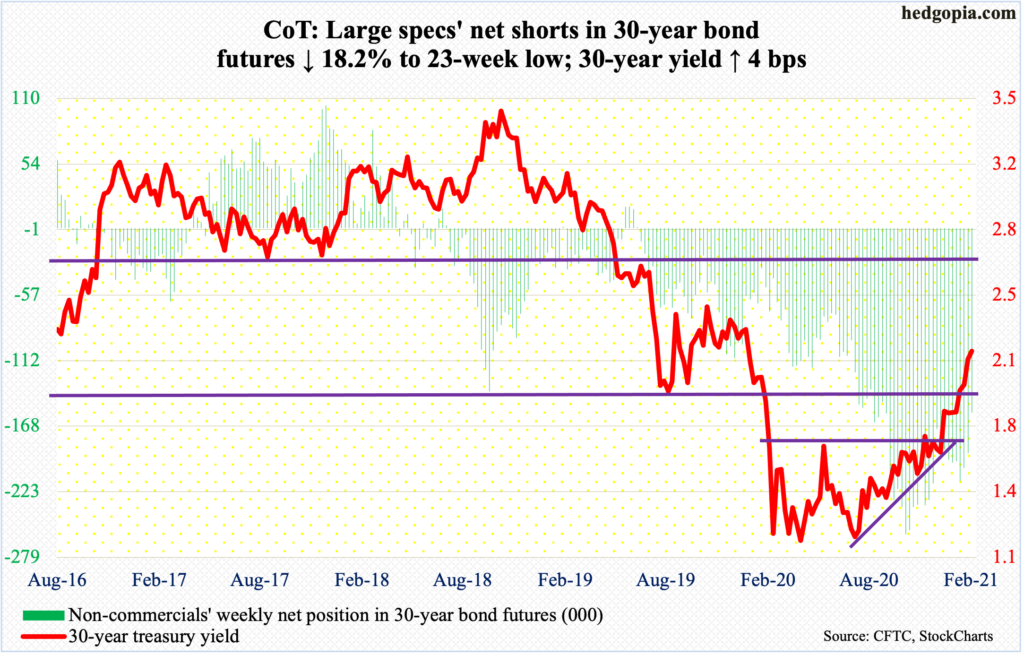
30-year bond: Currently net short 156.3k, down 34.7k.
Major economic releases for next week are as follows.
The ISM manufacturing index (February) is published on Monday. In January, manufacturing activity dropped 1.8 points month-over-month to 58.7. Last April, the index made a post-pandemic low of 41.7.
Wednesday brings the ISM non-manufacturing index (February). Services activity in January rose a point m/m to 58.7. Last April, activity was suppressed at 41.6.
Labor productivity (4Q20, revised) and durable goods orders (January, revised) come out Thursday.
Preliminarily, 4Q20 non-farm output/hour increased 2.5 percent from a year ago.
In the 12 months to January, orders for non-defense capital goods ex-aircraft – proxy for business capex plans – jumped 9.1 percent to a seasonally adjusted annual rate of $72.9 billion, which was a new record.
Employment numbers (February) are scheduled for Friday. From last April’s low through January, the economy created 12.5 million non-farm jobs. This is still 9.9 million short of last February’s pre-pandemic peak of 152.5 million.
WTI crude oil: Currently net long 554.5k, down 5.4k.
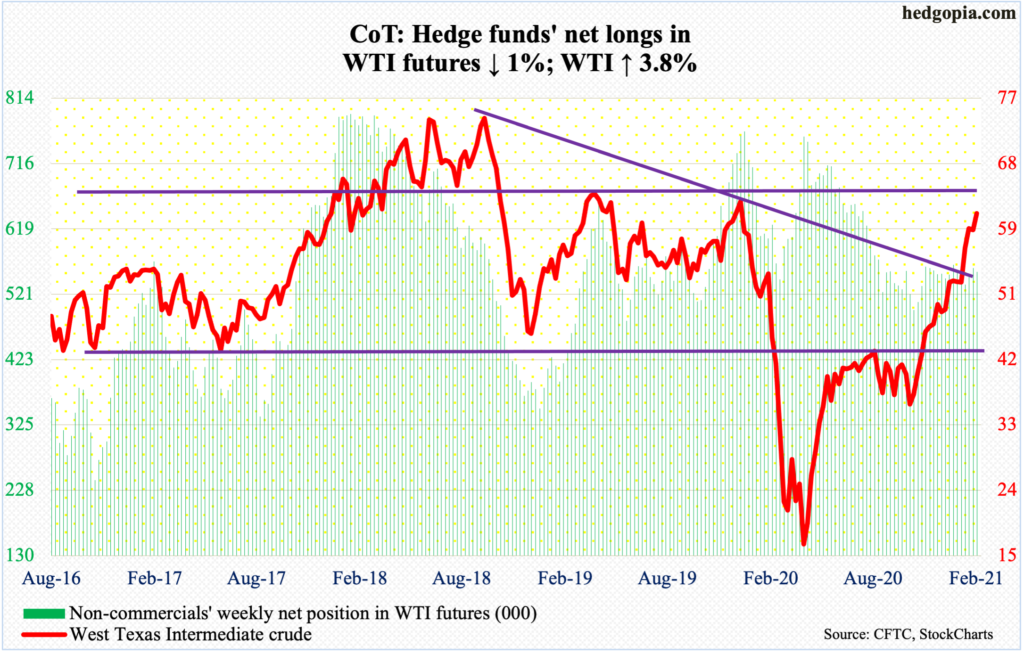
In the first week of February, WTI ($61.50/barrel) broke out of a falling trend line from October 2018 when it retreated after posting $76.90. This week, it broke out a similar trend line from July 2008 when the crude reached an all-time high of $147.27; bulls were unable to build on this, however. The crude retreated after bumping right up against horizontal resistance at $64, with Thursday tagging $63.81.
Nearest support lies at $58.60s.
E-mini S&P 500: Currently net short 31.3k, down 48.6k.
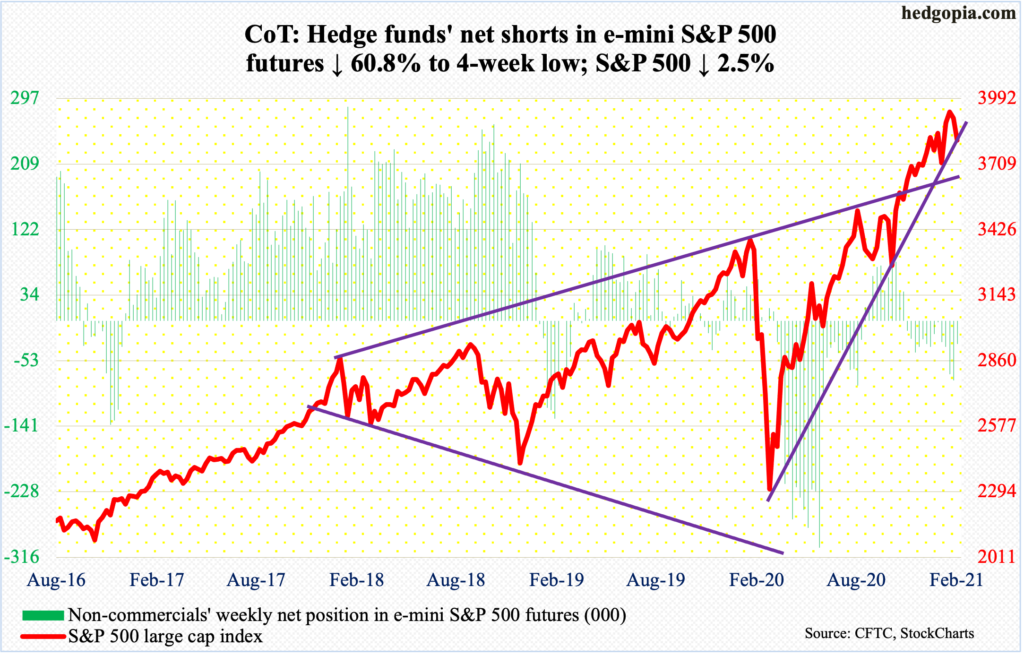
Last March, after a five-week, 35-percent collapse, the S&P 500 bottomed on the 23rd. That turned out to be a major low. Through the intraday all-time high of 3950.43 on the 16th this month, the large cap index rallied 80 percent!
Since that high nine sessions ago, bulls have struggled to keep up the momentum. At the end of January, a rising trend line from the aforementioned low was vigorously defended. This is being tested again, and breach risks are rising, with the large cap index (3811.15) closing out the week right on it. The 50-day moving average (3808.40) is right there.
The S&P 500 was down 2.5 percent this week. This followed a 0.7-percent slide last week. The weakness has come at a time when flows have improved in a big way. In the week to Wednesday, SPY (SPDR S&P 500 ETF), VOO (Vanguard S&P 500 ETF) and IVV (iShares Core S&P 500 ETF) collectively took in $5.6 billion (courtesy of ETF.com). In the same week, US-based equity funds attracted $17.1 billion (courtesy of Lipper). In the prior two weeks, $35.5 billion moved into these funds and $24.7 billion into the three ETFs.
A loss of the March trend line opens the door toward 3640s, which is where the S&P 500 peaked on November 9 when Pfizer (PFE) announced its positive vaccine news.
Euro: Currently net long 138.4k, down 1.6k.
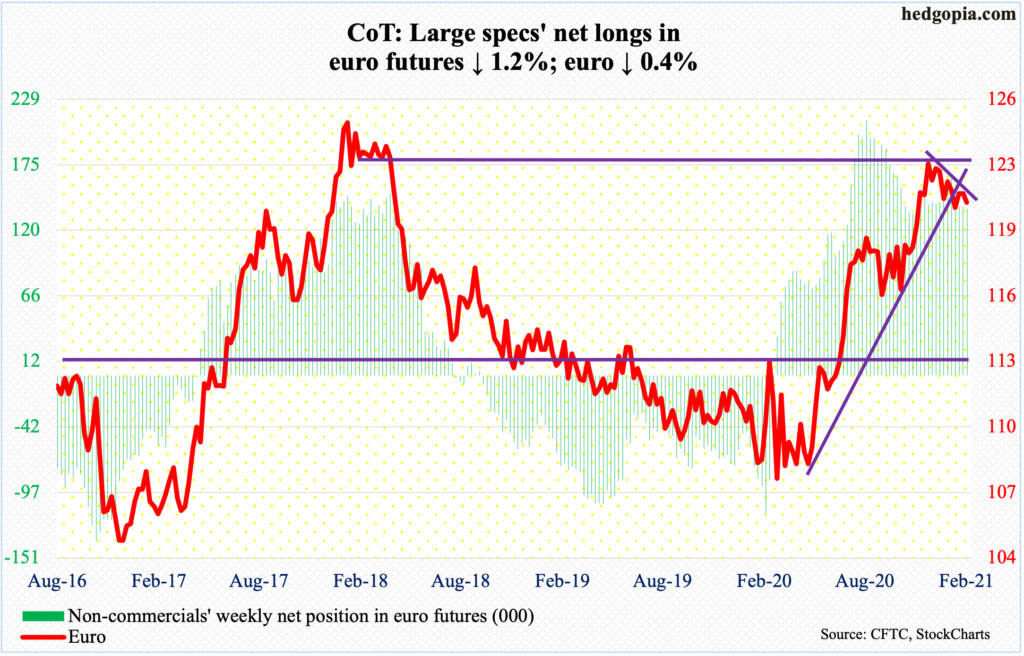
After straddling the 50-day in the first three sessions, the euro ($1.2074) reclaimed the average on Thursday, but rather shakily, with an intraday high of $1.2243 but a close of $1.2178. In the very next session, the currency dropped back below the average.
Action continues to revolve around $1.20-$1.21, which goes back more than 17 years and which euro bulls reclaimed in early December. They would only have strengthened their position if the intraday high of $1.2345 from January 6 gets taken out.
Near term, the risk is to the downside.
Gold: Currently net long 215.7k, down 19.2k.
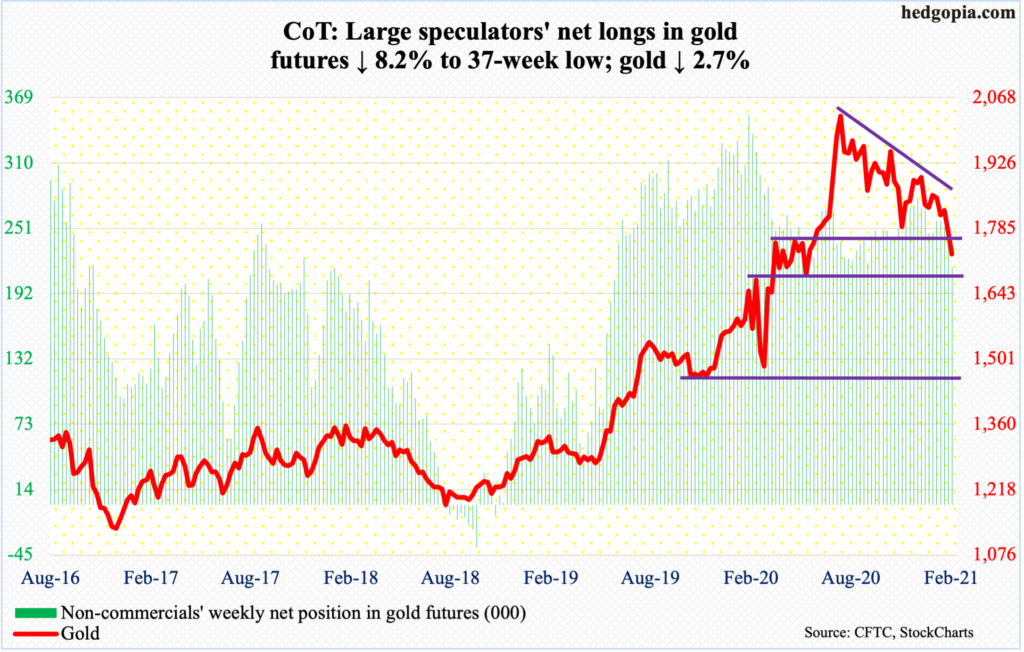
Gold ($1,728.80/ounce) is struggling to generate interest. On Thursday, it once again tested crucial support at $1,760s-$1,770s, which gave way on Friday.
The yellow metal reached its all-time high of $2,089.20 on August 7 and has since traded within a potentially bearish descending triangle, the lower support of which lied at $1,760s-$1,770s.
Flows have not been in cooperation. In 16 out of the last 19 weeks, GLD (SPDR Gold ETF) has experienced outflows, for a cumulative loss of $10.1 billion, including outflows of $1.5 billion in the week to Wednesday (courtesy of ETF.com).
Non-commercials, too, have been reducing their net longs, with holdings reaching a 37-week low this week.
If the descending triangle pattern completes, bears could have their sights set on $1,440s. Immediately ahead, there is horizontal support at $1,670s.
Nasdaq 100 index (mini): Currently net short 5.4k, up 26.5k.
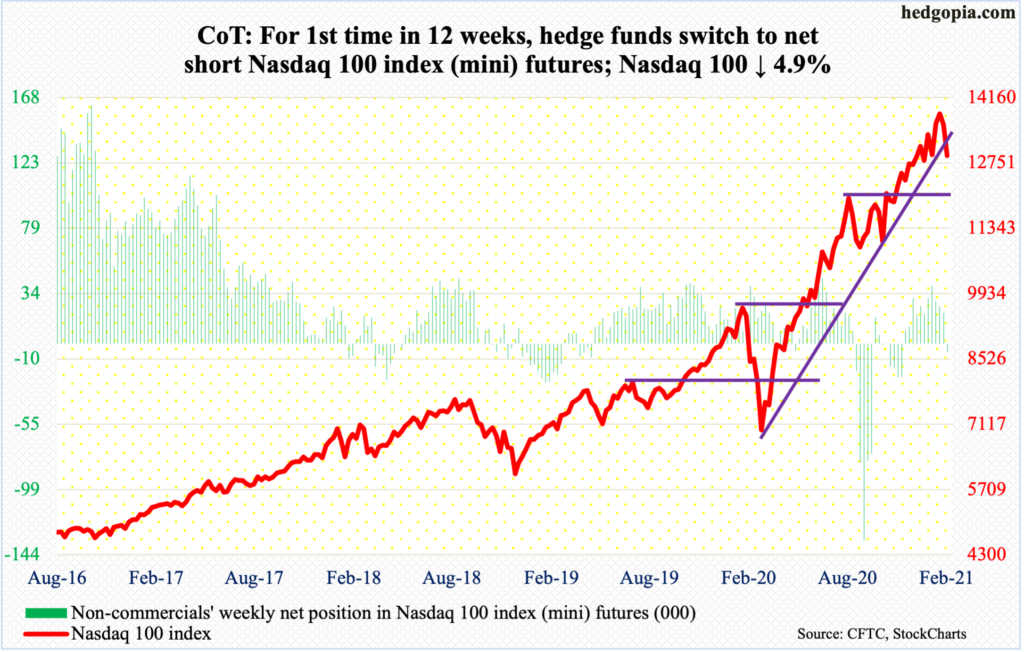
From up 7.4 percent to down 0.1 percent, the Nasdaq 100 suffered quite a reversal in February, forming a monthly shooting star to boot. This followed January’s monthly long-legged doji.
February’s uptrend reversed on the 16th as the index posted a new intraday high of 13879.77. In the next five sessions – that is, by Tuesday this week – it quickly dropped to 12758.12, which was bought. Wednesday’s 0.8-percent rally reclaimed a rising trend line from last March’s low, but only to decisively lose it on Thursday. The 50-day (13137.15) is lost as well.
This is different from early this month when this trend line was aggressively defended (more on this here). Both the weekly and monthly are way overbought. If unwinding begins in earnest, there is a long way to go on the downside.
Immediately ahead, support lies at 12430s. This is where the Nasdaq 100 (12909.44) peaked on September 2 before coming under decent pressure.
Nasdaq short interest remains elevated (chart here), and at some point this should end up helping the bulls as shorts begin to cover. Mid-February, QQQ (Invesco QQQ Trust) short interest stood at an 11-month high (chart here). Since last March, this was the fourth instance when short interest exceeded 68 million. The prior three marked a drop in short interest and a rise in the ETF. This time around, things have not quite panned out the same way, as QQQ is down 6.6 percent in the current reporting period. The loss of the March trend line can embolden the shorts even more.
Russell 2000 mini-index: Currently net short 9.8k, up 28.
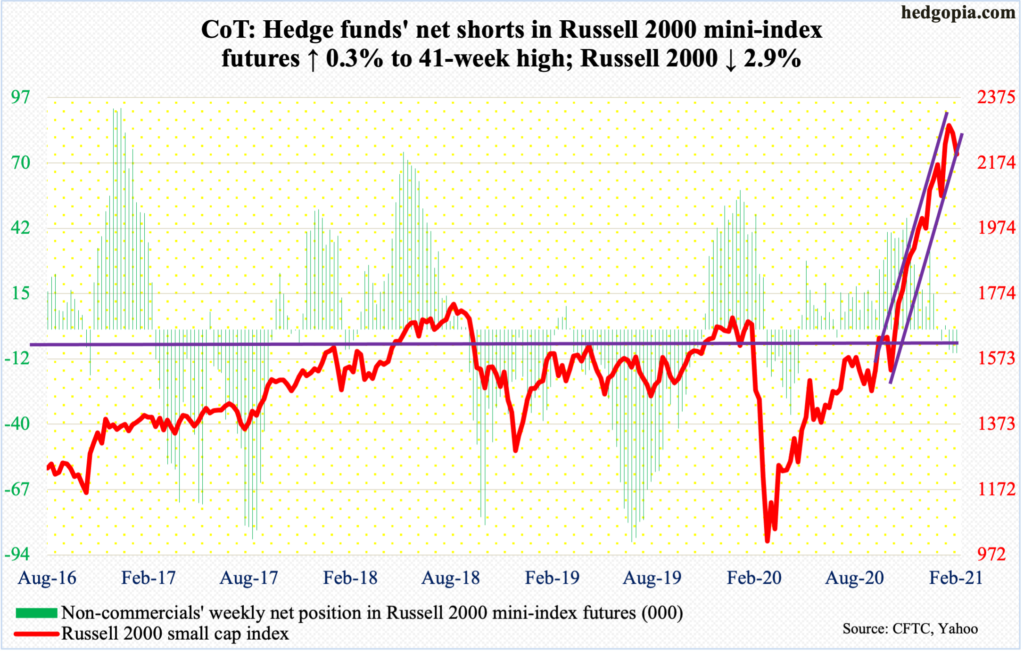
At the end of January, the Russell 2000 (2201.05) landed right on the lower bound of an ascending channel from late October-early November last year. Small-cap bulls stepped up to the plate and bought that selloff, subsequently rallying the index toward the upper bound. On February 10, a new intraday high of 2318.09 was posted before retreating.
Bulls’ mettle was once again tested this Tuesday as an intraday breach of the channel support was bought, with the index dropping to 2169.08 intraday. Wednesday’s 2.4-percent rally was short-lived. Thursday, the index tumbled 3.7 percent, slightly dropping out of the channel.
There is short-term horizontal support at 2150s-2160s, which was tested on Friday as well. It increasingly looks like it is only a matter of time before this gives away. Nearest support lies at the 50-day (2124.96).
US Dollar Index: Currently net short 13.9k, down 436.
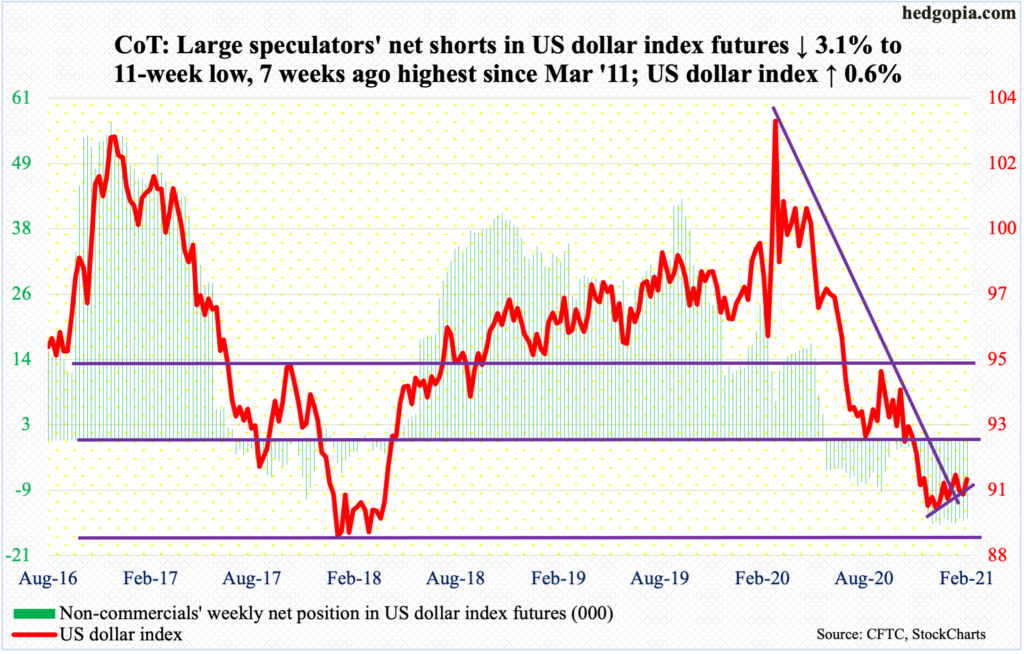
On Thursday when the 10-year T-yield closed up 13 basis points (and 22 basis points intraday), the US dollar index (90.88) dropped 0.04 percent and was down as much as 0.6 percent earlier. One would think higher rates would help the greenback.
From bulls’ perspective, the good thing is that Thursday’s intraday low of 89.67 can be viewed as a successful test – again – of 88-89, which goes back to at least March 2004. Earlier on January 6 (this year), the US Dollar Index bottomed at 89.17.
On Friday, the 50-day was recaptured. The intraday high of 91.61 from the 5th this month has taken on significance.
VIX: Currently net short 162.9k, down 320.
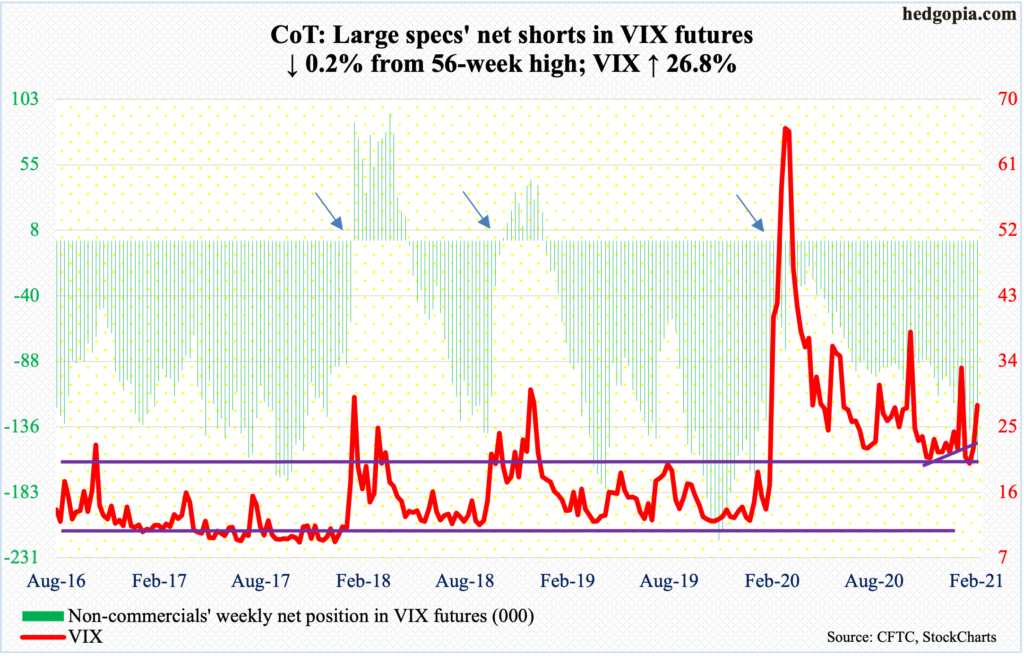
Despite Thursday’s 7.6-point surge to 28.89, VIX (27.95) ended up down 5.14 points in February. In January, the volatility index shot up to 37.51 intraday, but that proved fleeting. So, it remains to be seen if the latest jump in volatility has the staying power.
For nearly seven months now, volatility bulls have done a good job of defending low-20s. At the same time, since last March when VIX tagged 85.47 intraday, a pattern of lower highs has been in place. This will have been broken should 37.51 fall. Thursday’s high was 31.16.
Thanks for reading!
