
Following futures positions of non-commercials are as of July 13, 2021.
10-year note: Currently net long 56k, up 81.6k.
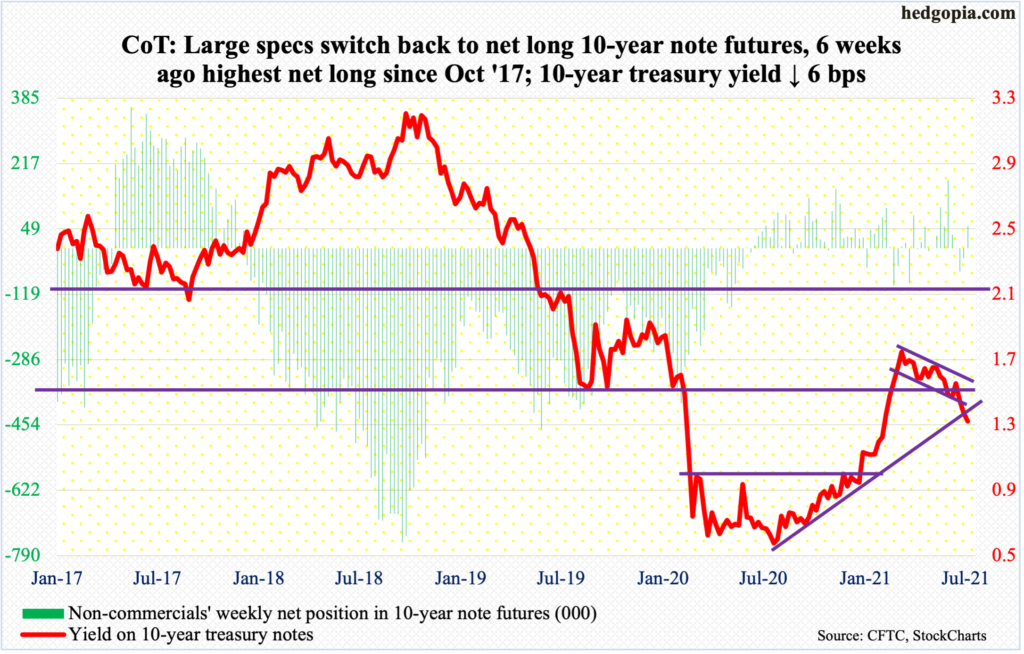
One more month in which inflation overshoots the consensus. In June, headline and core CPI jumped 5.3 percent and 4.5 percent year-over-year – the sharpest price rise since July 2008 and November 1991. The bond market responded with a big yawn, with the 10-year yield (1.30 percent) shedding six basis points for the week.
US inflation began to accelerate in March/April, and that is when the 10-year yield began peaking. Rates reversed lower on March 30 after tagging 1.77 percent, with a lower high of 1.75 percent on April 5. It is probable these highs will not be surpassed for some time to come.
Markets have wholeheartedly adopted the Fed’s take on inflation, which is that it is transitory. Because it buys up to $80 billion a month in treasury notes and bonds, the Fed has become markets – at least a decent part of it. Said it differently, it can influence the behavior of market participants. But this alone cannot explain away the persistent bid for these bonds. Demand is coming from elsewhere as well.
Last week, the 10-year sliced through triple support at low-1.40s – four-month descending channel, 11-month rising trend line and nine-year horizontal (more on this here). This Tuesday, rates then rallied back to 1.42 percent intraday to retest the breakdown but were vehemently denied.
In due course, a gradual move to one percent is the path of least resistance. Yields broke out of this level early this year.
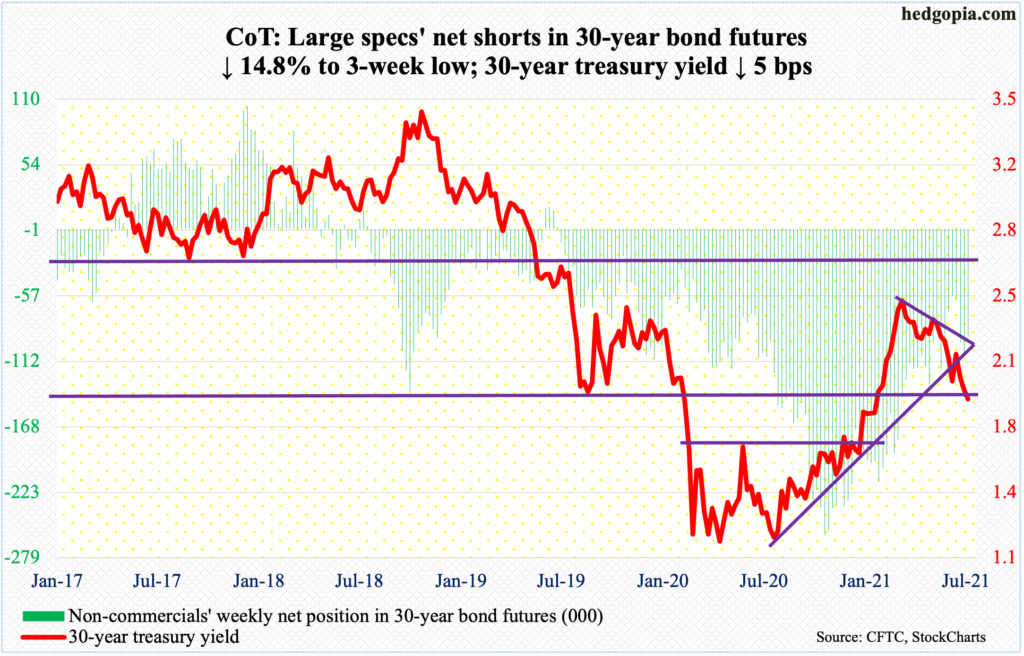
30-year bond: Currently net short 91.9k, down 16k.
Major economic releases for next week are as follows.
The NAHB Housing Market Index (July) is due out on Monday. Homebuilder optimism in June took a step back dropping two points month-over-month to 81. The all-time high of 90 was posted last November, having tripled from April’s post-pandemic low of 30.
Housing starts (June) are scheduled for Tuesday. Starts in May increased 3.6 percent m/m to a seasonally adjusted annual rate of 1.57 million units. Earlier in March, they rose as high as 1.73 million units, having tumbled to 938,000 in April.
Thursday brings existing home sales (June). May sales were down 0.9 percent m/m to 5.80 million units (SAAR). Last October, sales hit 6.73 million units.
WTI crude oil: Currently net long 513k, up 982.
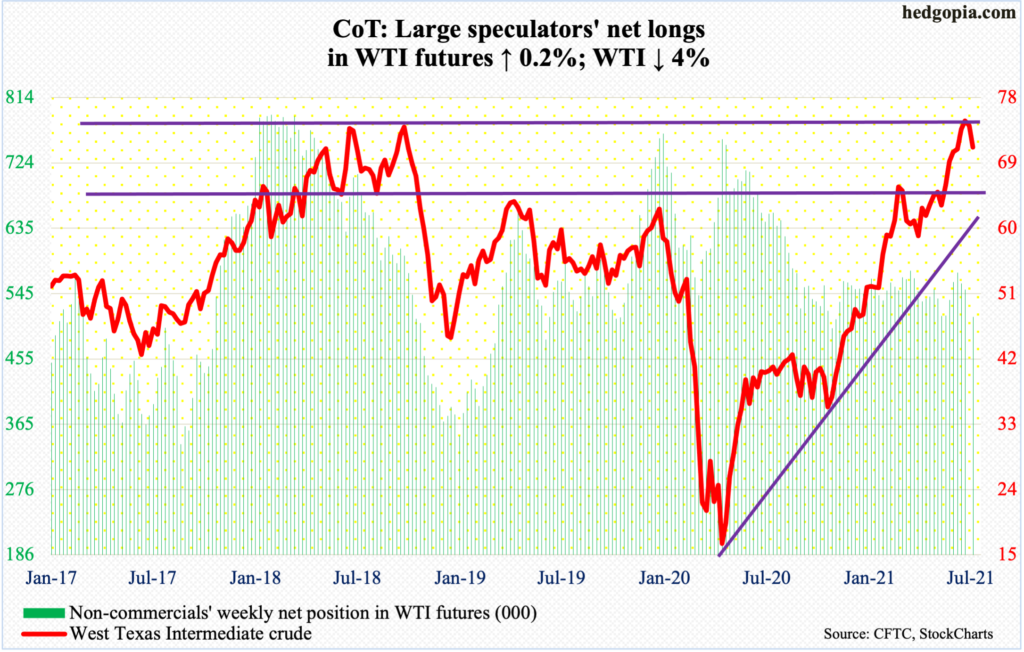
After a back-to-back weekly spinning top, WTI ($71.56/barrel) this week declined four percent. Last week, it surpassed the October 2018 high of $76.90 by $0.08 before sellers came out of the woodwork. The reversal took place at important resistance and after having rallied massively since April last year when the crude bottomed at $6.50.
In due course, breakout retest at $66-$67 is the path of least resistance. WTI broke out of this horizontal resistance in early last month.
In the meantime, US crude production in the week to July 9 rose 100,000 barrels per day to 11.4 million b/d, matching a high from May last year. Crude imports increased 346,000 b/d to 6.2 mb/d. As did stocks of gasoline and distillates, which respectively grew one million barrels and 3.7 million barrels to 236.5 million barrels and 142.3 million barrels. Crude stocks, however, decreased 7.9 million barrels to 437.6 million barrels. Refinery utilization declined four-tenths of a percentage point to 91.8 percent.
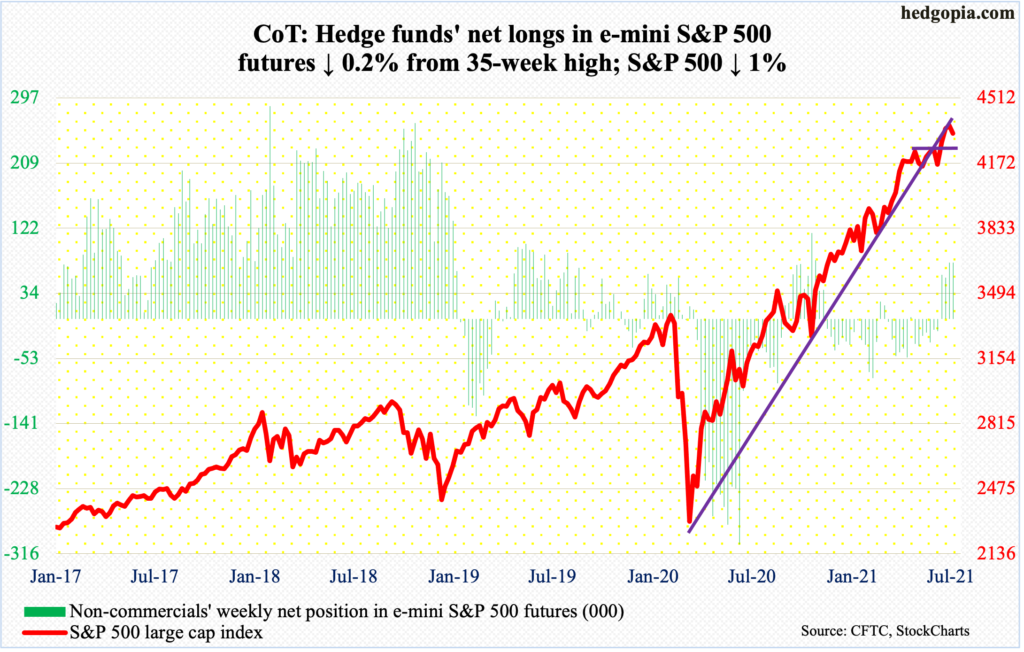
E-mini S&P 500: Currently net long 75.4k, down 118.
Flows into SPY (SPDR S&P 500 ETF), VOO (Vanguard S&P 500 ETF) and IVV (iShares Core S&P 500 ETF) slowed to $915 million in the week to Wednesday; in the prior four, inflows totaled $16.6 billion (courtesy of ETF.com). At $628 million, flows were also mediocre into US-based equity funds in the week to Wednesday (courtesy of Lipper).
Non-commercials stayed put with their net longs this week. They switched to net long four weeks ago. These positions are still profitable but their patience will be tested when the S&P 500 (4327) proceeds to test 4250s.
In Wednesday’s spinning top session, the large cap index ticked a new intraday high of 4394 but only to then reverse lower. A bunch of major banks and brokers reported this week, and elicited adverse investor reaction; for the week, XLF (SPDR Financial Fund) declined 1.6 percent.
Ahead of 2Q earnings, major US indices, including the S&P 500, had rallied strongly, with decent cooperation from flows. They seem to now run dry. An imminent test of 4250s will be crucial. Midway through the month, July is still up 0.7 percent but has so far formed a potentially bearish shooting star.
Euro: Currently net long 59.7k, down 17.5k.
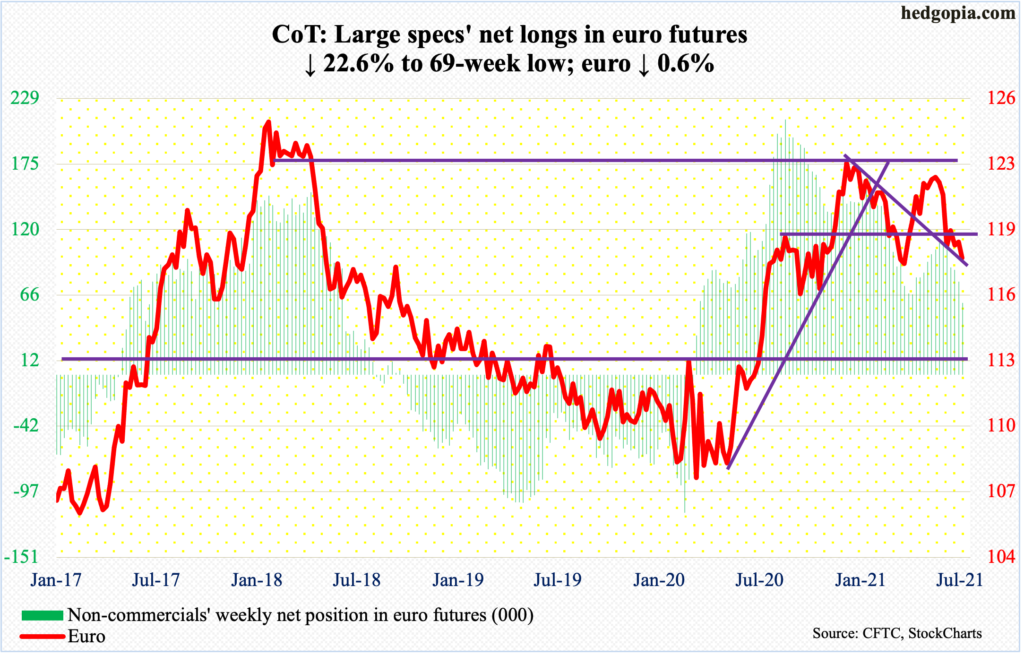
Tuesday’s low of $1.1771 was a third straight weekly low. Last week’s low of $1.1781 was undercut but the euro ($1.1806) remains above the March 30 low of $1.1712, for a higher low. Shorter-term averages are trying to at least flatten out.
Near term, a rally could ensue should the currency recapture $1.1840s, which came in the way on Wednesday. Longer term, monthly overbought indicators are still unwinding.
Gold: Currently net long 190.8k, up 8k.
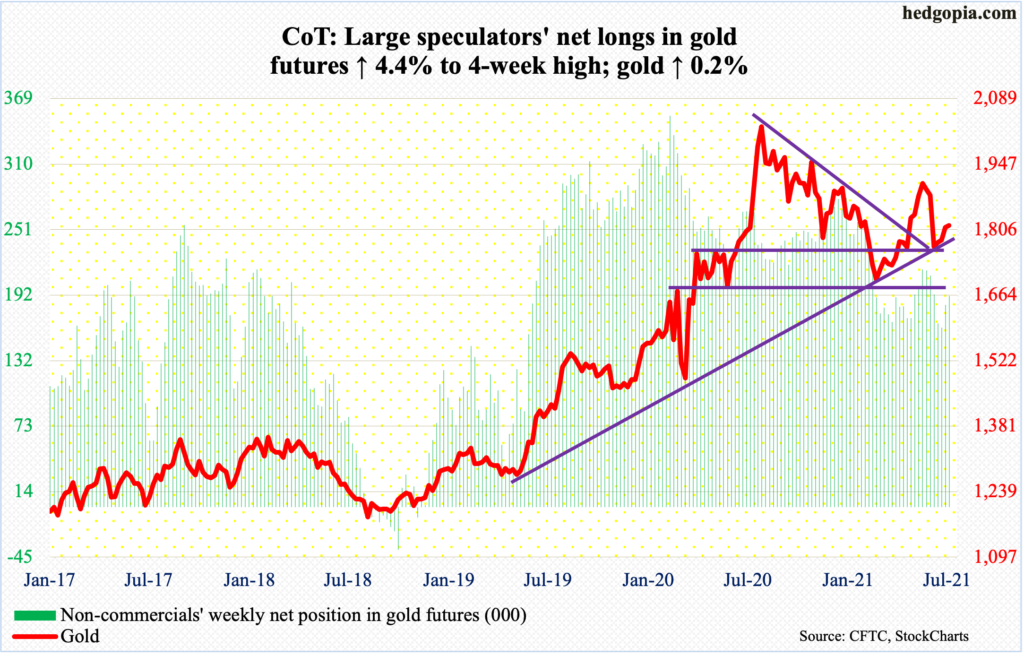
Gold ($1,815/ounce) is now up four weeks in a row, although the magnitude of the move is not that big. Three weeks ago, the metal bottomed at $1,750. In a long-legged doji session this Thursday, it tested the 200-day with a high of $1,835.
Ideally, gold bugs would like to go test $1,920s. Several times in the first half last month, gold got rejected at this roadblock. This level has a lot of memory attached to it as this is where the yellow metal peaked in September 2011. Last August, gold went on to post a new high of $2,089 but the breakout proved fleeting.
At some point, odds favor $1,920s gets tested again. Before that happens, there is horizontal resistance at $1,850s. Near term, the daily is beginning to get extended. Nearest support lies at $1,800, followed by crucial $1,760s-$1,770s.
Nasdaq 100 index (mini): Currently net short 4.3k, up 2.7k.
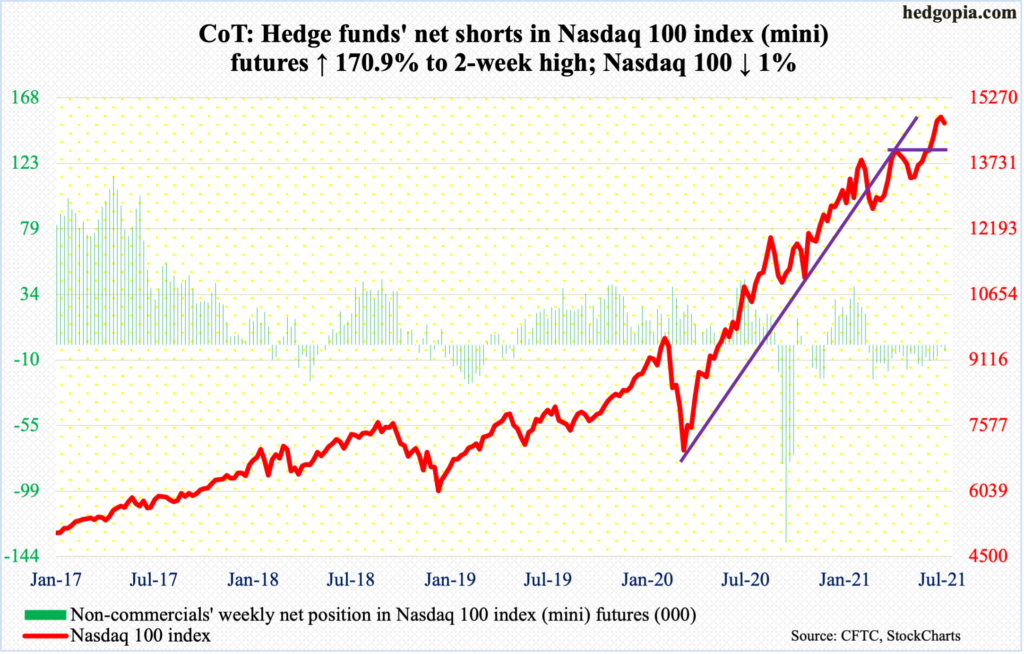
The Nasdaq posted a new intraday high of 15002 in Tuesday’s gravestone doji session. This preceded a hanging man on Monday. Both these candles are bearish if confirmed.
For a while now, the Nasdaq Composite has trudged higher with internals diverging (more on this here). Within the Nasdaq, the large-caps are doing the heavy lifting. The top five US companies – Apple (AAPL), Microsoft (MSFT), Amazon (AMZN), Google owner Alphabet (GOOG) and Facebook (FB) – are all tech and will report the June quarter the week after. Post-earnings reaction to their numbers will decide the near-term trajectory of tech-heavy indices.
Going by non-commercials’ positioning, a break to the downside can be expected. Last week, they were very close to going net long. This week, they instead added to their net shorts.
A month ago, after a two-month consolidation, the Nasdaq 100 (14681) broke out of 14000. This is the one to watch for now.
Russell 2000 mini-index: Currently net short 43.1k, up 1.2k.
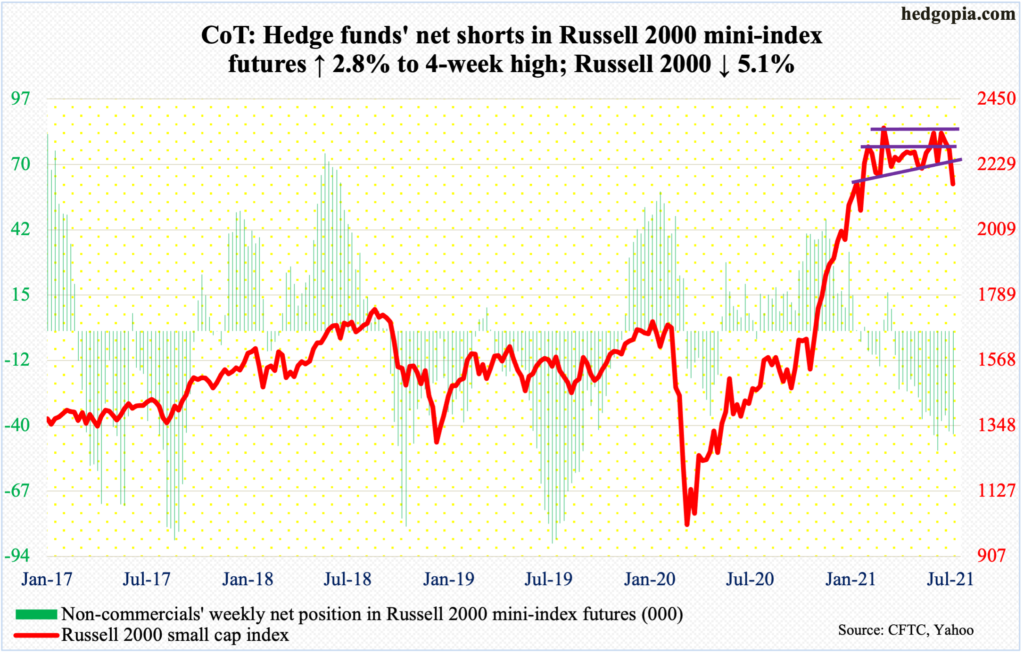
Last week, the Russell 2000 closed right on 2280. Attempts to break out of 2280s early this week failed. Then, things unraveled quickly. By Thursday, the small cap index tagged 2166 and then 2161 on Friday, closing the week at 2163.
There was support at 2170s, which held trend line as well as horizontal support going back six months. So, for now, the index remains rangebound – between 2280s and 2170s. Inability to rally here raises the odds of a test of 2080s.
Small-caps are one of the assets investors gravitate toward in a risk-on environment. On this front, it is beginning to look shaky. Although high-yield continues to perform well, with first-half bond issuance by US corporations on course for a record year (more on this here).
US Dollar Index: Currently net long 11.3k, up 3.7k.
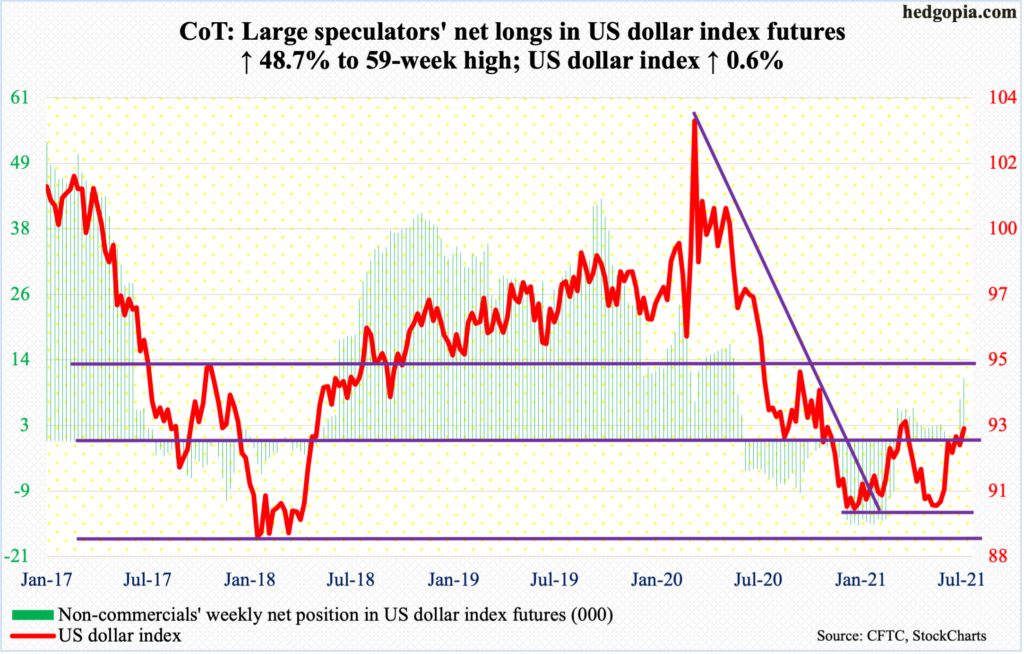
Wednesday’s session high of 92.84 only matched last week’s high. A takeout of this level likely makes possible a run toward the March 31 high of 93.47. Else, the US dollar index could be in a process of peaking near term.
It has had a decent seven-week run, having bottomed on May 25 at 89.52.
Should the index head back lower near term, a bull-bear duel likely unfolds just north of 92, a breach of which opens the door toward the 50- and 200-day (91.67 and 91.47 respectively).
VIX: Currently net short 61.3k, down 5.7k.
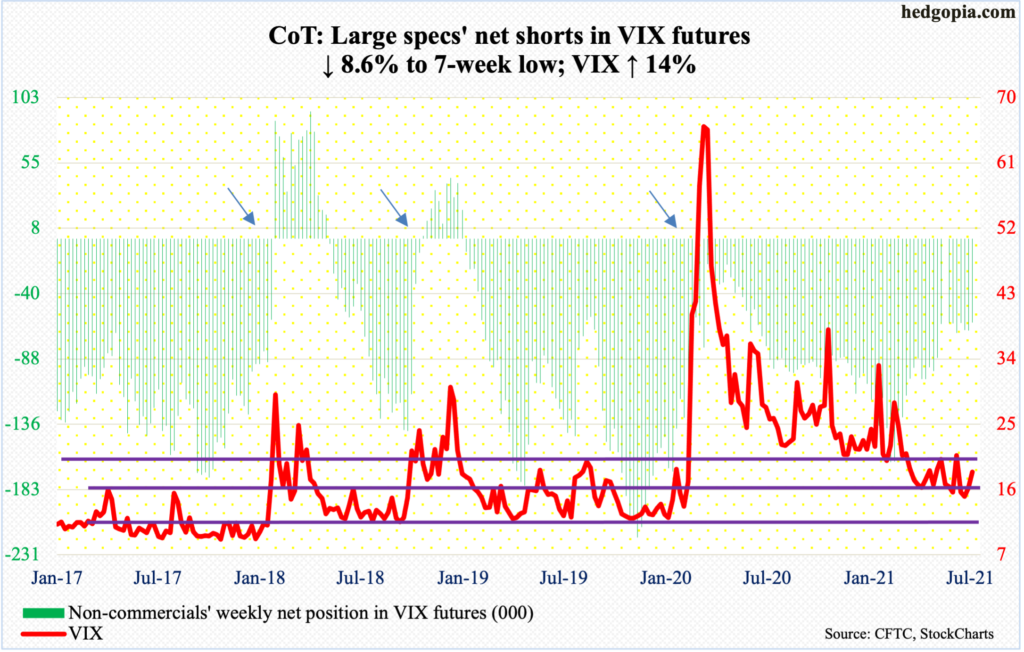
Barring an intraday dip just below 16 on both Tuesday and Wednesday, VIX held firm, ending the week up 14 percent to 18.45.
On the monthly, the volatility index is itching to rally. For that to happen, it will need cooperation from the daily and weekly.
The 50-day is now flattish, likely getting ready to turn up. The problem with volatility bulls has been their inability to hold on to rallies. Unless this changes, it remains bears’ ball to lose.
There was straight-line resistance at 18, which was reclaimed on Friday. Bulls can now think about going after low-20s. A takeout of 21.29, which was posted on the 8th, will establish a higher high.
Thanks for reading!
