
Following futures positions of non-commercials are as of August 24, 2021.
10-year note: Currently net long 113.3k, down 31.9k.
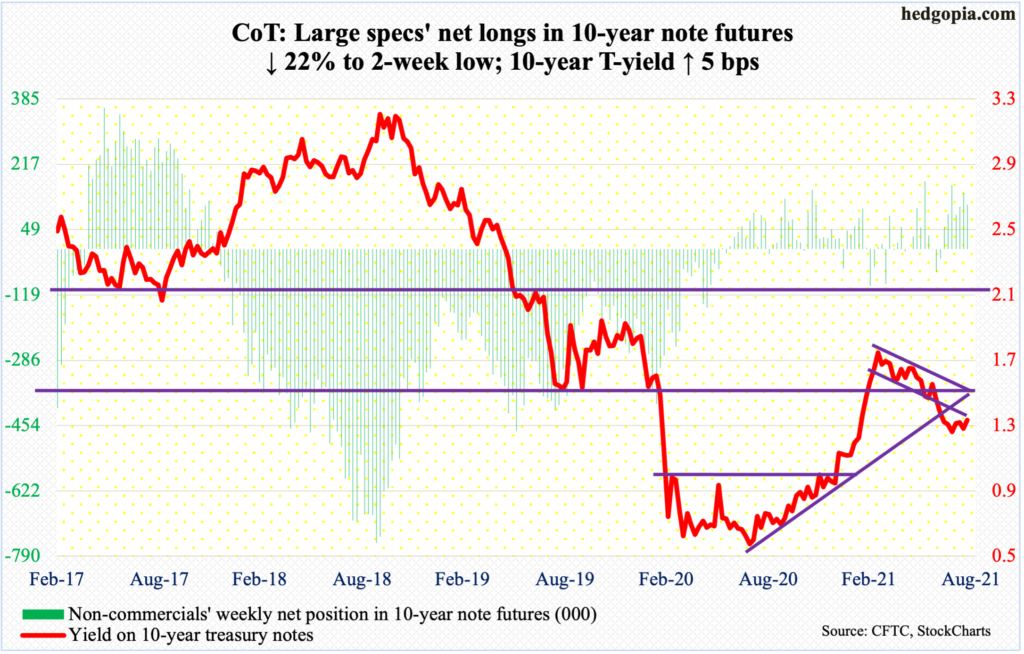
It turned out to be quite an anticlimax – Federal Reserve Chair Jerome Powell’s virtual speech at the Jackson Hole symposium, that is. On Friday, he indicated that the central bank is getting ready to taper its bond purchases by the end of the year.
Currently, the Fed buys up to $80 billion in treasury notes and bonds and $40 billion in mortgage-backed securities. It is sitting on $8.3 trillion in assets, nearly twice what it held in March last year.
Powell’s speech confirmed markets’ fears that tapering would begin later this year. But their reaction function on Friday was anything but disrupting. Both bonds and equities celebrated, with the ten-year treasury yield dropping three basis points to 1.31 percent and the S&P 500 rising 0.9 percent to yet another record high. These assets probably paid more attention to something else Powell said – that rate hikes are not imminent. He said there is “much ground to cover” before that happens.
But tapering – or QE removal – surely is stealth tightening. Currently, the Fed is using its balance sheet to put downward pressure on the long end of the yield curve. Once this support gets gradually removed, it will be influencing only the short rates. Now that tapering is nearing, the next step logically is a rise in the fed funds rate – timing notwithstanding. Markets are forward looking and should begin to reflect these new dynamics sooner or later.
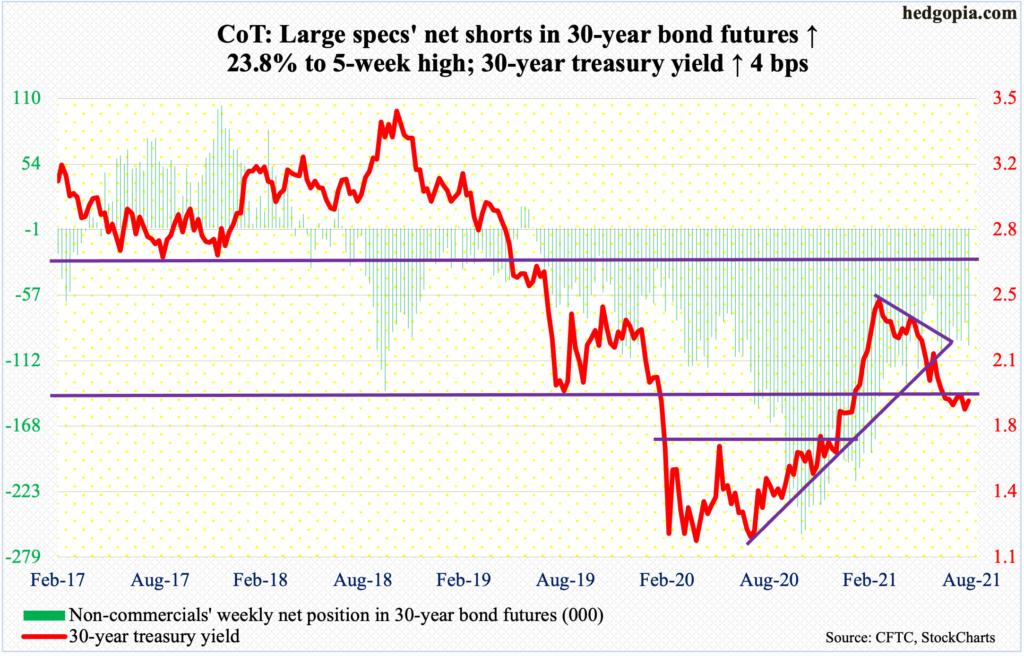
30-year bond: Currently net short 99.3k, up 19.1k.
Major economic releases for next week are as follows.
The S&P Case-Shiller home price index (June) is due out on Tuesday. Nationally, US home prices surged 16.6 percent year-over-year in May. Going back 45 years, this is the steepest y/y price appreciation ever.
The ISM manufacturing index (August) will be published on Wednesday. In July, manufacturing activity fell 1.1 points month-over-month to 59.5. This was the first sub-60 reading in six months.
Thursday brings labor productivity (2Q21, revised) and factory orders (July, revised).
Preliminarily in 2Q21, non-farm output/hour increased 2.3 percent, down from 1Q21’s 4.2 percent.
Preliminarily, July orders for non-defense capital goods ex-aircraft – proxy for business capex plans – were up 15.6 percent y/y to a seasonally adjusted annual rate of $76.5 billion, which is a record.
On Friday, payrolls (August) and the ISM non-manufacturing index (August) come out.
In July, 943,000 non-farm jobs were created, coming on the heels of June’s 938,000 addition. With this, from the post-pandemic low of 130.2 million in April last year, 16.6 million jobs have been created. This is still 5.7 million less than the record high of 152.5 million from February last year.
Services activity increased four points m/m in July to 64.1. This was the fifth consecutive 60-plus reading.
WTI crude oil: Currently net long 377.1k, down 7.4k.
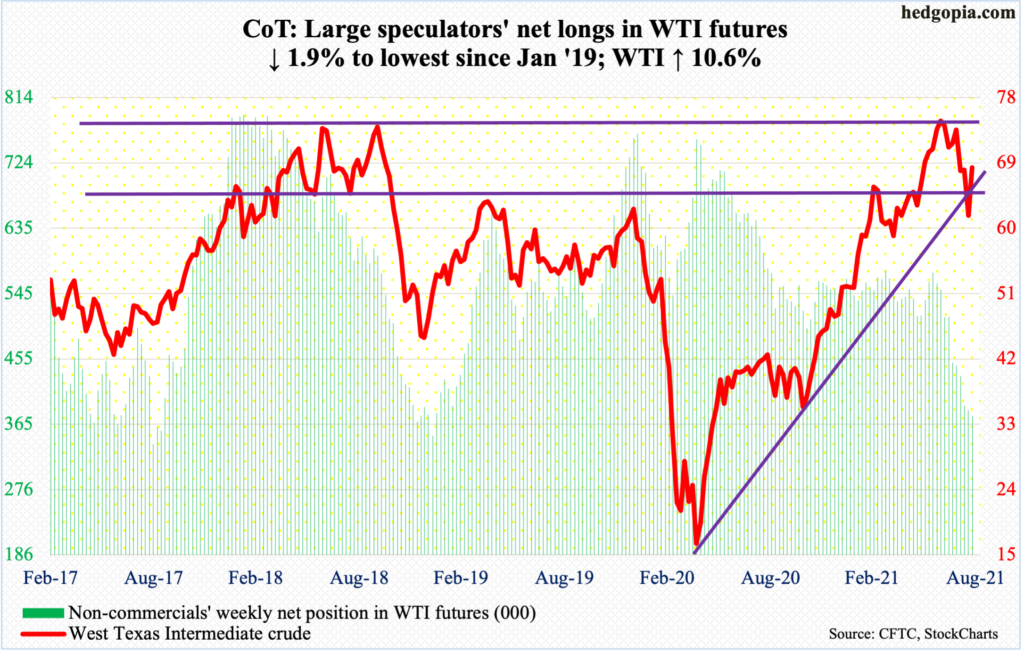
Bids showed up near last Friday’s low as Monday’s (this week) drop to $61.74 was aggressively bought. Just below at $60.89 lies the 200-day moving average. By Wednesday, WTI ($68.74/barrel) had recaptured broken-support-turned-resistance at $66-$67.
Around $71 lies a falling trend line from July 6 when the crude reversed lower after ticking $76.98. In October 2018, WTI peaked at $76.90. Last month’s high in all probability is a double top. The falling trend line from July 6 also lines up with the 50-day at $70.58. This will be an important test.
In the meantime, US crude production in the week to August 20 was unchanged at 11.4 million barrels per day. Crude imports dropped 193,000 b/d to 6.2 mb/d. As did stocks of crude and gasoline, which respectively declined three million barrels and 2.2 million barrels to 432.6 million barrels and 225.9 million barrels. Distillate stocks, however, rose 645,000 barrels to 138.5 million barrels. Refinery utilization inched up two-tenths of a percentage point to 92.4 percent.
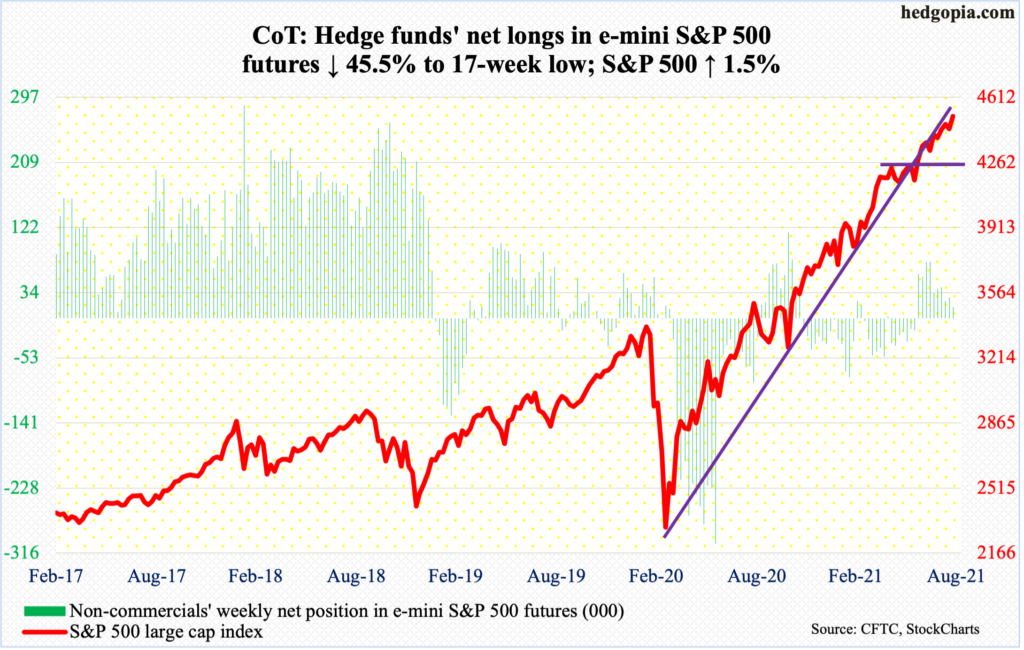
E-mini S&P 500: Currently net long 14.9k, down 12.4k.
For the first time in five weeks, US-based equity funds experienced outflows, losing $6.4 billion in the week to Wednesday (courtesy of Lipper); in the prior four, $28.8 billion came in. This also held true with SPY (SPDR S&P 500 ETF), VOO (Vanguard S&P 500 ETF) and IVV (iShares Core S&P 500 ETF), which lost $3.7 billion in the week to Wednesday (courtesy of ETF.com); in the prior four, the ETFs took in $11.5 billion.
Outflows notwithstanding, the S&P 500 picked up where it left off. Last Thursday, the large cap index ticked 4368 to find support just above the 50-day. This was the 10th defense of the average beginning May last year (more on this here). This Friday, it posted a new intraday high of 4513, closing at 4509.
Until the 50-day (4378) gives way, momentum remains with the bulls.
Euro: Currently net long 24.6k, down 33k.
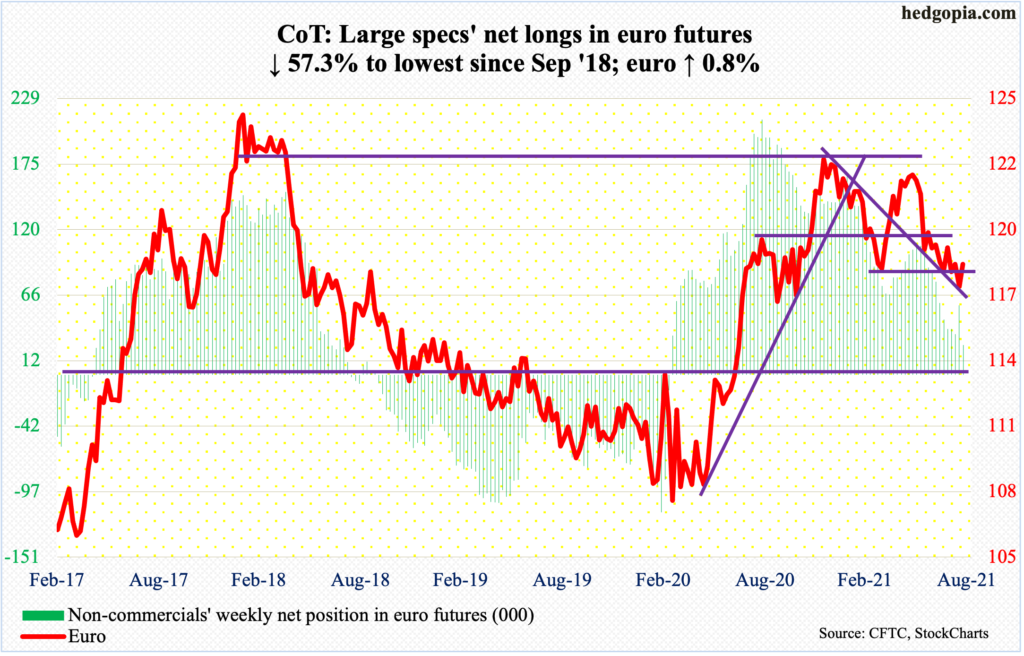
Last Friday’s low of $1.1664 held. This week, the euro got going right off the blocks, gapping up on Monday and quickly retaking $1.1710s.
The currency ($1.1797) ended the week right on a falling trend line from May 25 when it retreated after ticking $1.2268. Once this roadblock gives way – likely next week – resistance at $1.19-$1.20 comes into focus.
Gold: Currently net long 210.7k, up 19.1k.
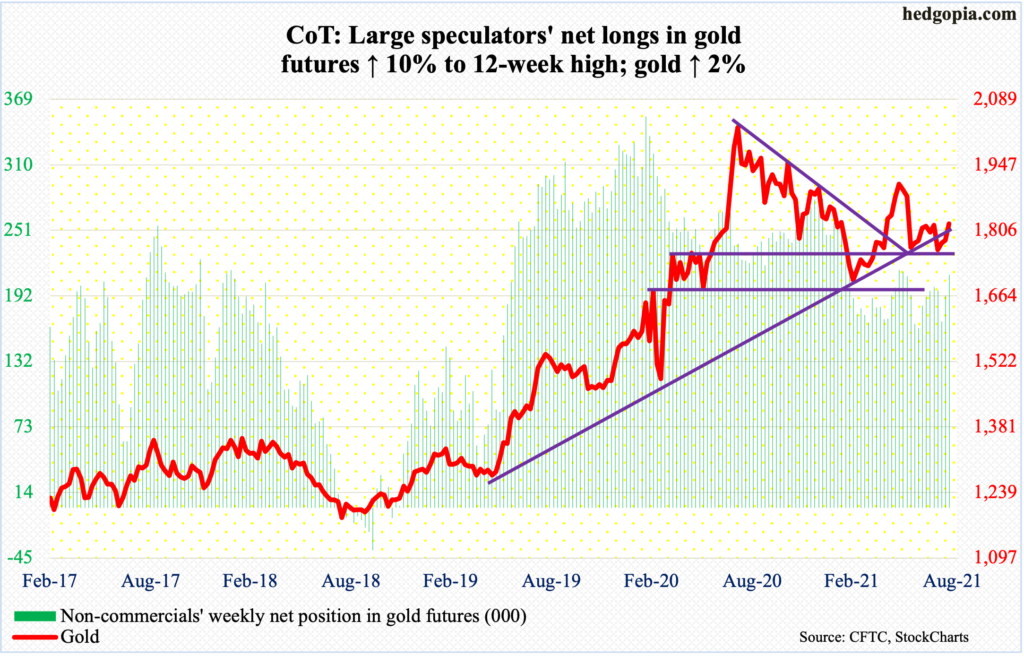
GLD (SPDR Gold ETF) and IAU (iShares Gold Trust) continued to bleed, respectively down $770 million and $37 million in the week to Wednesday (courtesy of ETF.com). In the last nine weeks, they have had only one positive week, cumulatively losing $2.6 billion and $511 million, in that order.
Despite this, gold ($1,819.50/ounce) held its own. This week, it was up two percent – its third up week in a row. On Friday, the metal rallied past the 200-day as well as a falling trend line from June when it retreated after posting $1,919.
Non-commercials are warming up, with net longs at a 12-week high.
On August 9, the metal found support at $1,670s, subsequently reclaiming $1,760s-$1,770s. Earlier on June 1, gold retreated after posting $1,919 – failing to recapture $1,920s, which will once again come into focus once $1,830s, which has acted as a roadblock for a month and a half now, buckle under.
Nasdaq 100 index (mini): Currently net short 2.4k, down 19.5k.
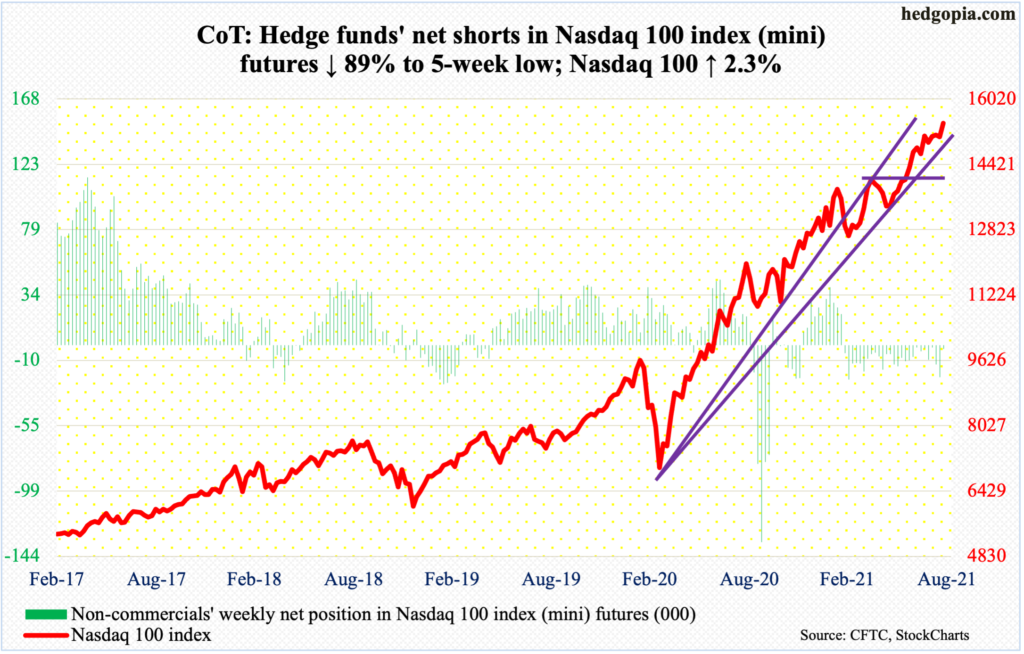
After consolidating around 15100s for a month, the Nasdaq 100 (15433) broke out this week, with a weekly bullish marubozu candle. This followed a successful test of the 50-day on Thursday last week.
Concurrently, the Nasdaq 100 advance-decline line posted a fresh high on Friday. This is in contrast to how the Nasdaq composite is behaving where the index posted a new high on Friday but the A-D line peaked as far back as February this year (more on this here).
The important thing is if tech bulls would be able to save this week’s breakout in the Nasdaq 100 in the sessions ahead and if the A-D line would continue to move hand in hand. A divergence will have raised a red flag, as it will have confirmed the non-confirmation within the Nasdaq composite.
Russell 2000 mini-index: Currently net short 72.9k, up 8.2k.
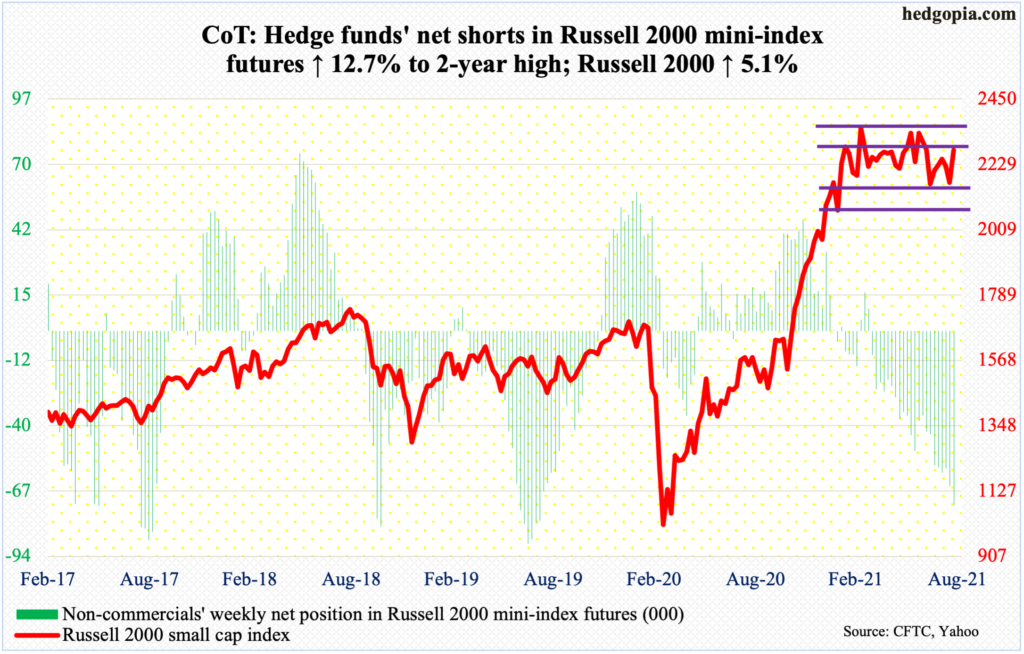
Last week, small-cap bulls just about defended box support at 2080s, as a drop to 2120s on Thursday and Friday was bought. This week began with Monday’s gap-up. By Wednesday, the Russell 2000 (2277) tested 2250s, and it failed. Come Friday, bulls romped past this resistance to test 2280s, which has not been tested since the second week of July. A breakout opens the door toward the upper bound of a rectangle. The small cap index has been going back and forth between 2350s and 2080s for five and a half months.
This is taking place at an important juncture. Non-commercials are sitting on two-year-high net shorts. It is possible they got squeezed on Friday when the Russell 2000 rallied 2.9 percent. There is room for more should 2280s give way, not to mention 2350s.
US Dollar Index: Currently net long 20.4k, up 1.2k.
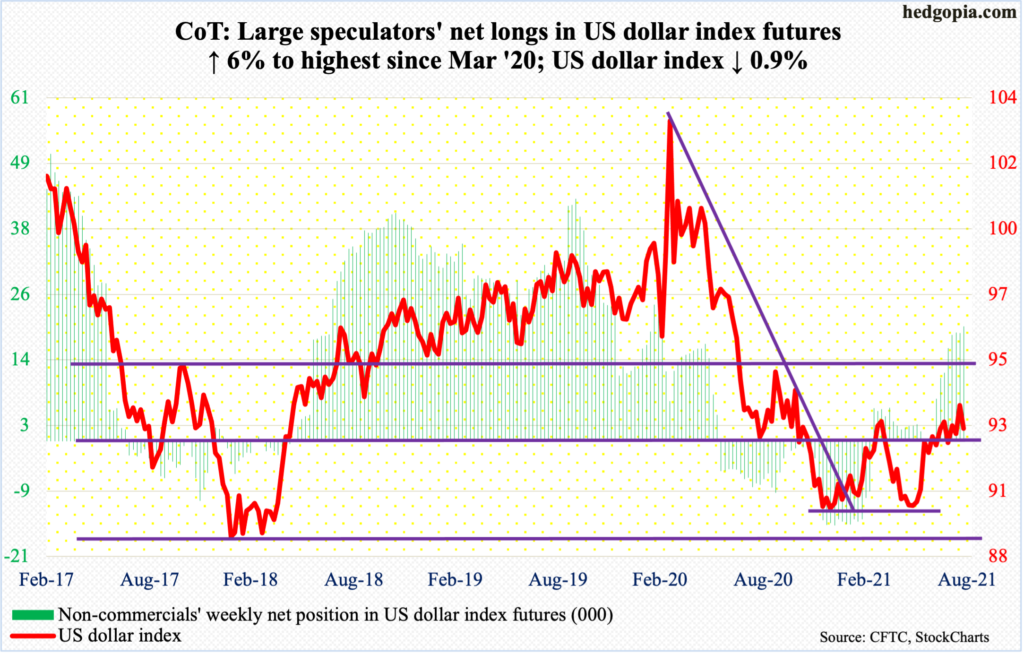
The US dollar index (92.69) had a strong week last week, having staged a mini breakout just north of 93, ticking 93.75 on Friday. This established a pattern of higher highs and higher lows. So, as things stand, the trend is higher.
This week, the index gave back 0.9 percent. Near term support at 93 is gone. Next is just north of 92, which is crucial. Before that lies the 50-day at 92.55, which coincides with a rising trend line from May 25. A loss of this swings near-term momentum to bears’ favor.
VIX: Currently net short 73.1k, down 13.7k.
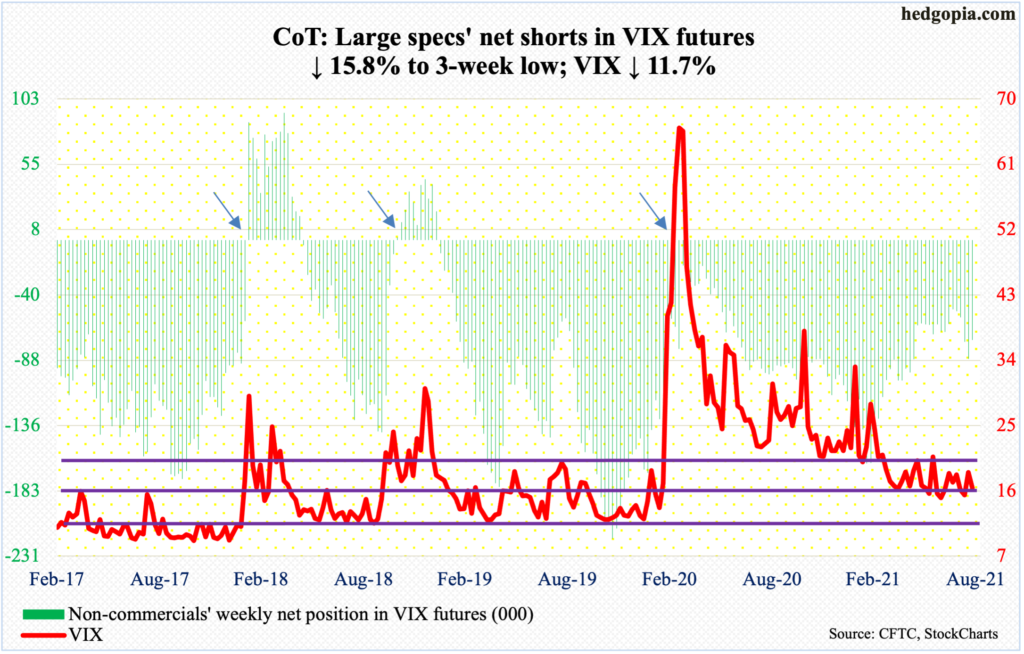
Last Thursday’s spike reversal quickly resulted in the loss of the 200- and 50-day (20.29 and 17.44 respectively). This week, VIX (16.39) remained under the 50-day in four of the five sessions.
Longer term, the monthly has room to rally.
Near term, volatility bears have the upper hand. Bulls need to take out 24.74, which was the spike reversal high from August 19, before they hope to gain momentum.
Thanks for reading!
