
Following futures positions of non-commercials are as of October 26, 2021.
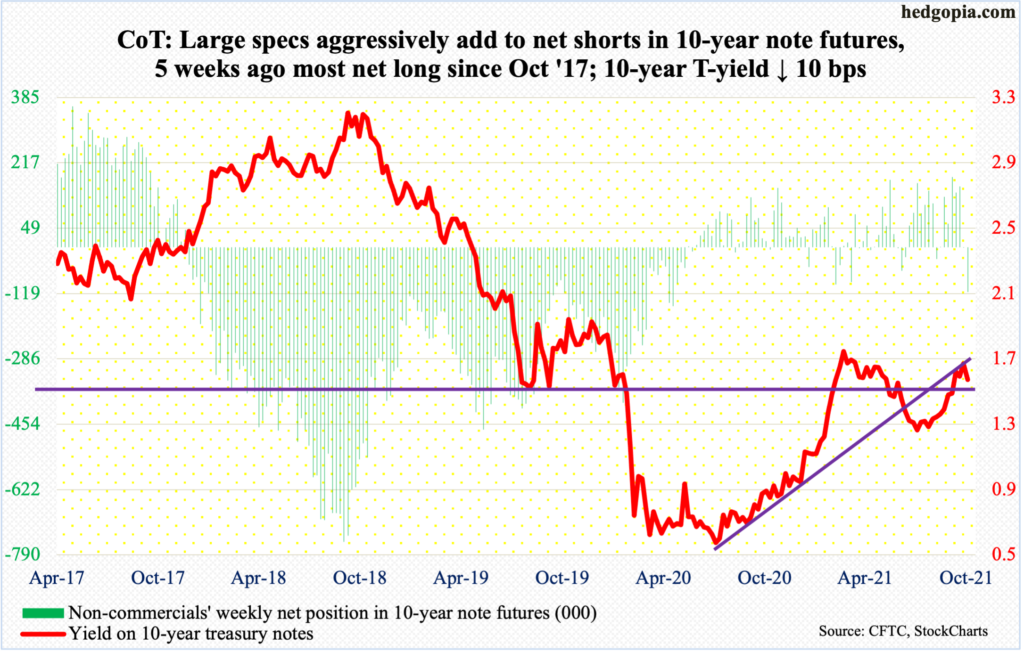
10-year note: Currently net short 114.8k, up 114.3k.
The FOMC meets next week. This is the year’s seventh meeting. After this, one more remain.
At the September 21-22 meeting, Chair Jerome Powell set the stage for a tapering announcement in November. They will likely announce one next week, or in the December 14-15 meeting for sure.
The Fed currently buys up to $120 billion a month in treasury notes and bonds ($80 billion) and mortgage-backed securities ($40 billion). Its asset base has more than doubled from $4.24 trillion in early March last year to $8.56 trillion. Assuming they taper by $20 billion a month, they would have stopped buying these securities by the middle of next year.
Then comes the fed funds rate, which remains zero-bound. At the September 21-22 meeting, there were hints that rates may rise sooner than expected. The 18-person FOMC was evenly split on the prospects for a rate hike next year. Markets have other ideas. They would like the Fed to act sooner.
The CME’s FedWatch Tool is currently forecasting up to two 25-basis-point hikes by December next year. Concurrently, the two-year treasury yield, which tends to be the most sensitive to Fed policy action, has rallied from just north of 20 basis points five weeks ago to 48 basis points.
At next week’s meeting, Powell likely will reiterate his ‘lower for longer’ mantra, but markets are unlikely to blink. If history is guide, the latter tend to eventually win out in this staring game.
In the meantime, non-commercials are aggressively betting on higher 10-year rates, even as short interest on TLT (iShares 20+ Year Treasury Bond ETF) has spiked, raising odds of a short squeeze (more on this here).
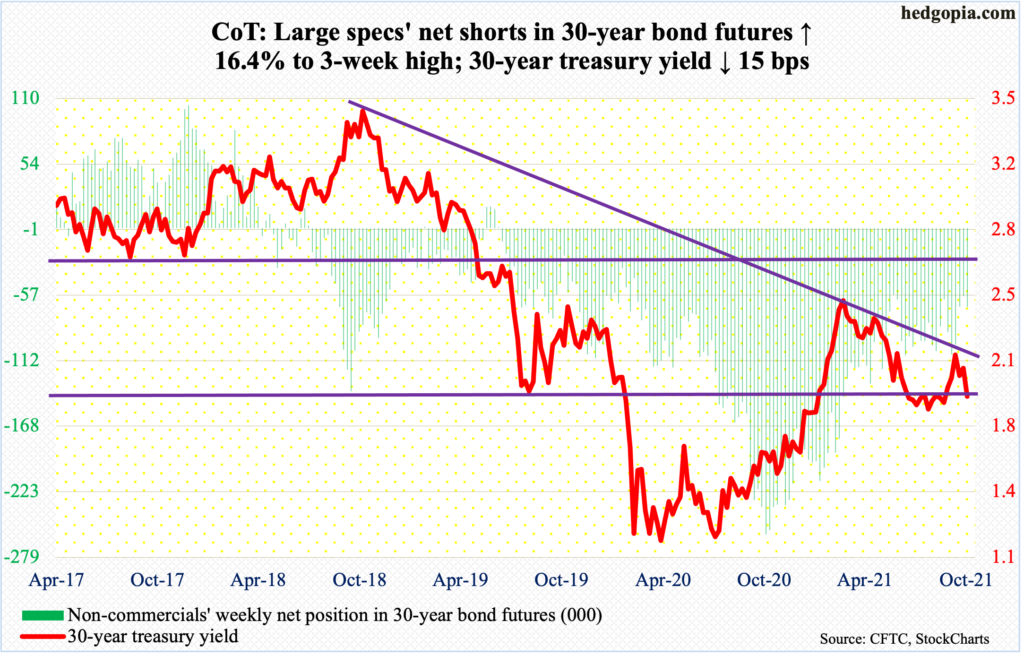
30-year bond: Currently net short 67k, up 9.4k.
Major economic releases for next week are as follows.
The ISM manufacturing index (October) comes out on Monday. Manufacturing activity in September increased 1.2 percentage points month-over-month to 61.1 percent.
Wednesday brings the ISM non-manufacturing index (October) and durable goods orders (September, revised).
Services activity in September edged up two-tenths of a percentage point m/m to 61.9 percent – the seventh 60-plus reading in a row.
Preliminarily, September orders for non-defense capital goods ex-aircraft – proxy for business capex plans – increased 13.2 percent year-over-year to a seasonally adjusted annual rate of $77.7 billion.
Labor productivity (3Q21) is due out on Thursday. Non-farm output per hour rose 1.8 percent in 2Q21 from a year ago – the slowest pace in five quarters.
Non-farm payroll (October) will be published on Friday. September only produced 194,000 non-farm jobs, versus 366,000 in August and 1.09 million in July. From the post-pandemic low of April last year, 17.4 million jobs have been added. September’s tally of 147.6 million is still five million short of the record 152.5 million from February last year.
WTI crude oil: Currently net long 449.6k, down 3.2k.
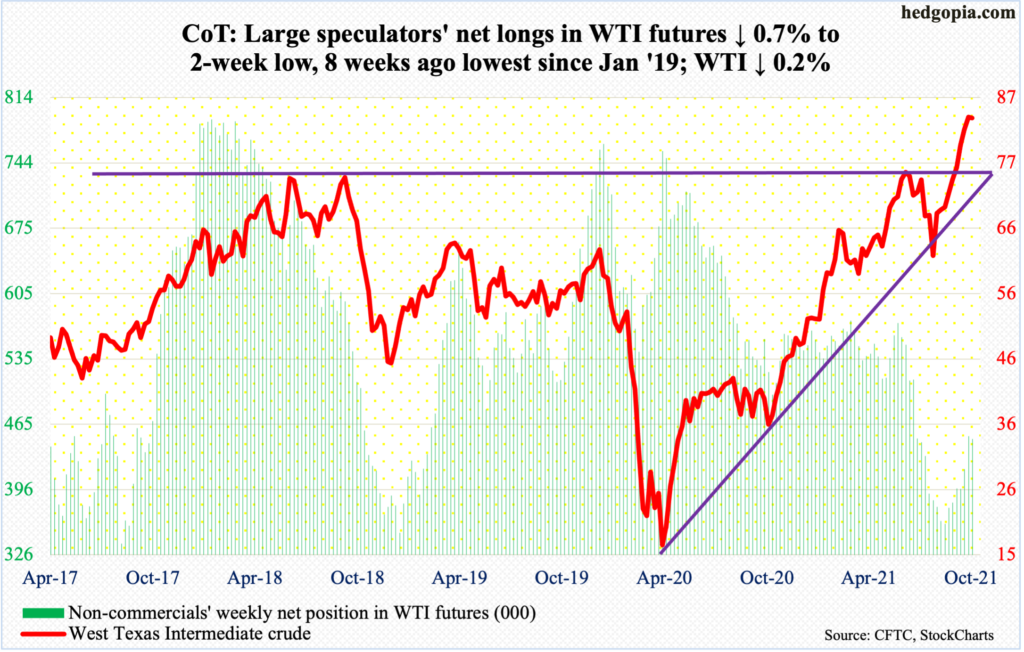
WTI ($83.57/barrel) began the week by tagging $85.41 – a seven-year high – intraday Monday but only to then sharply reverse lower to end the session flat. By Thursday, the crude dropped as low as $80.58 to successfully test its 20-day, which again drew bids on Friday. The average has not been breached in two months. So, it is obvious oil bulls will not give in that easy. Yet, odds seem to be stocking up against them, as conditions are way overbought.
For the week, WTI edged 0.2 percent lower, forming a spinning top. This was the first down week in 10. The 20-day also approximates a rising trend line from August 23 when the crude bottomed at $61.74. Right now, it gets tested around $81, and is the one to watch.
Meanwhile, US crude stocks in the week to October 15 jumped 4.3 million barrels to 430.8 million barrels. Crude imports rose as well – up 429,000 barrels per day to 6.3 million b/d. Crude production remained unchanged at 11.3 mb/d, while stocks of gasoline and distillates fell two million barrels and 432,000 barrels to 215.7 million barrels and 125 million barrels respectively. Refinery utilization increased four-tenths of a percentage point to 85.1 percent.
E-mini S&P 500: Currently net long 96.5k, up 28.9k.
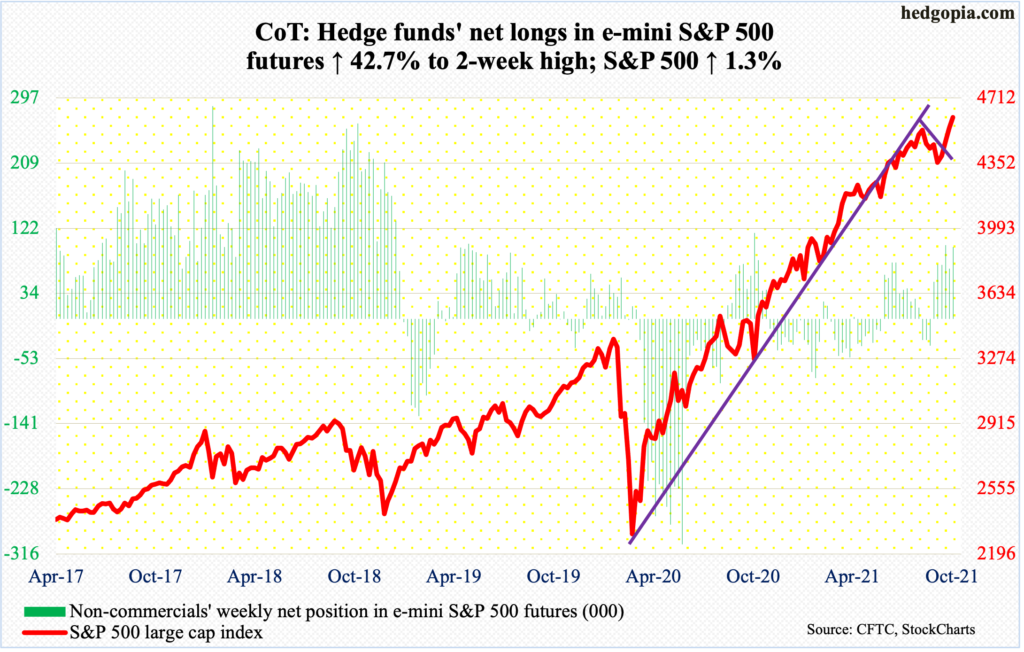
Monday’s breakout at 4540s was quickly retested on Wednesday, followed by bullish marubozu candles on Thursday and Friday.
Earnings are coming in better than expected, but the S&P 500 (4605) also rallied more than 300 points in three weeks, having bottomed at 4279 on the 4th.
For the month, the large cap index rallied 6.9 percent, negating September’s potentially bearish outside month.
Bulls hope flows continue to cooperate. In the week to Wednesday, US-based equity funds took in $15.1 billion (courtesy of Lipper). In the same week, SPY (SPDR S&P 500 ETF), VOO (Vanguard S&P 500 ETF) and IVV (iShares Core S&P 500 ETF) gained $11.8 billion (courtesy of ETF.com). In the prior week, they respectively gained $10.9 billion and $3.2 billion.
The daily is extremely overbought. In the event the index comes under pressure, 4540s will decide if longs or shorts will have momentum near term.
Euro: Currently net short 11.3k, down 851.
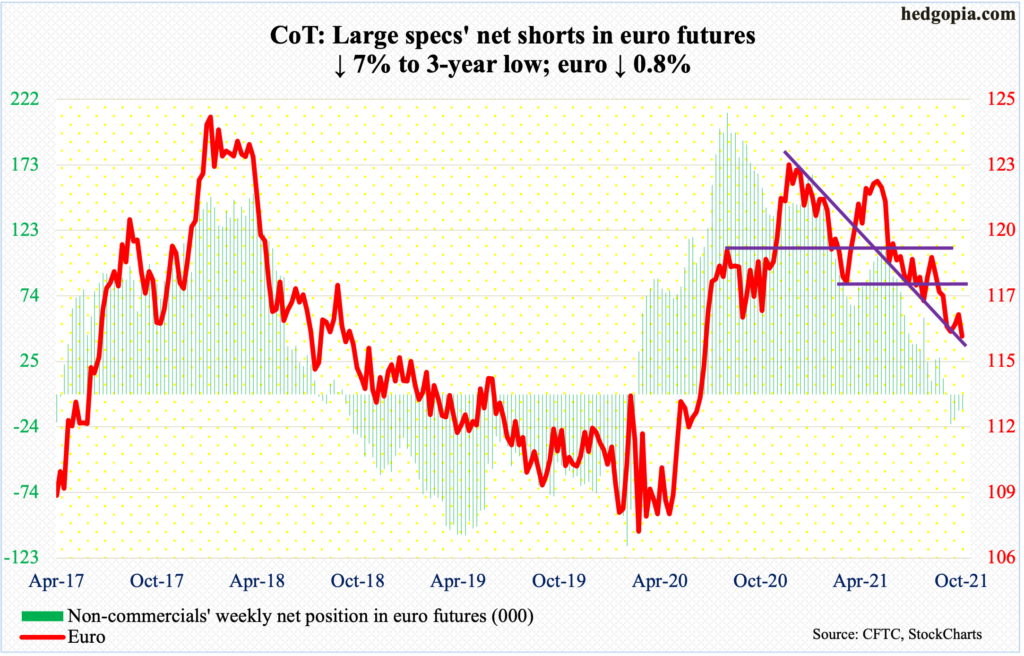
The euro ($1.1554) remained under last week’s close in the first three sessions before rallying 0.7 percent on Thursday to test the 50-day ($1.1694). The ECB met in that session. President Christine Lagarde pushed back on markets’ increasing bets on rate rise, saying the central bank is in no hurry to tighten its ultra-loose policy. The collective wisdom of markets thought otherwise. The currency was well bid on Thursday. Come Friday, they recalibrated their expectations, pushing the currency lower 1.1 percent. There is confusion all around.
The October 12 low of $1.1525 is a stone’s throw away. Horizontal support just south of $1.15 goes back 18 years. Bulls cannot afford to lose this.
Gold: Currently net long 214.6k, up 21.2k.
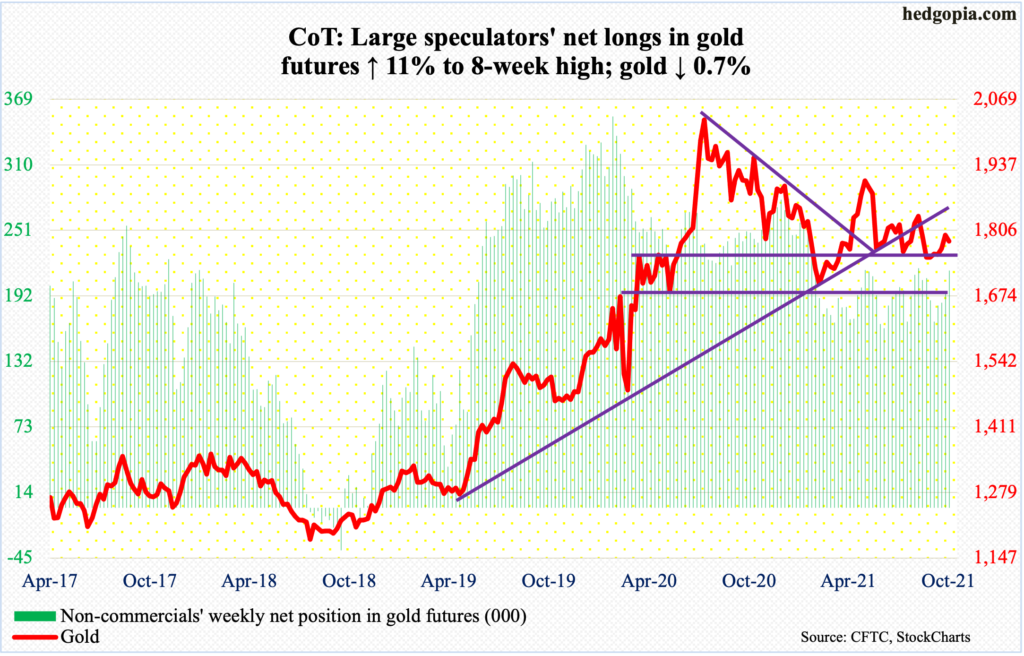
Gold bugs went after last week’s high of $1,816 but came up slightly short, with the metal ($1,784/ounce) touching $1,813 intraday Thursday before retreating. For the week, it fell 0.7 percent.
Crucial support at $1,760s-$1,770s is intact and likely gets tested in the sessions ahead. So long as gold remains above this level, bulls deserve the benefit of the doubt.
Nasdaq 100 index (mini): Currently net short 3.3k, up 198.
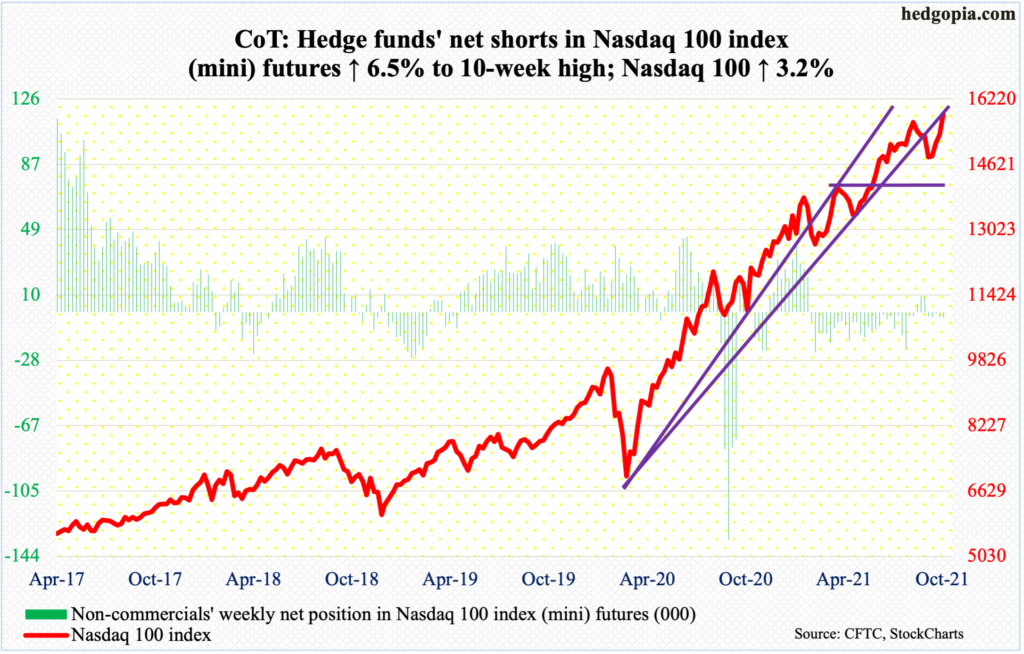
It was a big week for tech earnings. Of the top six, Tesla’s (TSLA) results were widely embraced last week. This week, Apple (AAPL), Microsoft (MSFT), Amazon (AMZN), Google owner Alphabet (GOOG) and Facebook (FB) drew mixed reaction. AAPL, AMZN and FB sold off post-earnings, while MSFT and GOOG rallied. In the end, the Nasdaq 100 rallied 3.2 percent to a new high – past the September 7 high of 15701.
How these six stocks trade in the sessions/weeks ahead will make or break a market cap-weighted index like the Nasdaq 100. TSLA is going parabolic, up 22 percent last week alone, to a new high; it is up 42 percent in the last three weeks. MSFT rallied 7.3 percent last week to a fresh high; ditto with GOOG which jumped seven percent. FB, on the other hand, is just above its 200-day and below the 50-day. AMZN closed right on its 50-day and slightly above its 200-day. AAPL is safely above the 200-day but is just slightly above the 50-day.
In other words, the leading six are diverging in their performance.
On Friday, the Nasdaq 100 (15850) produced a bullish marubozu/engulfing candle. Bulls’ real test lies when 15700s gets retested, which is not that far away.
Russell 2000 mini-index: Currently net short 54.4k, down 4.9k.
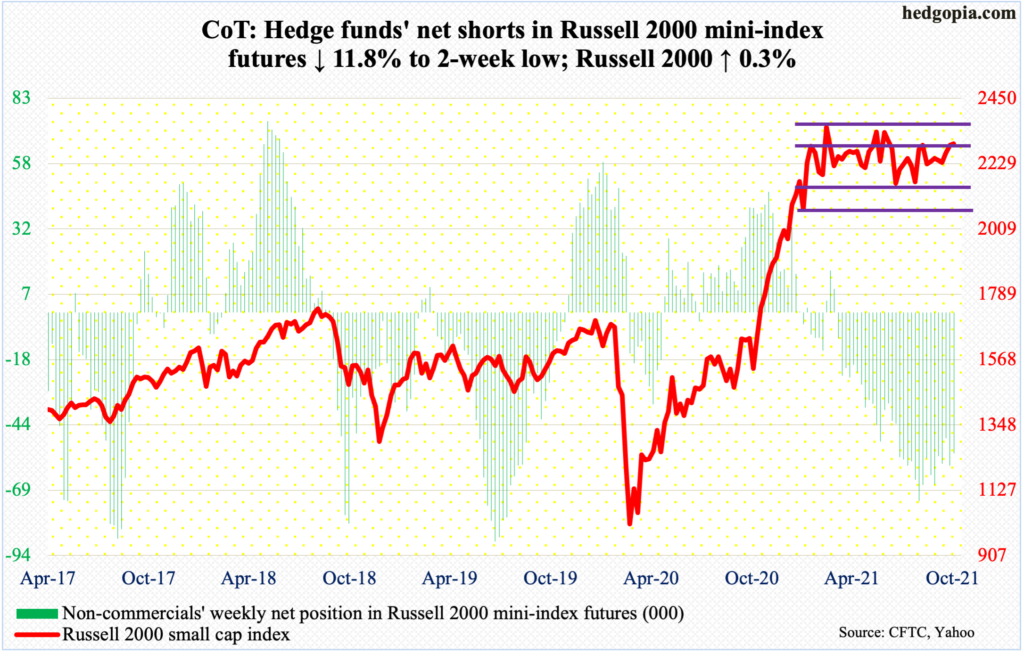
Once again, small-cap bulls failed to hang on to the gains. At Tuesday’s high of 2321, the Russell 2000 small cap index was up 1.3 percent for the week and 1.7 percent from its all-time high of 2360 posted this March. By the end of the week, the small cap index closed up merely 0.3 percent.
From bulls’ perspective, the good thing – if it can be called that – is that the index (2297) remains above 2280s. For seven and a half months now, the Russell 2000 has been rangebound between 2350s and 2080s, and between 2280s and 2150s within this rectangle. Further, straight-line support at 2250s was defended both Thursday and Friday.
Be that as it may, the fact remains that the index is stuck within a range, and until it breaks one way or the other, the ping pong game continues.
US Dollar Index: Currently net long 34.5k, down 1.5k.
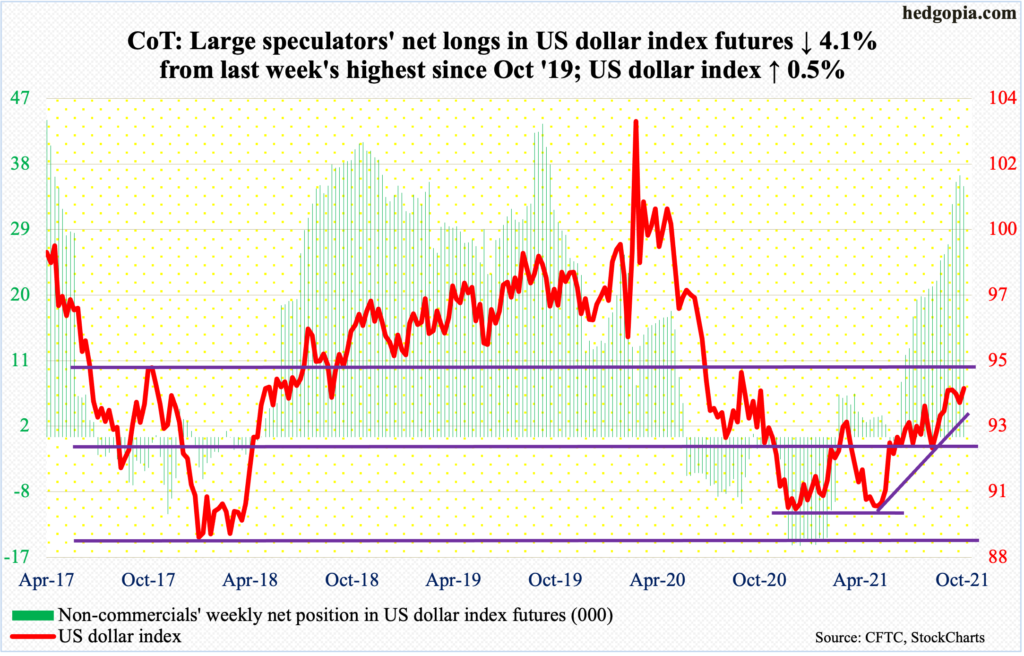
Horizontal support at 93.50s held for seven consecutive sessions before the US dollar index pierced through it on Thursday, testing the 50-day (93.38) as well as a rising trend line from May 25 when it bottomed at 89.51. Bulls were not in a mood to lose this trend line, rallying the index 0.8 percent on Friday to 94.12.
There is room for further rally on the daily. Nearest resistance lies at 94.50s.
VIX: Currently net short 101.6k, up 14.8k.
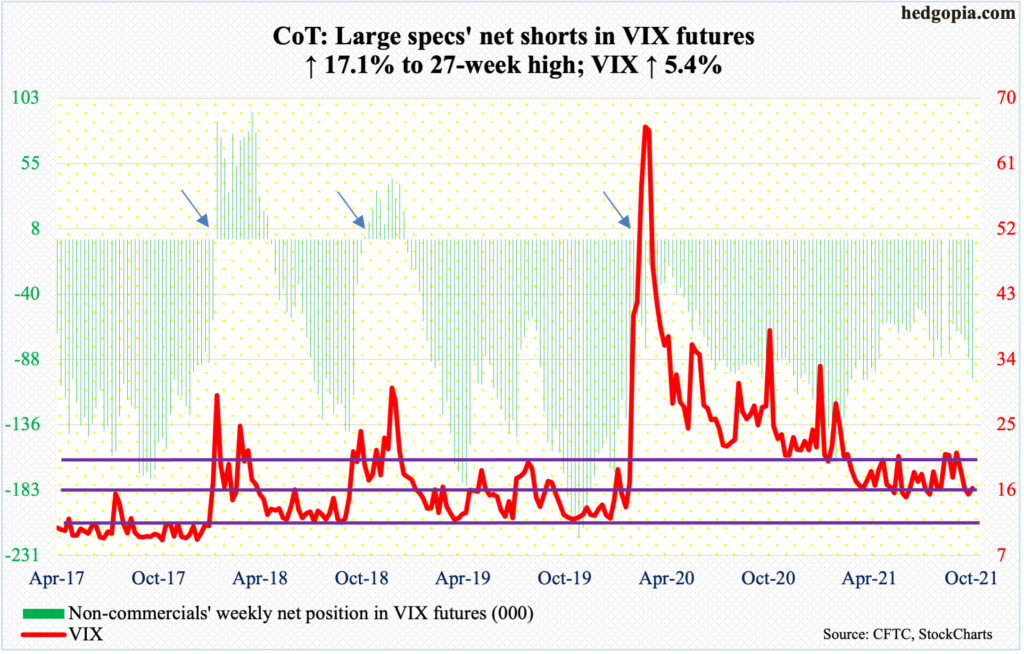
A doji formed on the weekly, which was up 5.4 percent. This follows three consecutive down weeks – and in four out of the last five. Both VIX and the S&P 500 rallied this week, which is a rare phenomenon.
On both the daily and weekly, the volatility index (16.26) can rally in the right circumstances. Nearest resistance lies at 18, which as a matter of fact was unsuccessfully tested on Friday.
Concurrently, the ratio of VIX to VXV ended the week at 0.798, following last week’s 0.771. This is gross oversold territory (more on this here).
Thanks for reading!
