
Following futures positions of non-commercials are as of November 16, 2021.
10-year note: Currently net short 294.1k, up 26.8k.
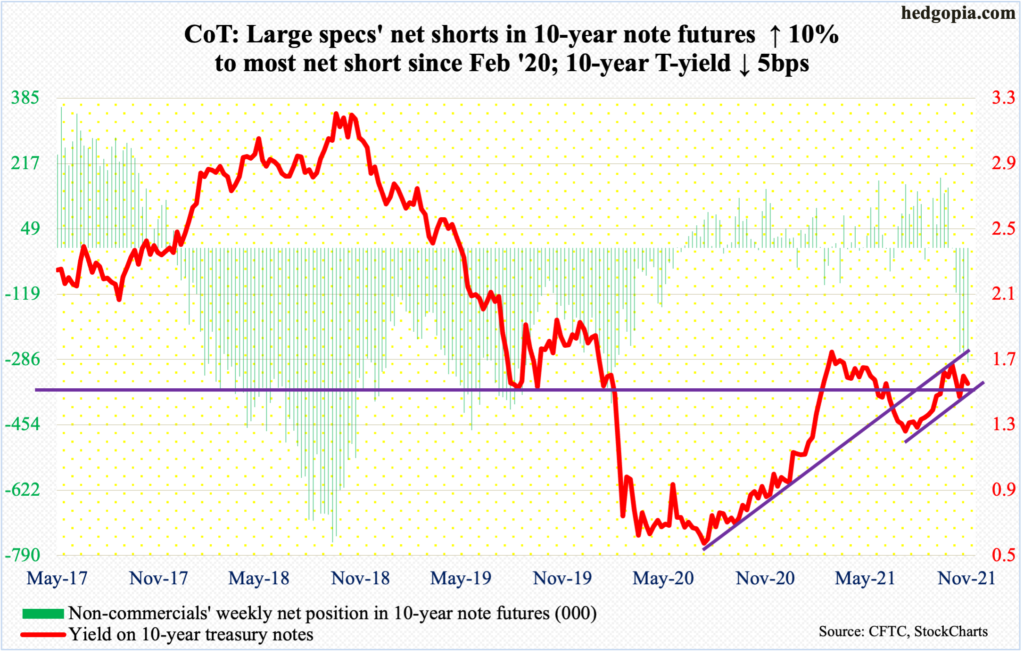
Minutes for the FOMC meeting on November 2-3 will be out next Wednesday. At the conclusion of the meeting, the Fed announced it would begin to reduce its monthly bond purchases by $15 billion later this month.
It buys up to $120 billion in treasury notes and bonds ($80 billion) and mortgage-backed securities ($40 billion). The balance sheet more than doubled from $4.24 trillion in early March last year to $8.67 trillion. At the end of the tapering by the middle of next year, the central bank’s assets will have crossed $9 trillion (more on this here).
So, unless there is some additional color on the path for rate hike next year, markets are likely to treat next week’s minutes with a yawn. In the post-meeting press conference, Chair Jerome Powell said the Fed can be patient in raising interest rates. Markets are not buying it.
In the futures market, the CME’s FedWatch Tool currently projects up to two 25-basis-point hikes, from the current range of zero to 25 basis points. Historically, markets tend to have their way – eventually. Time will tell.
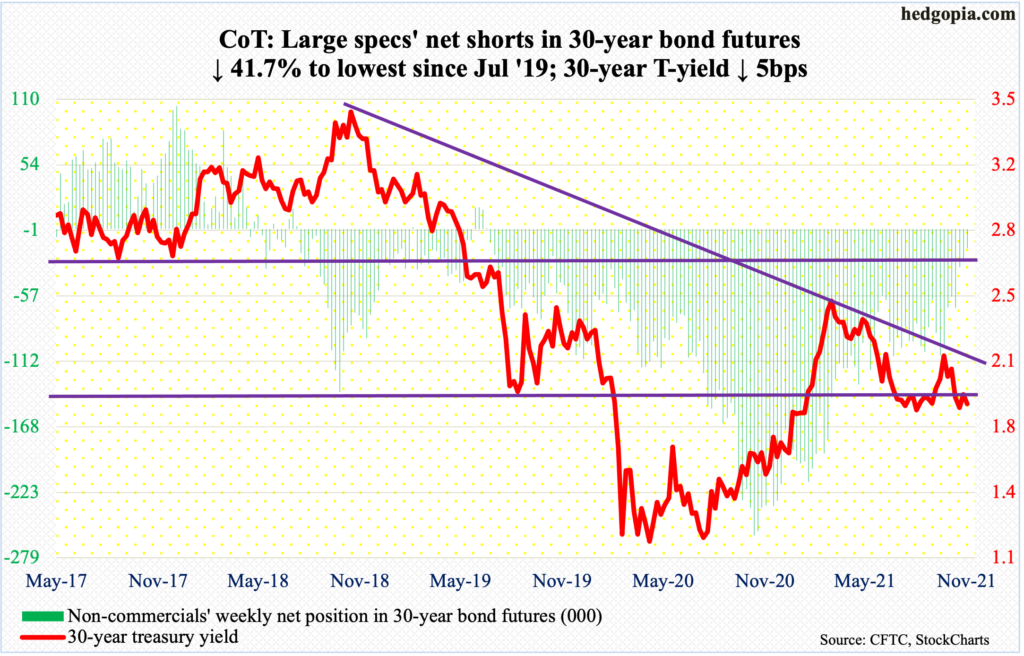
30-year bond: Currently net short 16.4k, down 11.7k.
Major economic releases for next week are as follows. Happy Thanksgiving!
Existing home sales (October) are due out on Monday. In September, sales increased seven percent month-over-month to a seasonally adjusted annual rate of 6.29 million units – an eight-month high.
Wednesday brings GDP (3Q21, 2nd print), corporate profits (3Q21, 1st estimate), durable goods orders (October), personal income/spending (October), new home sales (October) and the University of Michigan consumer sentiment index (November, final).
The first estimate showed real GDP grew two percent in 3Q21. This represents massive growth deceleration from 6.7 percent in 2Q and 6.3 percent in 1Q.
Corporate profits with inventory valuation and capital consumption adjustments grew 10.5 percent quarter-over-quarter in 2Q21 to $2.82 trillion (SAAR) – a new high.
Orders for non-defense capital goods ex-aircraft – proxy for business capex plans – rose 0.9 percent m/m in September to $77.8 billion (SAAR). It is a new high.
In the 12 months to September, core PCE (personal consumption expenditures), which is the Fed’s favorite measure of consumer inflation, rose 3.64 percent. This was the steepest price rise since May 1991.
Sales of new homes jumped 14 percent m/m in September to 800,000 units (SAAR) – a six-month high.
November’s preliminary reading showed consumer sentiment tumbled 4.9 points m/m to 66.8. This is a 10-year low.
WTI crude oil: Currently net long 447.1k, down 1.8k.
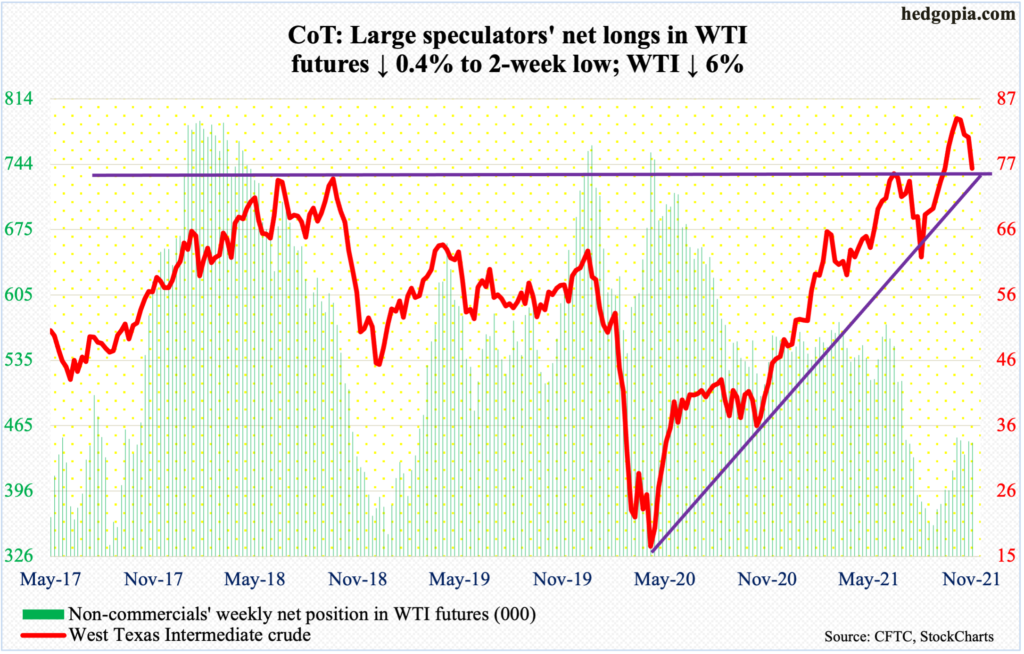
WTI ($75.94/barrel) suffered its fourth straight down week – down six percent this week. The 50-day moving average ($78.69) was breached. As was horizontal support at $76-$77, which the crude broke out of in early October.
A rising trend line from April last year when WTI bottomed at $6.50 (no typo) gets tested around $71, which also approximates straight-line support. The 200-day lies at $69.37.
In the meantime, US crude production in the week to November 12 fell 100,000 barrels per day to 11.4 million b/d. The EIA report also showed stocks of crude, gasoline and distillates all fell – down 2.1 million barrels, 707,000 barrels and 824,000 barrels to 433 million barrels, 212 million barrels and 123.7 million barrels respectively. Refinery utilization increased 1.2 percentage points to 87.9 percent. Crude imports rose 83,000 b/d to 6.2 mb/d.
E-mini S&P 500: Currently net long 111.2k, up 13.6k.
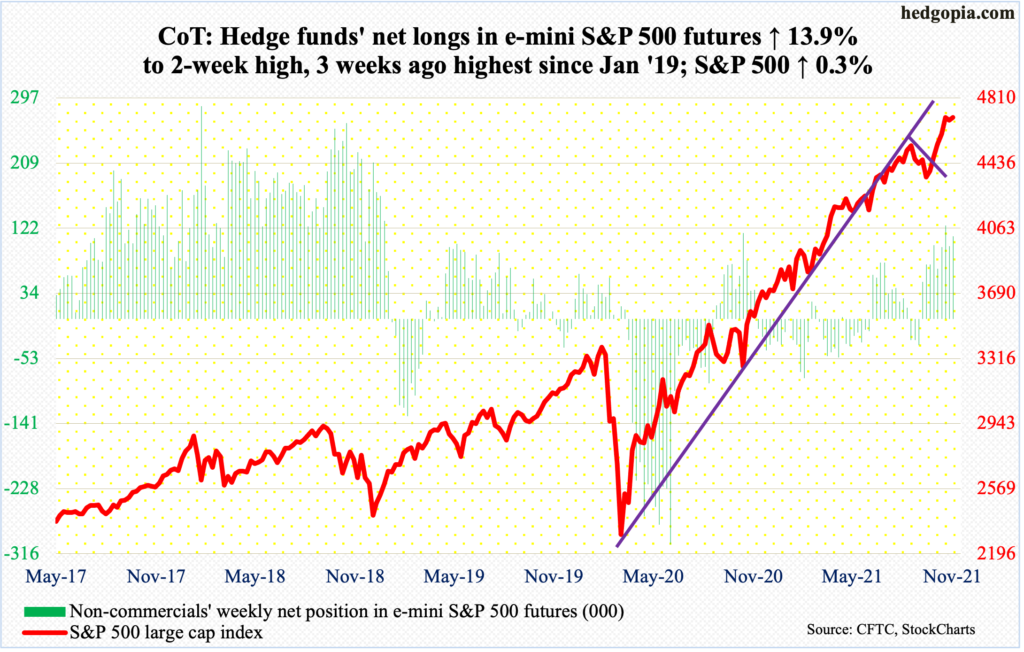
Since ticking 4719 on the 5th (this month), the S&P 500 (4698) has gone sideways within an ascending triangle. This pattern often tends to be bullish. The large cap index would break out at 4710s but can equally break down at 4700. A decision time is near.
On Thursday, it came close to falling out of the triangle in the first hour, with the index tagging 4673, breaching the 10-day, which is now flattish. Then equity bulls swung into action; by close, they rallied the index to 4705, resulting in a candle with a long lower shadow. As things stand, it is hard to tell if Thursday’s is a hammer (bullish) or a hanging man (bearish).
Come Friday, bulls again tried to stage a breakout, coming less than a point within the November 5 high but were rejected.
Also, the Nov 5 high came in a spinning top session, followed by a doji. These are all indications of fatigue, but at the same time favorable seasonality is in play. Anything could happen this time of the year. A breakout will further add to momentum. Through the Nov 5 high, the S&P 500 already rallied 10 percent in a month.
Euro: Currently net short 3.8k, up 7.6k.
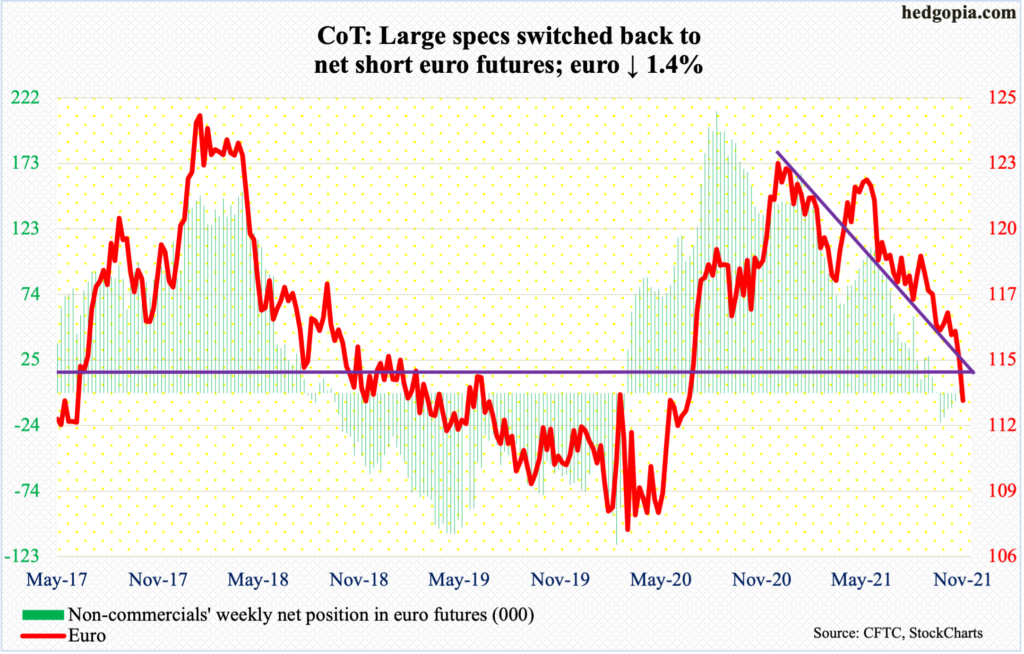
Alter losing $1.1530s last Wednesday, the euro ($1.1283) came under more pressure this week, starting with Monday’s 0.6-percent drop, piercing through $1.14. Support at $1.14-$1.15 goes back at least 18 years and that is now gone.
The currency is oversold on several timeframes. But it is yet to give out signs of stability. Worse, there is decent support at $1.05-$1.06.
Gold: Currently net long 259.8k, up 9.6k.
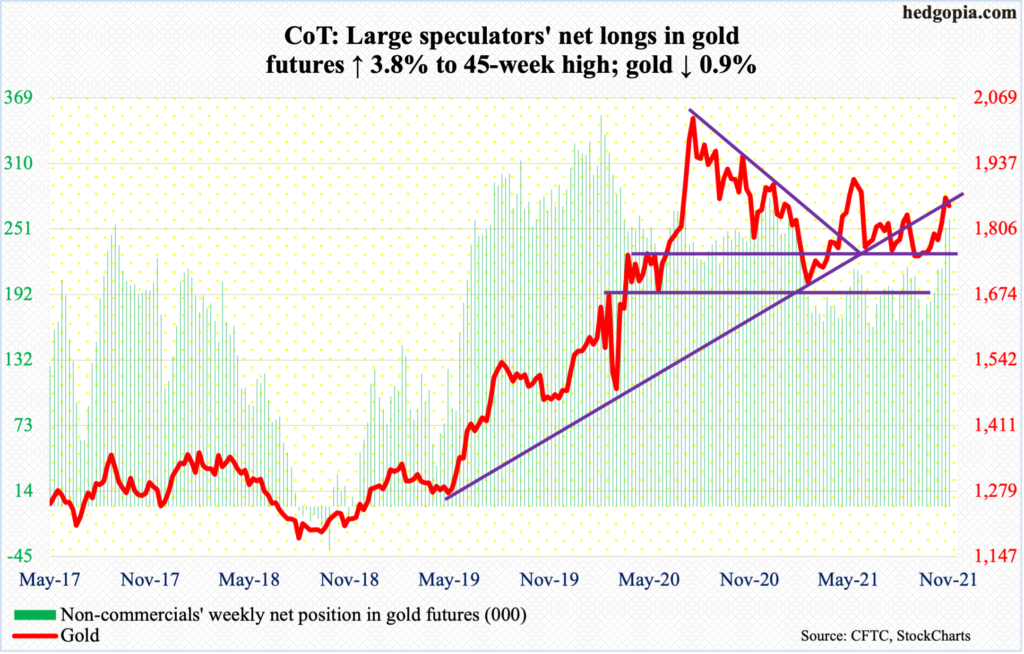
Last week, gold ($1,852/ounce) rallied 2.9 percent to break through a falling trendline from August last year when it peaked at $2,089. By Tuesday this week, it added another 0.6 percent to tag $1,880, but gold bugs were unable to hang on to the gains. For the last several sessions, bears consistently showed up at $1,870s.
So, it is possible the metal retreats here. Nearest support lies at $1,830s. A rising trend line from August 9 when gold bottomed at $1,670s extends to $1,770s. There is also horizontal support at $1,760s-$1,770s.
Back in September 2011, the yellow metal peaked at $1,924. The subsequent drop bottomed at $1,045 in December 2015. In the one year through June this year, gold hesitated around $1,920s several times. Bulls would love to have another go at it. They may have a shot at it eventually, should these support levels hold.
Nasdaq 100 index (mini): Currently net long 13.5k, down 2.7k.
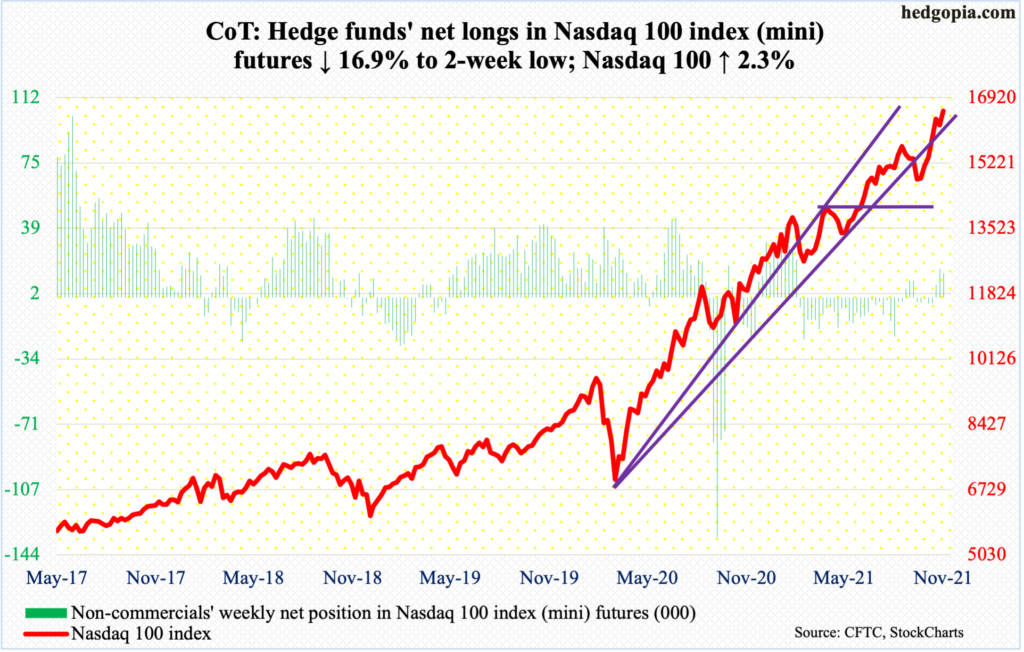
The Nasdaq 100 on Thursday edged higher to post a new intraday high of 16502, past the prior high of 16454 posted on the 5th (this month). This was followed by Friday’s fresh high 16626, which came in a doji session.
Tech bulls have an opportunity to reject last week’s hanging man, which showed up after five positive weeks in a row. But for that, the index (16573) needs to decisively break out of 16400s. This week’s 2.3-percent rally is a step in that direction but more needs to be done.
Russell 2000 mini-index: Currently net short 20.2k, down 4.4k.
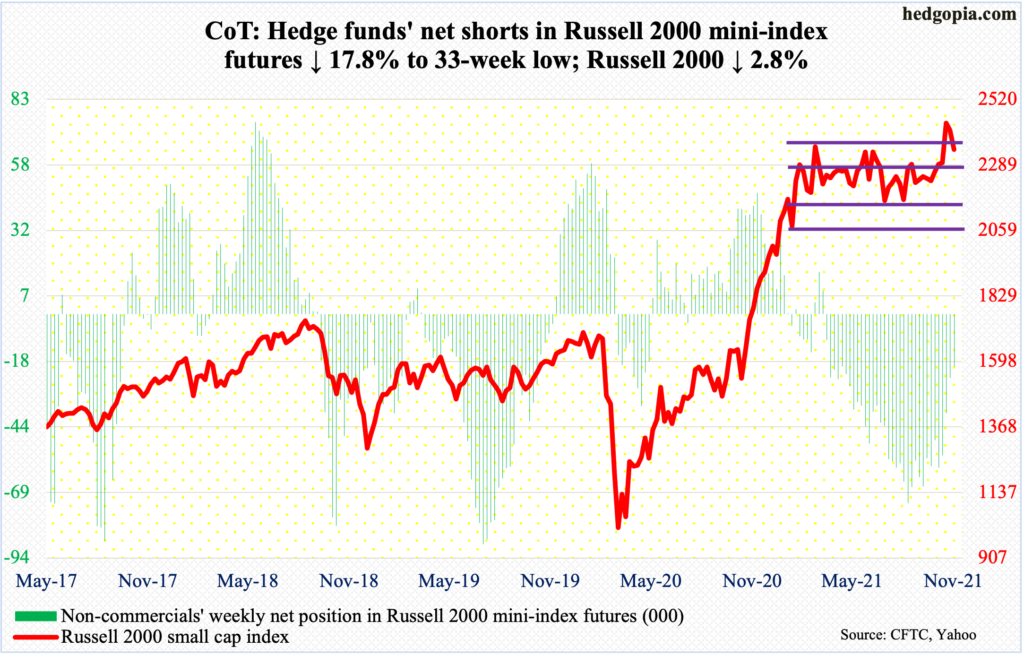
No sooner than the Russell 2000 staged a box breakout than a retest took place. The small cap index (2343) has been rangebound between 2350s and 2080s, and between 2280s and 2150s within this rectangle.
On the 3rd (this month), it decisively broke out of this eight-month consolidation. This preceded a one-year, 144-percent surge through March this year. If it is a genuine breakout, technicians would in due course be eyeing 2600. On the 8th, it touched 2459, before backing off. Short squeeze probably played a role, as non-commercials have actively reduced their bearish positions.
On Friday, the index touched 2342 intraday. This is a place where small-cap bulls and bears will do their best to assert control. Thus far, the retest has failed. If the index continues lower, bulls can still step in and defend 2280s.
US Dollar Index: Currently net long 34.9k, down 540.
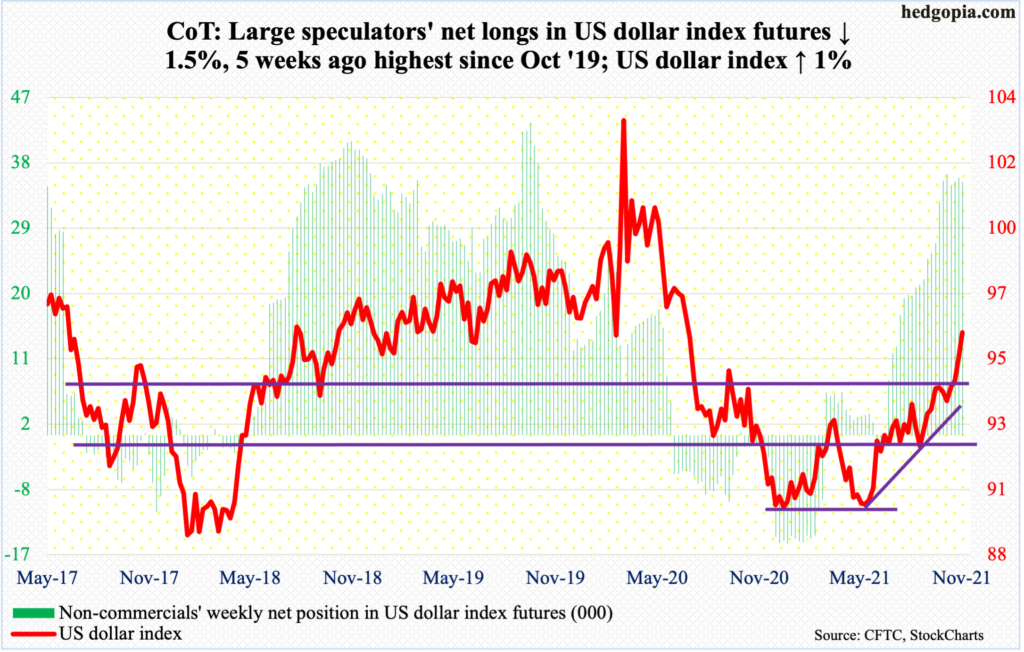
In late October, dollar bulls defended the 50-day, as the US dollar index bottomed at 93.26. Last week, after six weeks of trying, the index broke out of 94.50s. On Wednesday, it touched 96.27.
Conditions are overbought but momentum is intact. Should the index (96.03) proceed to digest its recent gains, bulls can reassert control by defending 94.50s.
VIX: Currently net short 62.5k, down 17.4k.
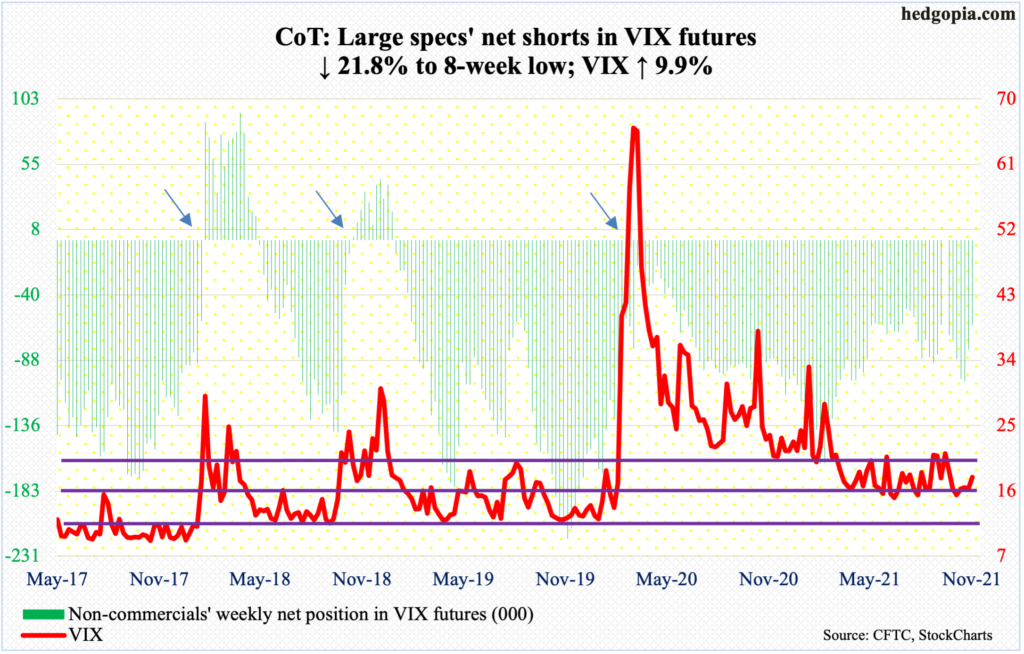
Yet another week in which the S&P 500 rose amid a rise in volatility. VIX (17.91) never lost 16 this week, falling as low as 16.03 on Tuesday and defending the 20-day.
Immediate resistance lies at 18. In fact, Thursday’s high of 18.15 tested this level and was unsuccessful. This occurred again on Friday as VIX rallied as high as 19.01 but failed to keep the gains.
For a while now, the daily RSI has turned back down from 58-59; on Friday, it closed at 53.88. A push past this roadblock will be a major win for volatility bulls.
Thanks for reading!
