
Following futures positions of non-commercials are as of December 14, 2021.
10-year note: Currently net short 273.9k, up 6.9k.
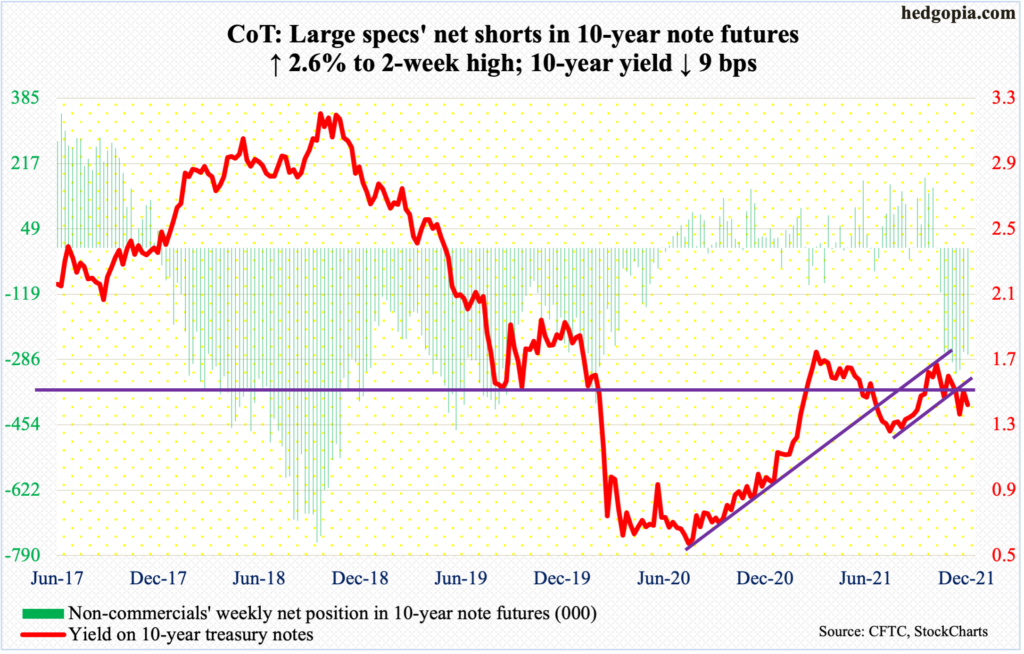
Once again, markets forced the Fed’s hands. Until this week’s FOMC meeting, futures traders were betting that the central bank would end up raising the fed funds rate three times in 25-basis-point increments in the second half next year. The Fed was nowhere near as hawkish.
The Tuesday-Wednesday meeting changed the interest-rate outlook drastically. Not only did the Fed aggressively dial back its bond buying but projected three rate hikes next year. Beginning January, it will reduce the monthly buying to $60 billion. Until recently, it bought $120 billion worth every month. From early March last year, its balance sheet more than doubled to $8.8 trillion, as it focused on its jobs mandate.
Now, it is paying heed to its other mandate – that of price stability – as inflation has been persistently rising for months now.
Once the bond-buying program unwinds in late winter or early spring, the Fed plans to raise interest rates, expecting three hikes next year and two more each in 2023 and 2024.
In the futures market, traders are betting that the first hike takes place as early as May, before hiking two more times by December. The lesson in all this is that the collective wisdom of markets does not get it right all the time but nails it more often than not.
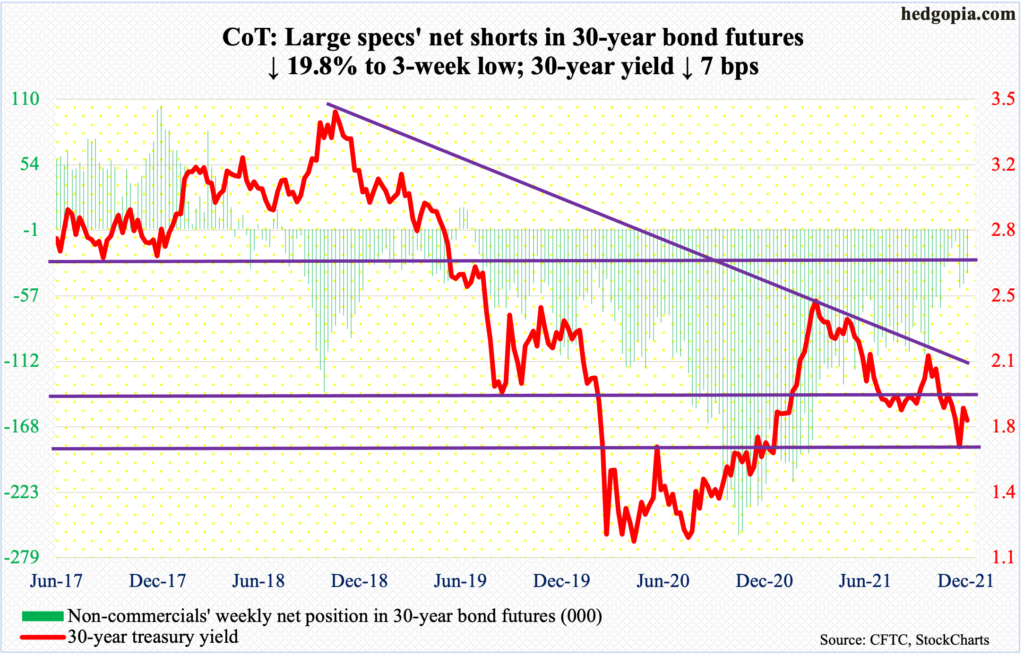
30-year bond: Currently net short 37.3k, down 9.2k.
Major economic releases for next week are as follows.
Wednesday brings GDP (3Q21, final print), corporate profits (3Q21, revised) and existing home sales (November).
The second estimate showed real GDP grew 2.1 percent in 3Q21. This was the slowest growth in five quarters.
Preliminarily in 3Q21, corporate profits grew 4.3 percent quarter-over-quarter to a seasonally adjusted annual rate of $2.94 trillion – a new record.
Sales of existing homes in October edged up 0.8 percent month-over-month to 6.34 million units (SAAR) – a nine-month high.
Personal income/spending (November), durable goods orders (November), new home sales (November) and the University of Michigan consumer sentiment index (December, final) are due out on Thursday.
In the 12 months to October, core PCE (personal consumption expenditures), which is the Fed’s favorite measure of consumer inflation, rose 4.1 percent. This was the steepest price rise since January 1991.
Orders for non-defense capital goods ex-aircraft – proxy for business capex plans – increased 0.6 percent m/m in October to $78.6 billion (SAAR). This was a new record.
October new home sales inched up 0.4 percent m/m to 745,000 units (SAAR) – a six-month high.
December’s preliminary reading showed consumer sentiment increased three points m/m to 70.4. November’s 67.4 was a decade low.
WTI crude oil: Currently net long 378.8k, down 16.4k.
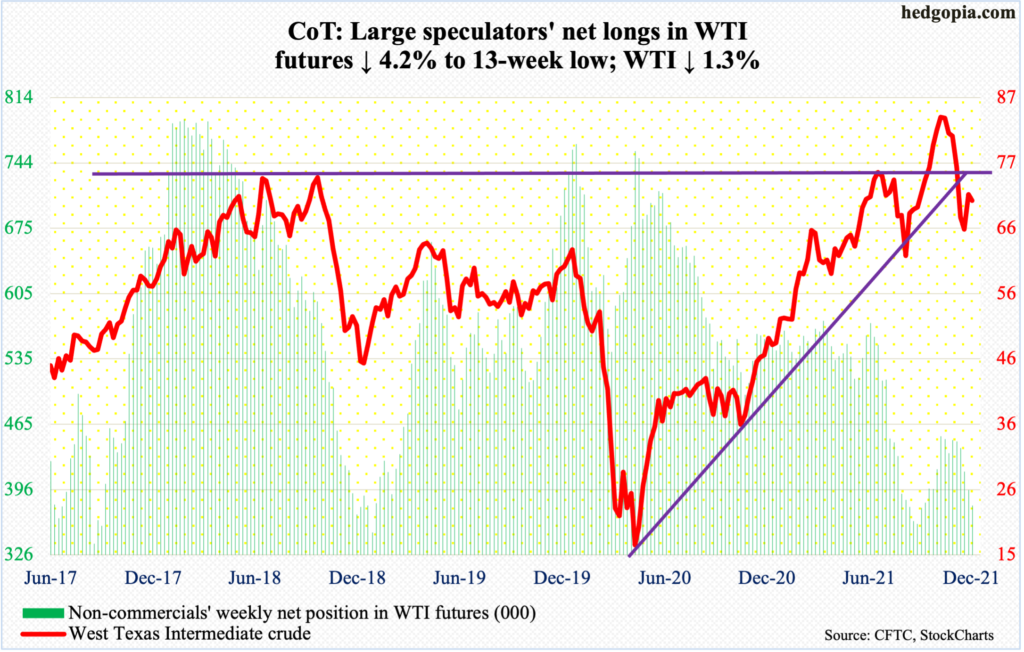
WTI ($70.72/barrel) continued to hug the 200-day essentially all week; the average is flattish at $70.33. Sellers at the same time continued to show up at $$72-$73. Above lies another layer of resistance at $74-$75, and $76-$77 after that.
The daily RSI closed out the week at 43, having turned lower mid-week from just under 50; for the metric to retake the median and continue higher, oil bulls need to generate strong momentum. It is only then the aforementioned resistance on WTI will be tested.
In the meantime, the EIA data for the week to December 10 showed US crude production was flat week-over-week at 11.7 million barrels per day. Crude imports rose 28,000 b/d to 6.5 mb/d. Stocks of crude, gasoline and distillates all fell – down 4.6 million barrels, 719,000 barrels and 2.9 million barrels respectively to 428.3 million barrels, 218.6 million barrels and 123.8 million barrels. Refinery utilization was flat at 89.8 percent.
E-mini S&P 500: Currently net long 167.8k, up 2.4k.
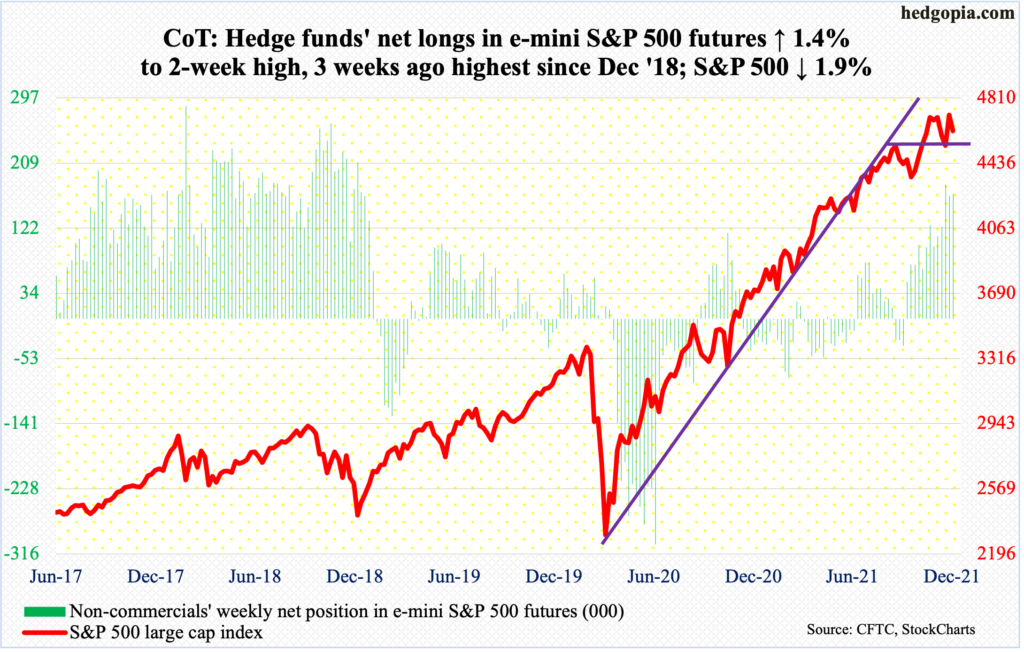
Having closed last week just north of 4700, bulls had an opportunity to break out, but could not pull it off (more on this here). There was a lot of back-and-forth during the week. On Thursday, the S&P 500 rallied as high as 4732 – just eight points shy of the record high 4744 posted on November 22 – but reversed hard to close at 4669, ending the week at 4621. For the week, the large cap index shed 1.9 percent.
There is room for the daily to continue lower. On Friday, the 50-day was tested – successfully – but breach risks are rising. In a holiday-shortened next week (Christmas), bids tend to show up traditionally. But unless a decisive breakout occurs just north of 4700, they will have to work extra hard to recapture momentum.
Funds are beginning to act tentative. In the week to Wednesday, US-based equity funds lost $1.3 billion (courtesy of Lipper). In the same week, SPY (SPDR S&P 500 ETF), VOO (Vanguard S&P 500 ETF) and IVV (iShares Core S&P 500 ETF) took in $2.8 billion (courtesy of ETF.com).
Euro: Currently net short 11.9k, up 3.6k.
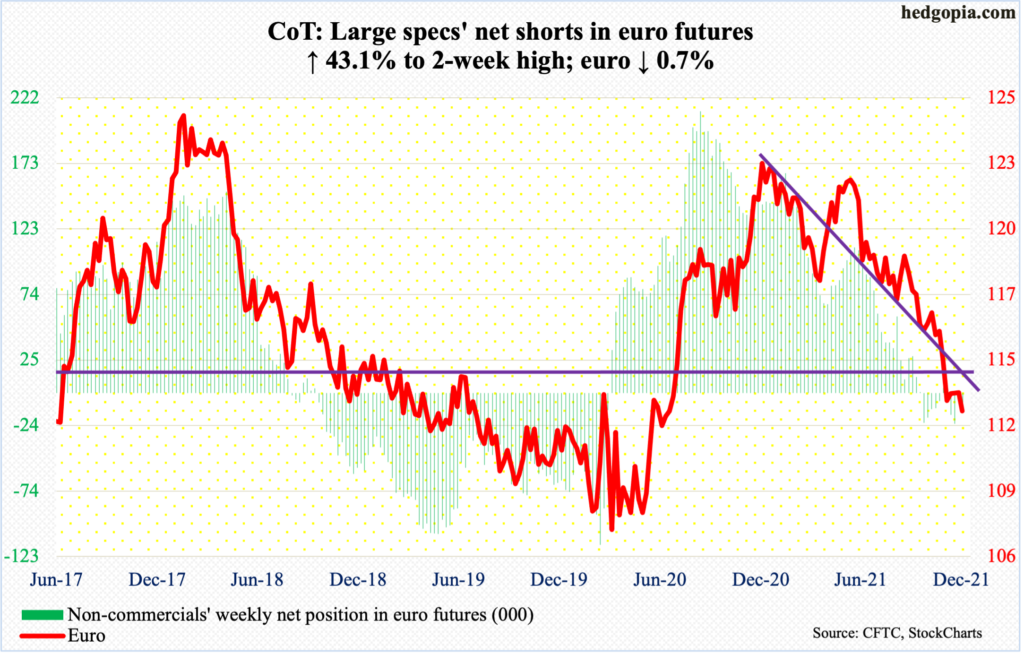
After going sideways for four weeks, the euro ($1.1239) dropped 0.7 percent this week. But it is yet to breach the November 24 low of $1.1187. In a spinning top session on Thursday, it rallied as high as $1.1362. There is resistance at $1.14-$1.15, which goes back at least 18 years.
The daily can come under pressure near term. Last month’s low is worth watching.
Gold: Currently net long 202.4k, down 14.8k.
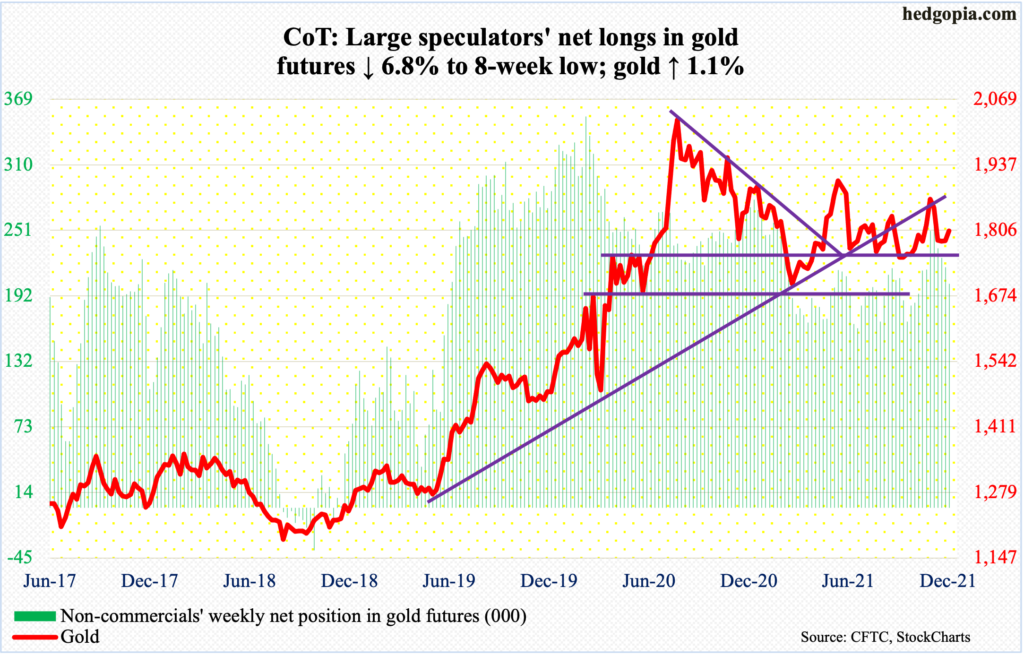
Once again, horizontal support at $1,760s-$1,770s was tested – successfully. On Wednesday, gold ($1,805/ounce) dropped as low as $1,753 to close at $1,765. In the next session, the metal jumped 1.9 percent to close at/just above the 50- and 200-day ($1,798 and $1,794 respectively) and then another 0.4 percent on Friday. Before this week, the yellow metal traded around the averages for three weeks.
Thursday’s powerful rally also helped reclaim a rising trend line from August 9 when gold bottomed at $1,670s. So long as $1,760s-$1,770s remains intact, gold bugs deserve the benefit of the doubt.
Nasdaq 100 index (mini): Currently net long 33.5k, up 7.7k.
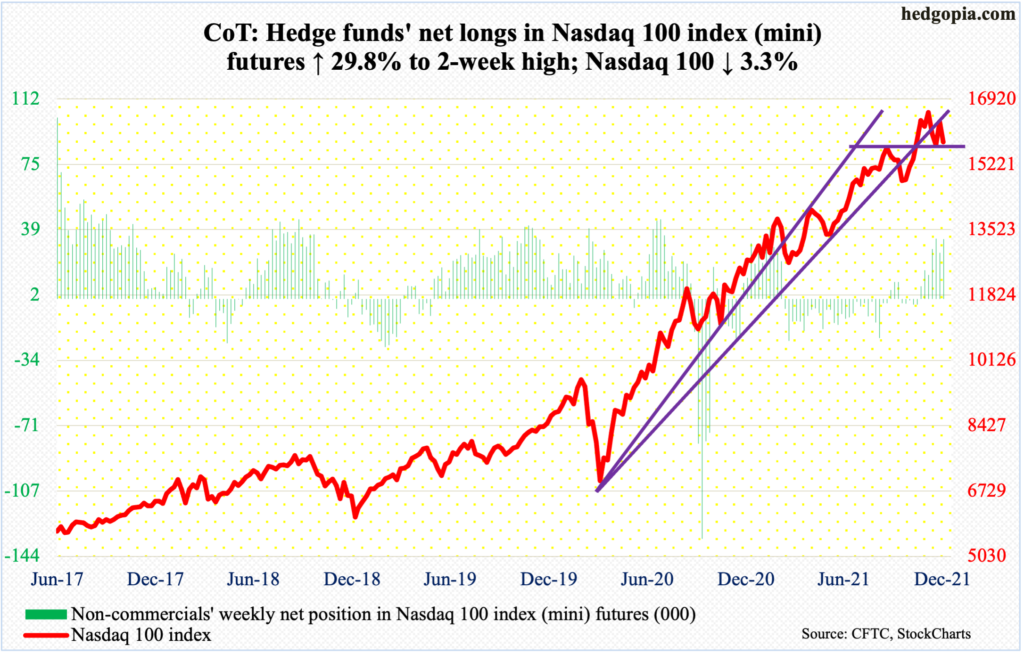
For the week, the Nasdaq 100 declined 3.3 percent. At Thursday’s high of 16341, the tech-heavy index was up 0.1 percent but reversed lower in the opening minutes to end the session down 2.6 percent before closing right at the 50-day. The average (15880) was compromised on Friday, albeit slightly.
If there is any consolation in how the index traded this week, it is that bids showed up at 15700s on Tuesday through Friday. A loss of this support could expose the Nasdaq 100 (15801) to a drop toward 15100s.
Russell 2000 mini-index: Currently net short 27.7k, up 713.
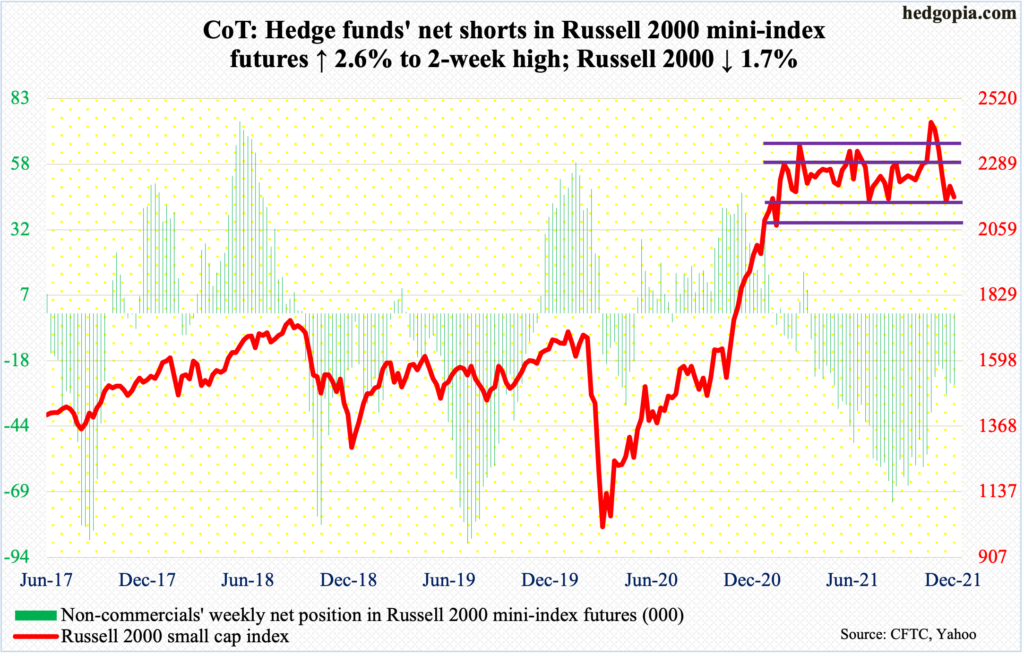
For nine months now, the Russell 2000 has been rangebound between 2350s and 2080s, and between 2280s and 2150s within this rectangle. On Nov 3, the small cap index broke out but was quickly followed by a failed retest on the 19th.
Last week, 2150s was defended. This week, the index rallied as high as 2216 on Thursday but only to reverse sharply lower to end the session down two percent – once again ending at 2150s – and closing out the week at 2174.
So, the saga continues. Buying the dip and selling the rip at/near the bottom and top ranges has worked for months (more on this here). If 2150s is breached in the sessions ahead, it is unlikely 2080s, or 2100, meets with the same fate right at this moment.
US Dollar Index: Currently net long 31.2k, down 3.6k.
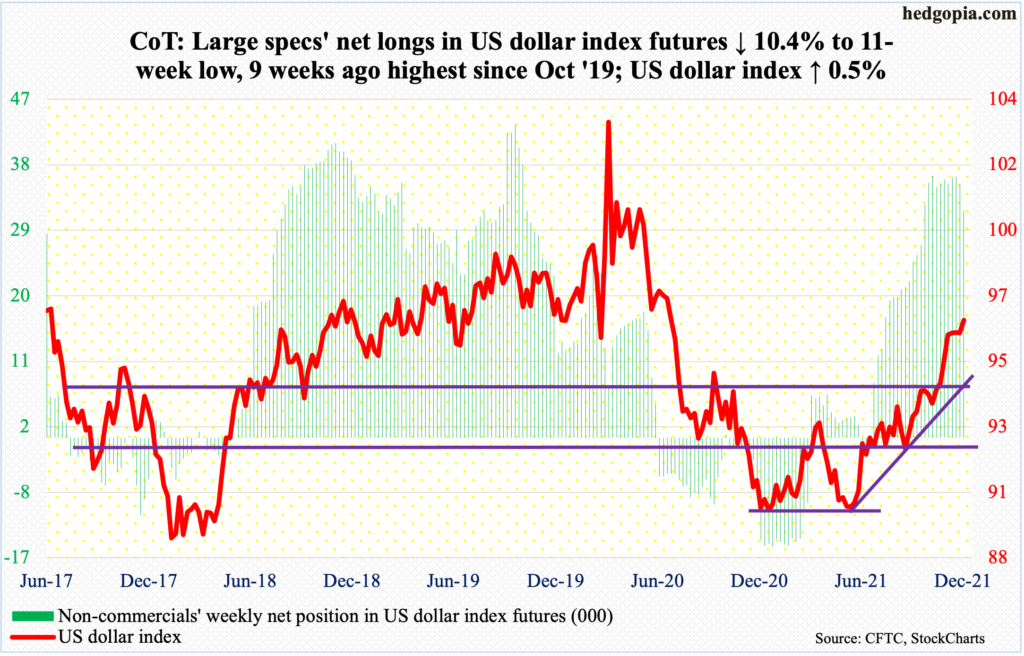
Before this week’s 0.5-percent rally, the US dollar index (96.55) had weekly closes of 96.10, 96.11, 96.10 and 96.03 in the prior four. It is too soon to say the sideways action resolved to the upside this week, as the index remains under the November 24 high of 96.94. Plus, horizontal resistance around 97 goes back at least 18 years.
On Wednesday, last month’s high was just about tested as the index tagged 96.89 before reversing lower. A decisive 97 breakout will be massive.
Else, nearest decent support lies at 94.50s, which is a confluence of multi-year straight line and rising trend line from May.
VIX: Currently net short 45k, down 2.5k.
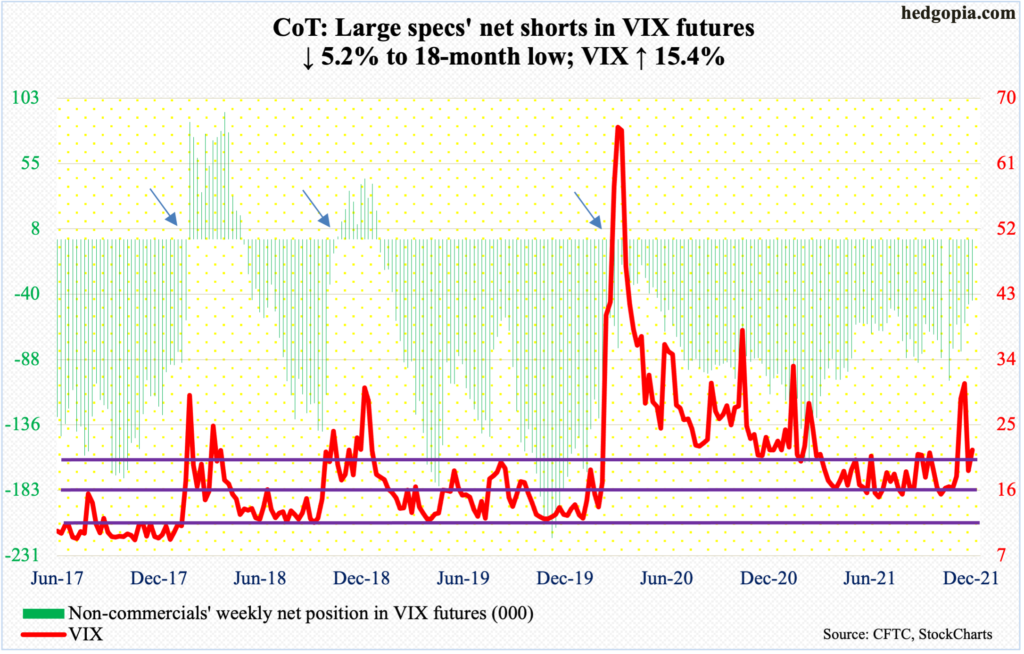
Last week, VIX closed a tad under the 200-day but right at a rising trend line from November 4. This week, the trend line was never lost except on Thursday when a breach occurred intraday but only to close comfortably above it. Thursday’s 6.6-percent rally also ensured both the 50- and 200-day (19.21 and 18.73) were recaptured.
For the week, VIX (21.57) rallied 2.88 points. This followed a spike reversal early this month when the index jumped as high as 35.32 intraday on the 3rd. Volatility has been very volatile of late.
Conditions are oversold on the daily. The daily RSI is right at the median; the metric needs to go above the threshold for upward momentum to pick up.
Non-commercials, in the meantime, have reduced their net shorts from 103k contracts to 45k over the past six weeks. The cash rallied from 16ish to 22ish during the period. If past is prelude, volatility does not peak until these traders either go net long or get close to that.
Thanks for reading!
