
Following futures positions of non-commercials are as of Oct 24, 2017.
10-year note: Currently net long 153.6k, up 47.3k.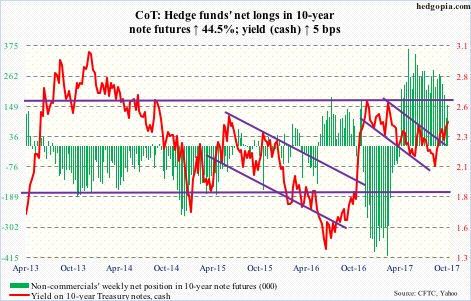
FOMC meets next week. The October 31-November 1 meeting is the seventh this year, with the eighth, and final, scheduled for December 12-13.
The meeting next week does not have a press conference scheduled. Markets do not expect a hike.
December, however, is a lock, with 97-percent odds in the futures market of a 25-basis-point hike. After this, the fed funds rate would have risen to a range of 1.25 percent to 1.5 percent. Currently, it sits at 1.16 percent. Since December 2015, there have been four 25-basis-point hikes, two of them this year.
The dot plot suggests FOMC members would like to move three more times next year. In reality, the tightening pace could differ, as, come next year, the Fed probably looks a whole lot different.
The Federal Reserve Board is made up of seven members, while the FOMC consists of 12 voting members – the seven plus New York Fed president, who always votes, and four of the remaining 11 Reserve Bank presidents, who serve one-year terms on a rotating basis. This year, Chicago, Dallas, Minneapolis, and Philadelphia are the voting four.
Stanley Fischer, vice chair, just resigned. His term would have otherwise ended in June next year. With this, three of the seven seats remain vacant. If we are to go by the rumor mill, Janet Yellen, whose term as chair expires in February next year, is not a favorite to win another term. This in effect means President Trump will have four seats to fill. He already nominated Randal K. Quarles.
In essence, the current dot plot means nothing.
More important for the markets is whether a dove or a hawk gets to lead the Fed. The two probable names bandied about the most are Jerome Powell, current governor, and John Taylor, Stanford economist and Taylor Rule fame. The former is a dove and the latter a hawk. If Mr. Taylor gets the nod, rates can rise a lot faster than currently priced in.
30-year bond: Currently net long 38.7k, down 12.3k.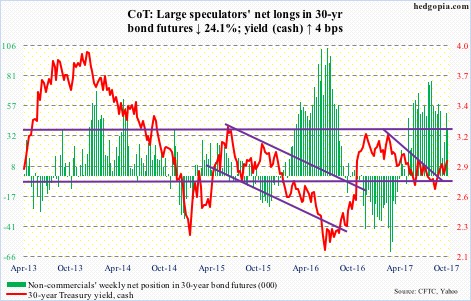
Major economic releases next week are as follows.
Personal income and outlays for September comes out Monday. Core PCE (personal consumption expenditures) – the Fed’s favorite measure of consumer inflation – rose 1.29 percent year-over-year in August, having decelerated from increase of 1.92 percent last October. The last time this metric grew north of two percent was in April 2012.
Besides FOMC meeting, Tuesday also brings the employment cost index (3Q17) and the S&P Corelogic Case-Shiller housing price index (August).
Total comp for private-industry workers rose 2.4 percent over the year in 2Q17. This was the highest growth rate in four quarters.
Nationally, U.S. home prices increased 5.9 percent y/y in July. This was the highest since June 2014 when prices increased 6.3 percent.
October’s ISM manufacturing index is published Wednesday. September activity rose two points month-over-month to 60.8 – the highest since 61.4 in May 2004.
Productivity (3Q17, preliminary) is due out Thursday. Non-farm output per hour rose 1.4 percent y/y in 2Q17. This was the highest growth rate in eight quarters. That is how anemic productivity has been of late.
Friday has employment (October), durable goods (September, revised), and the ISM non-manufacturing index (September) on tap.
Non-farm payroll dropped 33,000 m/m in September. This was the first decline in seven years, and was probably hurricane-related.
Preliminarily, orders for non-defense capital goods ex-aircraft – proxy for business capital expenditures – shot up 7.8 percent y/y in September to a seasonally adjusted annual rate of $65.9 billion. This was primarily because a year ago was suppressed. Orders grew 1.3 percent m/m.
ISM services activity rose 4.5 points m/m to 59.8 – the highest ever. Data goes back to January 2008.
Crude oil: Currently net long 468.8k, up 23.8k.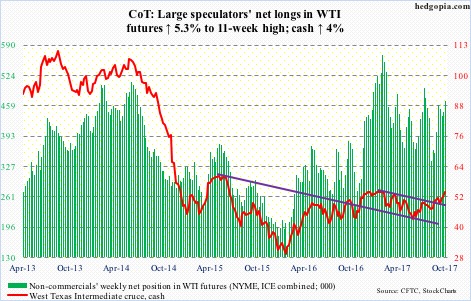
Spot West Texas Intermediate crude ($53.90/barrel) continued to hammer on resistance at $52-$53, and finally succeeded in breaking out on Friday.
For whatever it is worth, a golden cross just developed between 50- and 200-day moving averages – supposedly a bullish development.
The EIA report for the week of October 20 – out Wednesday – was more or less a mixed bag.
Stocks of gasoline and distillates dropped 5.5 million barrels and 5.2 million barrels to 216.9 million barrels and 129.2 million barrels, respectively. The latter was the lowest since May 2015.
Refinery utilization jumped 3.3 percentage points to 87.8 percent.
Crude stocks, however, rose 856,000 barrels to 457.3 million barrels. That said, the prior period was the lowest since January last year.
Crude production rose 1.1 million barrels/day to 9.51 mb/d.
Crude imports increased 640,000 b/d to 8.12 mb/d.
E-mini S&P 500: Currently net long 127.1k, down 34.8k.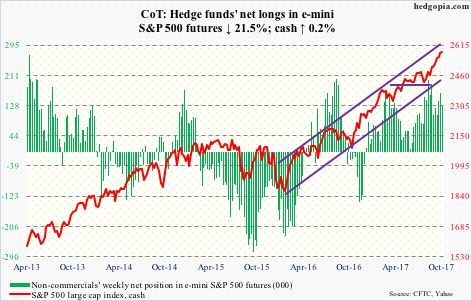
Yet another week in which three S&P 500-focused ETF’s – SPY (SPDR S&P 500 ETF), VOO (Vanguard S&P 500 ETF) and IVV (iShares core S&P 500 ETF) – saw decent inflows. In the week through Wednesday, they together attracted $5.1 billion, following $6.1 billion in the prior week (courtesy of ETF.com).
In the same week, $4.7 billion moved into U.S.-based equity funds, following inflows of $8.3 billion in the prior two (courtesy of Lipper).
Despite these flows, amidst persistent complacent investor sentiment, the S&P 500 (cash) only eked out a 0.2-percent rise for the week, aided by Friday’s 0.8-percent rally to a new all-time high of 2582.98.
The weekly chart produced a dragonfly doji. The cash is at its highs, not at the end of a downtrend. So at best this indicates indecision among traders.
Euro: Currently net long 83.5k, down 6.9k.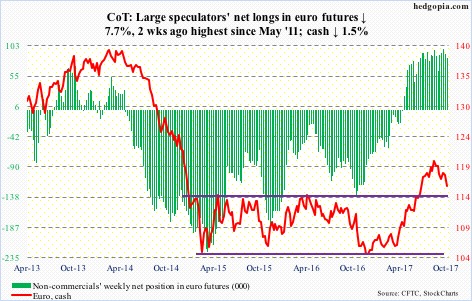
The cash ($116.09) collapsed 1.3 percent Thursday, slightly undercutting support at $116.70. The ECB decided to halve its asset purchase stimulus program to €30 billion/month, for another nine months. However, Mario Draghi, ECB president, refuses to call an end to crisis measures.
On the weekly chart, there is room for the currency to continue lower. There is support at $114.50-ish, which it broke out of in July, and then the 200-day ($112.34).
Gold: Currently net long 191.4k, down 9.3k.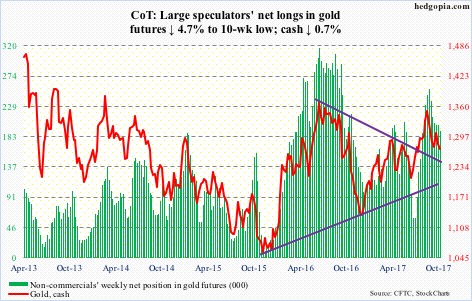
For the 13th consecutive session through Wednesday, GLD (SPDR gold ETF) saw no activity whatsoever. IAU (iShares gold trust), however, in the week ended Wednesday saw inflows of $176 million (courtesy of ETF.com).
The cash ($1,271.80/ounce) continues to face resistance at now-dropping 10- and 20-day, and came very close to testing a rising trend line from last December around $1,255 (dropped to $1,263.8 intraday Friday before rallying off of the lower Bollinger band). The 200-day lies at $1,259.74.
Nasdaq 100 index (mini): Currently net long 35.4k, up 6.5k.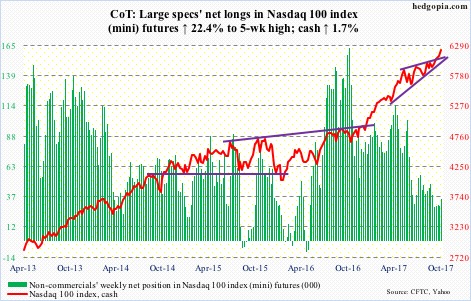
Wednesday, the bulls defended short-term support at 6000. In the week ended that session, QQQ (PowerShares QQQ trust) took in $306 million (courtesy of ETF.com).
This preceded Friday’s 2.9-percent surge in the cash in reaction to 3Q17 results from Alphabet (GOOGL), Amazon (AMZN), Microsoft (MSFT) and Intel (INTC), among others.
The Nasdaq 100 has broken out of a rising wedge. Shorts likely played a role. Short interest on XLK (SPDR technology ETF) remains massive.
Russell 2000 mini-index: Currently net long 15k, down 8.7k.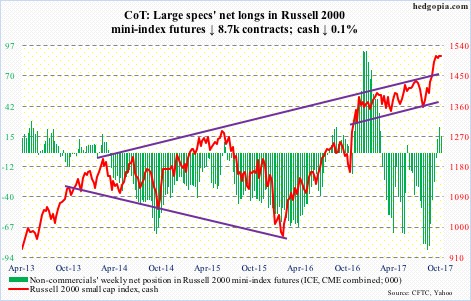
In the week to Wednesday, IWM (iShares Russell 2000 ETF) attracted $629 million, and IJR (iShares core S&P small-cap ETF) $59 million (courtesy of ETF.com).
The Russell 2000 (cash), however, continues to show signs of fatigue. The index (1508.32) peaked at a new all-time high of 1514.94 on the 5th this month, and has essentially been flat for the past four weeks.
Daily Bollinger bands have tightened quite a bit. A sharp move is likely in the making.
US Dollar Index: Currently net short 4.2k, down 506.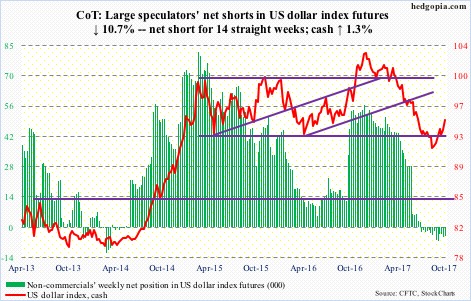
The euro makes up 57.6 percent of the US dollar index. The latter rallied one percent Thursday, apparently helped by the former’s decline in that session. In doing so, it broke out of short-term resistance at 94. All this without much help from non commercials, who tend to be trend followers.
There is also an inverse head-and-shoulders in play, a completion of which measures to 97 on the cash (94.82). The 200-day lies at 96.88.
VIX: Currently net short 148.7k, down 19.8k.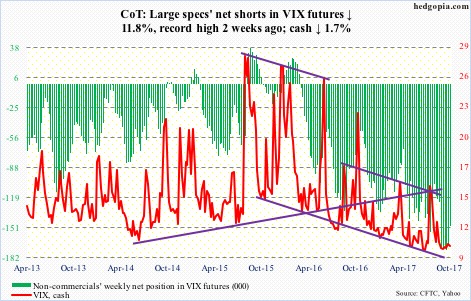
Same old, same old. Wednesday’s 18.3-percent intraday rally on the cash was slammed hard, in the end closing up only 0.6 percent. Then came Friday’s 13.3-percent drop to 9.80 – first sub-10 close this week and sixth straight weekly sub-10 close – losing 10-, 20-, 50- and 200-day at one go.
In ideal circumstances, there is plenty of room for volatility to rise on the weekly chart. For volatility bulls, the current environment has been anything but ideal.
The CBOE equity put-to-call ratio was .55 Friday.
Thanks for reading!
