
Following futures positions of non-commercials are as of February 8, 2022.
10-year note: Currently net short 201.9k, down 73k.
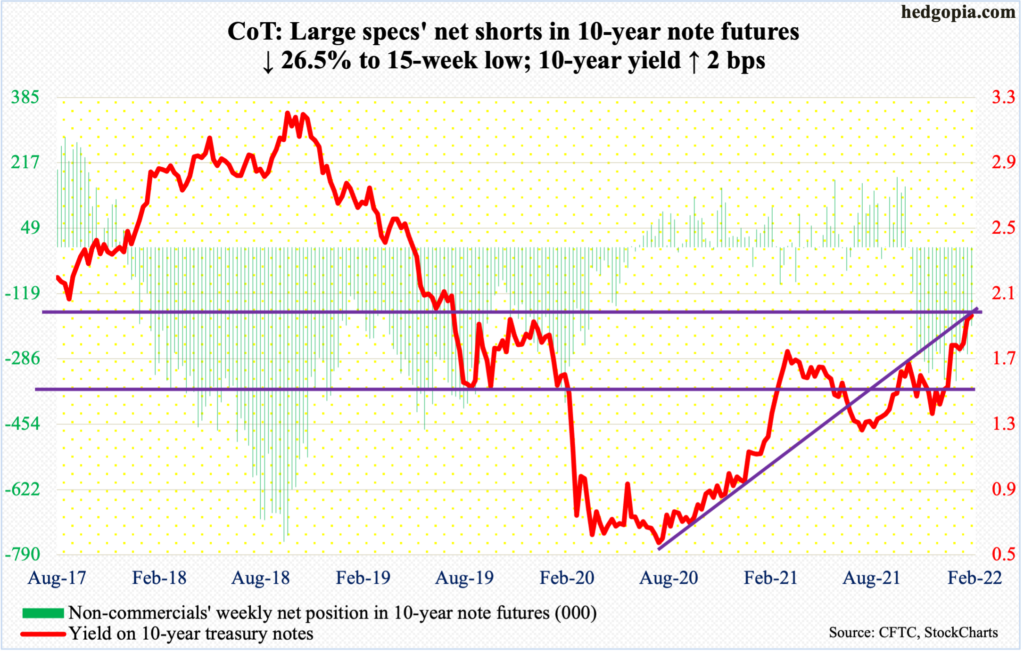
The minutes for the January 25-26 meeting are scheduled for next Wednesday. This was the year’s first FOMC meeting, during which Jerome Powell, Fed chair, strongly hinted that a hike was imminent in the March (15-16) meeting.
Over the little more than two weeks since the last meeting, inflation data continued to come in stronger. January’s CPI was published Thursday, and consumer prices shot up 7.5 percent year-over-year; this was the steepest price rise in the last four decades.
After the CPI report, the odds of a 50-basis-point hike next month shot up to 94 percent in the futures market. Now that the markets are expecting it, the Fed may very well oblige. But there will be no shock and awe, which is what the central bank needs at this point.
In March 2020, as Covid-19 began to wreak havoc, the Fed lowered the fed funds rate by 150 basis points in two unscheduled meetings – on the 3rd and 15th – to the current range of zero to 25 basis points. This was a time to act with speed and the Fed deserves kudos for that.
Fast forward to now, it is now clear the Fed overstayed its welcome. Inflation is rampant, and wage increases are being built into long-term contracts. Employees are demanding it, and employers are obliging. To break this vicious cycle, a drastic shift in policy is needed – a shock and awe, so to speak – (more on this here).
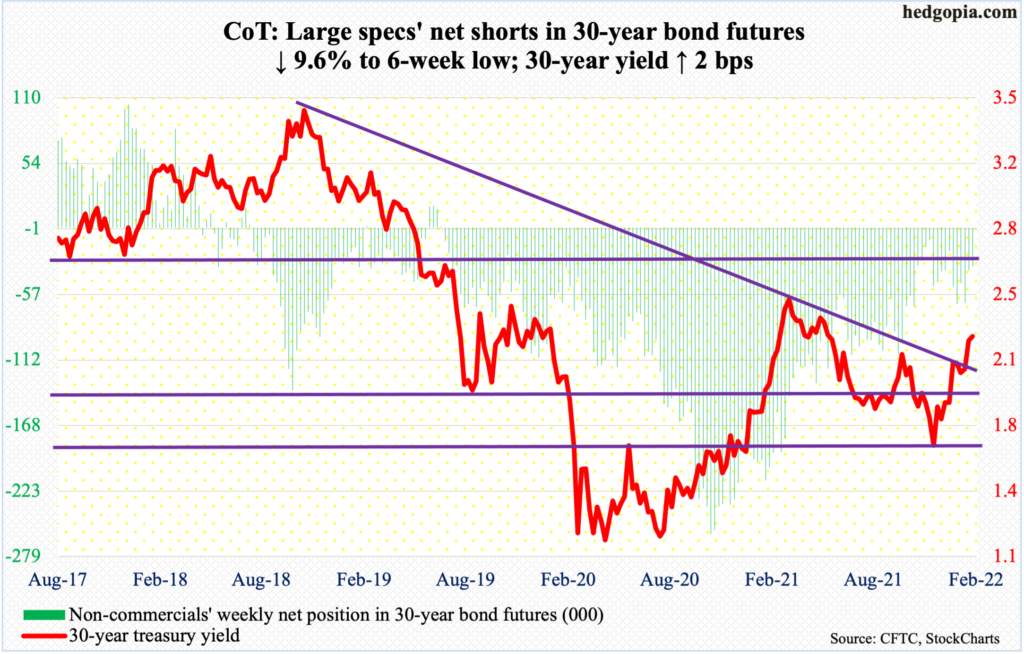
30-year bond: Currently net short 33k, down 3.5k.
Major economic releases for next week are as follows.
The producer price index (January) and Treasury International Capital data (December) come out on Tuesday.
In December, headline and core PPI rose 0.2 percent and 0.4 percent month-over-month. On a 12-month basis, they respectively increased 9.7 percent and 6.9 percent.
In the 12 months to November, foreigners purchased $94.9 billion in US equities. This is substantially lower than last March’s record $405.5 billion.
On Wednesday, retail sales (January), industrial production (January) and the NAHB housing market index (February) are on dock.
Retail sales declined 1.9 percent m/m in December to a seasonally adjusted annual rate of $626.8 billion. November’s $639.1 billion was a new record.
Capacity utilization in December edged lower 0.2 percent m/m to 76.5 percent. November’s 76.6 percent was a two-year high.
Homebuilder optimism fell a point m/m in January to 83. The index hit a fresh high 90 in November 2020, which is three times the post-pandemic low of 30 posted in April that year.
Thursday brings housing starts (January). Starts increased 1.4 percent m/m in December to 1.7 million units (SAAR) – a nine-month high.
Existing home sales (January) are scheduled for Friday. December sales were down 4.6 percent m/m to 6.18 million units (SAAR) – a four-month low.
WTI crude oil: Currently net long 365.7k, down 1.9k.
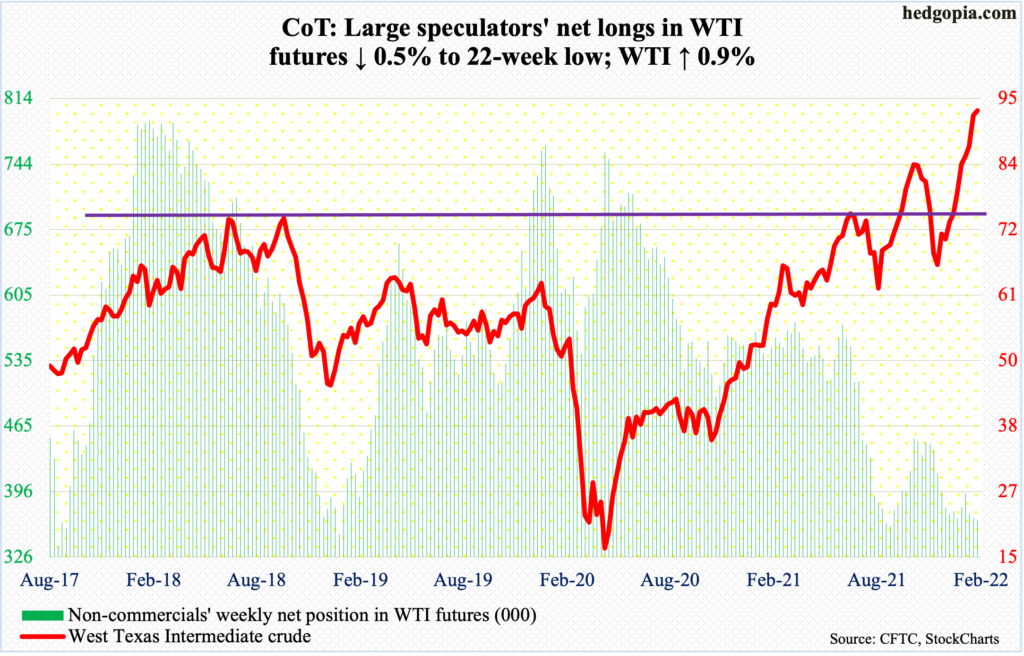
As recently as December 2, WTI ($93.10/barrel) bottomed at $62.43. This Friday, it ticked $94.66 before weakening a tag. It has obviously come a long way in a couple of months and remains extremely overbought, with the weekly RSI at 71.9. In at least going back to last March, each time this metric reached 70s, the crude came under pressure sooner or later. In the event of downward pressure, there is support at $85, which WTI broke out of late January.
In the meantime, stocks of crude, gasoline and distillates all fell in the week to February 4. They were respectively down 4.8 million barrels, 1.6 million barrels and 930,000 barrels to 410.4 million barrels, 248.4 million barrels and 121.8 million barrels. As did crude imports, which were down 696,000 barrels/day to 6.4 million b/d. Crude production, on the other hand, rose 100,000 b/d to 11.6 mb/d. Refinery utilization increased 1.5 percentage points to 88.2 percent.
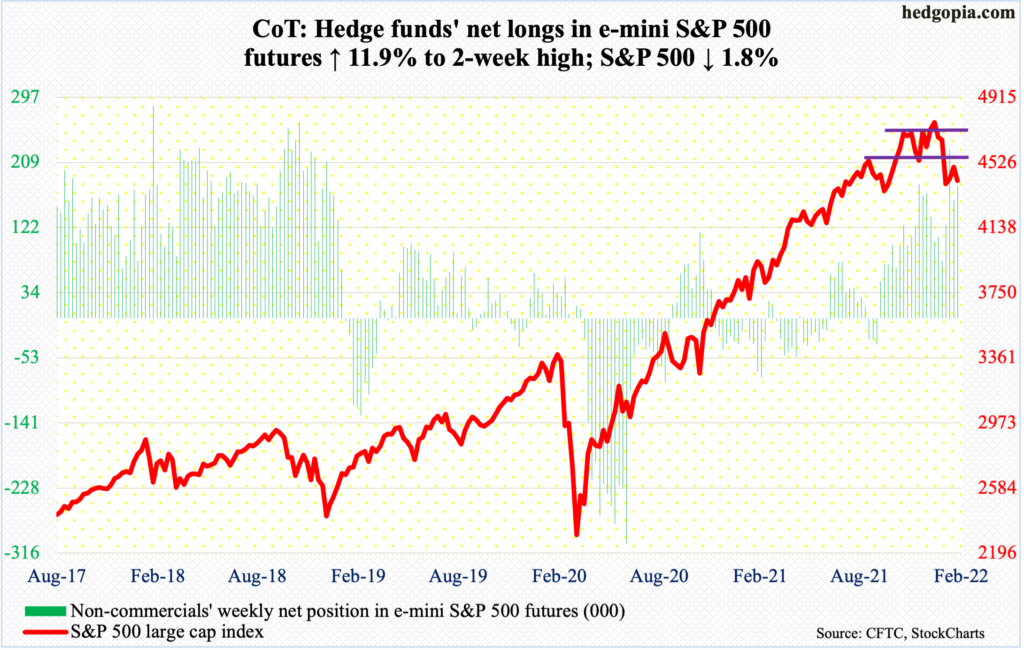
E-mini S&P 500: Currently net long 177.6k, up 18.8k.
In the week to Wednesday, US-based equity funds took in $15.9 billion, which more than offset withdrawals of $11.7 billion in the prior three weeks (courtesy of Lipper). SPY (SPDR S&P 500 ETF), VOO (Vanguard S&P 500 ETF) and IVV (iShares Core S&P 500 ETF) in the week to Wednesday attracted $15.8 billion, which was precisely the amount lost in the prior four weeks (courtesy of ETF.com).
By Wednesday, equity bulls rallied the S&P 500 to close at 4587. Come Thursday, this level was tested again as the session tagged 4589 but only to then close down 1.8 percent. The large cap index lost another 1.9 percent on Friday. In the end, the week closed from up two percent at one time to down 1.8 percent.
On the 2nd (this month), too, the S&P 500 rallied to 4589 before weakening. This level has attracted sellers in droves and there is a reason for that.
The index peaked on January 4 at 4819 and bottomed on the 24th at 4223. A 61.8-percent Fibonacci retracement of this decline lies at 4591 (more on this here). This is a closely watched level by the technically oriented ones. Besides, the 50-day at 4609 lies in the vicinity.
The daily is extended. The path of least resistance is down. Our own Hedgopia Risk Reward Index (chart on home page) is in the red zone and is looking to head lower.
Euro: Currently net long 38.8k, up 9.1k.
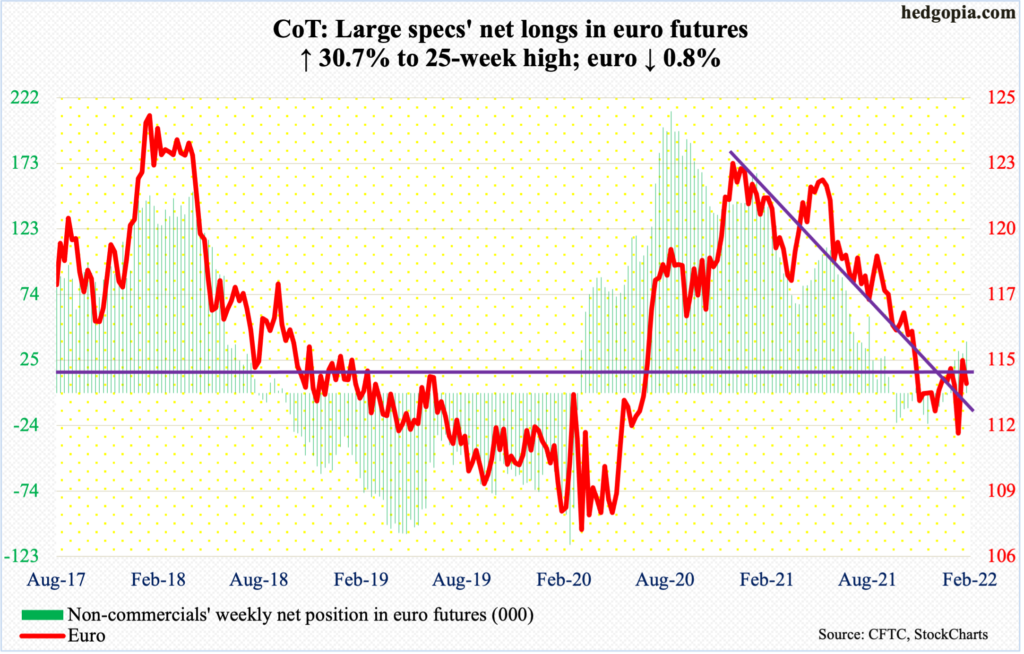
Euro bulls once again went after it on Thursday. Resistance at $1.14-$1.15 goes back at least 18 years and drew sellers mid-January and again this month. After hitting $1.1469 on the 4th, the euro ($1.1353) rallied as high as $1.1495 on Thursday but only to end the session flat at $1.1429 with a spinning top. Selling continued on Friday.
In the event of downward pressure – likely in the sessions ahead – there is trend-line support from last November at $1.1350s, which is exactly where it ended the week. The 50-day lies underneath at $1.1325.
Gold: Currently net long 186.7k, up 14.6k.
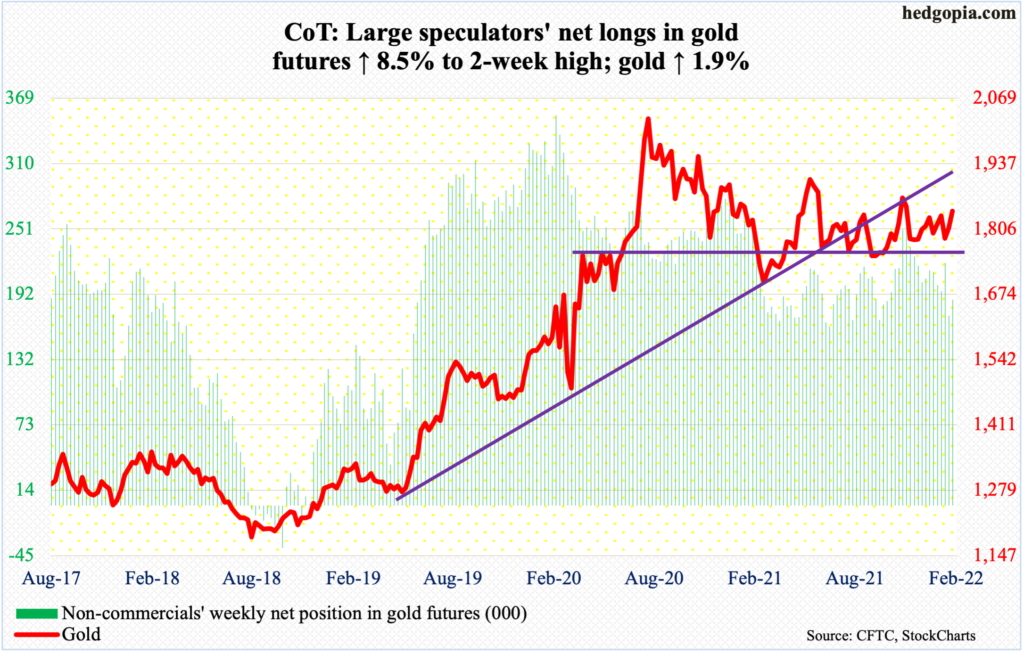
After attracting a combined $2.4 billion in the prior three weeks, GLD (SPDR Gold Shares) in the week to Wednesday experienced outflows of $14 million; IAU (iShares Gold Trust), on the other hand, took in $144 million – its first inflows in five weeks (courtesy of ETF.com).
For the week, gold ($1,842/ounce) rallied 1.9 percent and was up as much as 3.3 percent at Friday’s intraday high of $1,867.
For over a year now, $1,830s has proven to be a price point of interest for both bulls and bears. For a month now, gold bugs tried several times to reclaim this, but unsuccessfully. The level was reclaimed Friday, although gold bugs were unable to hang on to all of the session’s gains. That said, right here and now, momentum remains up.
Nasdaq 100 index (mini): Currently net long 8k, up 9k.
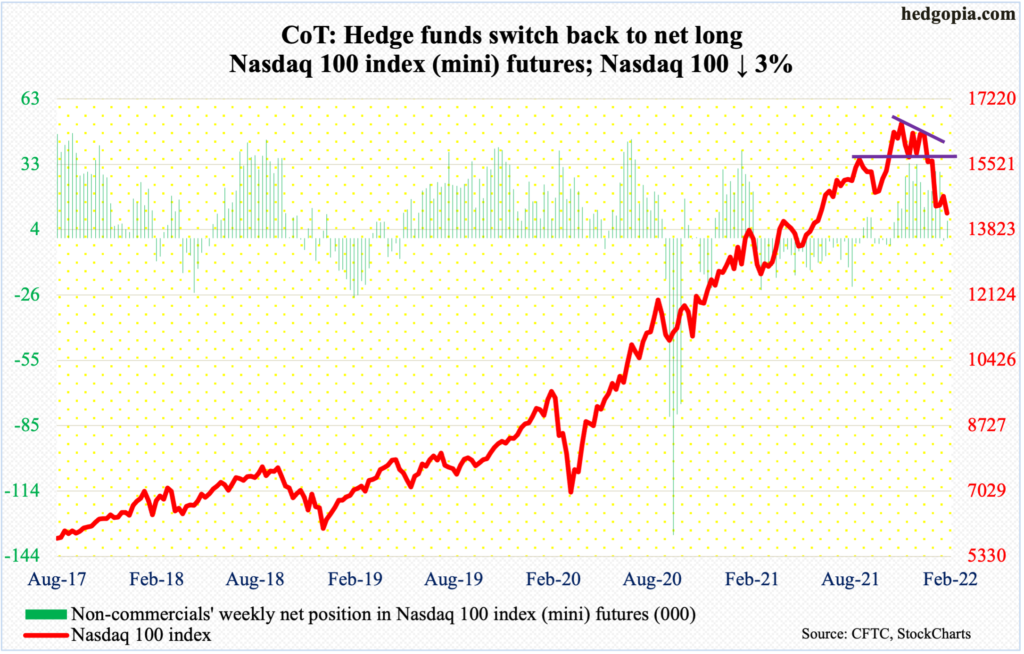
Between the November 22 (last year) high and the January 24 low, the Nasdaq 100 collapsed 18.1 percent, worse than the S&P 500’s 12.4 percent drop between last month’s high and low. On the 2nd (this month), the Nasdaq 100 retraced just short of 50 percent of this decline.
This week, the tech-heavy index (14254) tried to rally again, tagging 15058 on Wednesday and 15037 on Thursday, but the 200-day (15054) came in the way, with Thursday in particular reversing lower to end the session down 2.3 percent, followed by Friday’s 3.1 percent collapse.
Tech in general has been a relative underperformer and there is no reason why this should change, given the interest-rate outlook. Bulls in the right circumstances had the opportunity to squeeze shorts as short interest on the Nasdaq rose to a fresh high at the end of January (chart here) but have their backs against the wall.
As things stand, the January 24 hammer low of 13725 has gained in significance.
Russell 2000 mini-index: Currently net short 37.7k, up 1.6k.
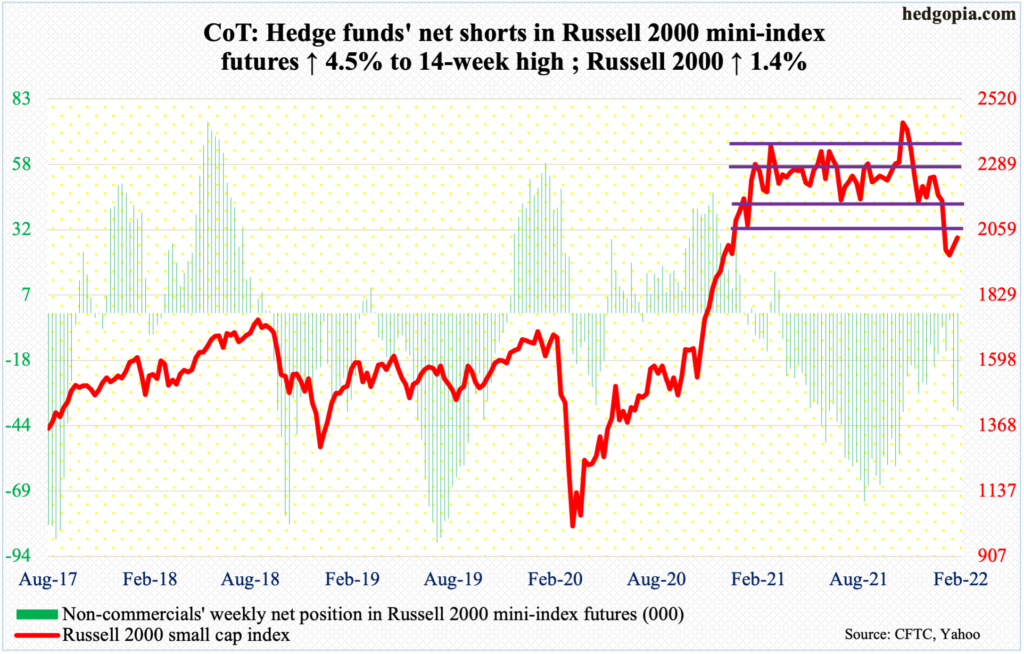
Since last March, the Russell 2000 (2030) had been rangebound between 2350s and 2080s, and between 2280s and 2150s within this box. On Nov 3, it broke out but was quickly followed by a failed retest on the 19th. On January 19, it broke down, dropping out of the rectangle. The subsequent decline took the small-cap index all the way down to 1901, which was ticked on the 28th.
The index then enjoyed a quick 10.7 percent rally through Thursday’s intraday high of 2105. This was preceded by a 22.7 percent tumble between the November 2021 record high of 2459 and the January 28 low. A 38.2-percent Fibonacci retracement of this mini-crash lies at 2114, which was just about where offers overwhelmed bids on Thursday. This was also a backtest of the broken range, and it was vehemently rejected.
The daily has now been pushed into overbought territory. At this point, a test of 1900, which drew bids both this January and last, looks imminent. It is a must-save.
US Dollar Index: Currently net long 33.8k, down 806.
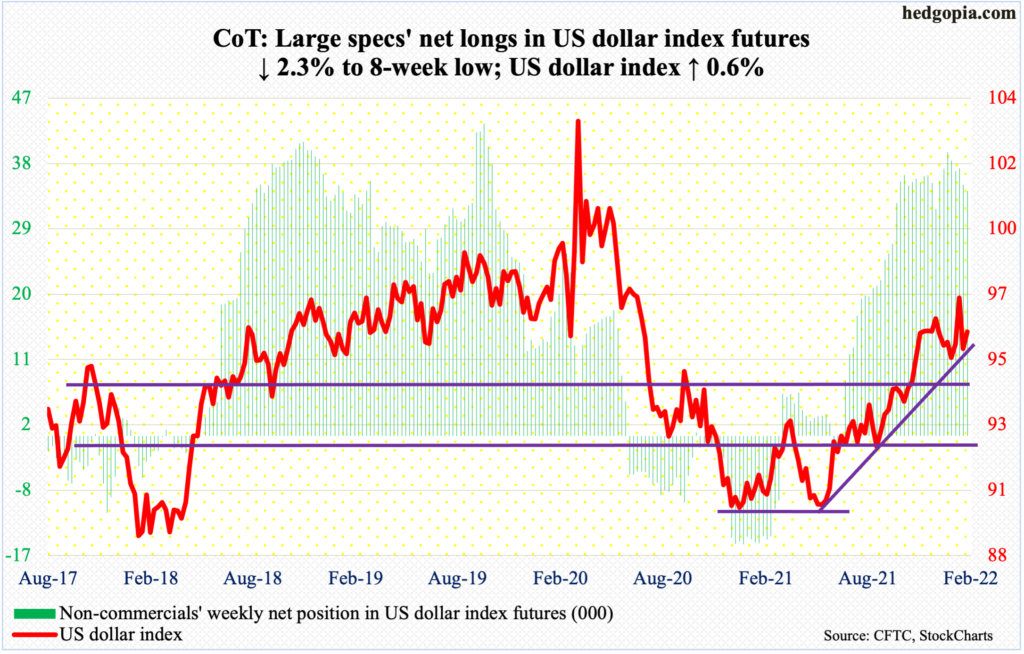
Last week, a rising trend line from last May was breached, albeit ever so slightly. This week, the trend line was reclaimed, although not by a whole lot. The US dollar index (96.07) also edged past the 50-day.
There is room to rally on the daily. As long as horizontal support at 94.50s, which was defended mid-January, is not breached, dollar bulls deserve the benefit of the doubt.
VIX: Currently net short 35.1k, up 8.4k.
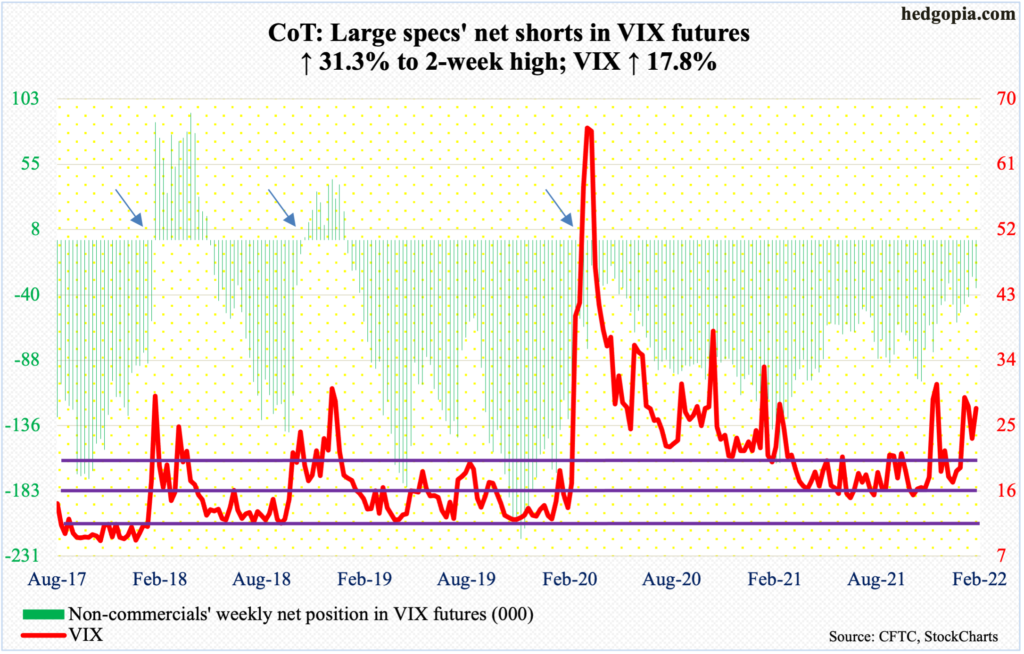
On Wednesday, VIX posted an intraday low of 19.33 and closed the session near that low, losing in the process a rising trend line from January 4 when the S&P 500 peaked; the breach did not last as in the very next session the volatility index jumped 3.95 points to 23.91. This was followed by a 3.45-point jump on Friday.
VIX is above both the 50- and 200-day and is itching to rally, although volatility bulls were unable to save Friday’s high of 30.99, closing at 27.36. It is too soon to declare this as a spike reversal but how VIX acts in the next few sessions is worth watching.
Thanks for reading!
