Following futures positions of non-commercials are as of June 21, 2022.
10-year note: Currently net short 228.2k, up 22.7k.
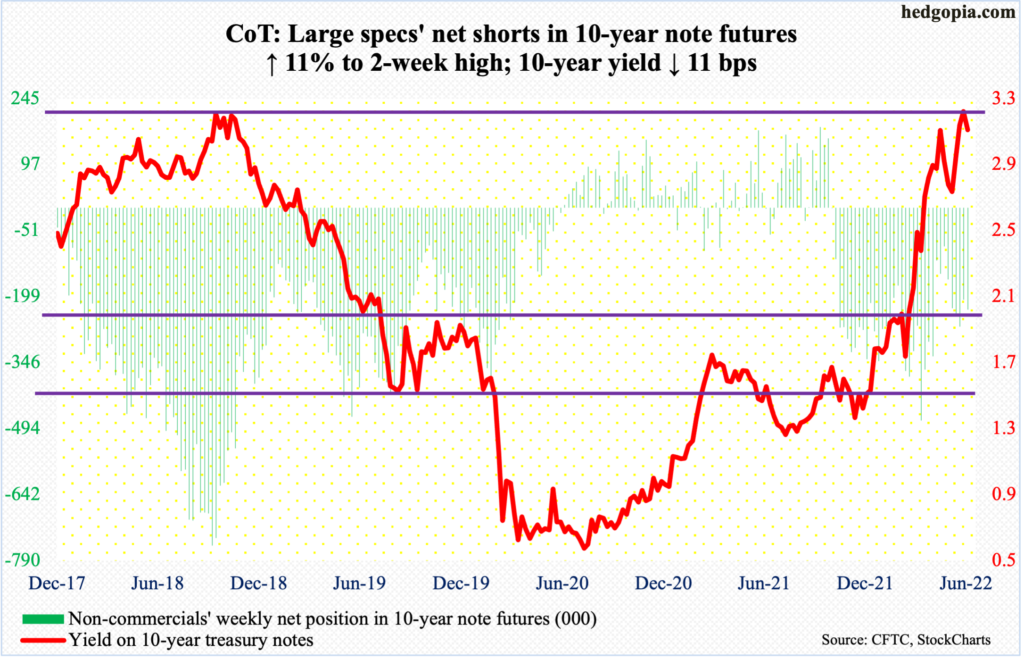
Jerome Powell this week testified on monetary policy in front of Congress. Just last week, after raising the fed funds rate by 75 basis points to a range of 150 basis points to 175 basis points, he spoke to the press, so there was not a whole lot of new this week. He did, however, say a recession was “certainly possible,” but not in the near term. This was as clear an admission as possible by a Federal Reserve chief that a soft-landing would be “very challenging.”
Indeed, markets have increasingly been pricing in a contraction. The 10-year treasury yield acts as if it has peaked. On the 14th, it ticked 3.48 percent, up from 1.49 percent at the end of 2021 and 1.13 percent last July/August. In a sign that rates are exhausted going up, last week formed a weekly shooting star; this week, they were down 11 basis points.
Concurrently, cyclical stocks are taking a beating. XLY (Consumer Discretionary SPDR Fund) lost 38 percent from last November’s high through last week’s low. Energy was holding up better, but it too fell 24.7 percent from the June 8th high; the sector is rapidly repricing itself. Defensives, on the other hand, are in demand, with XLU (Utilities SPDR Fund) down 11.5 percent between the April 8th high and last Friday’s low.
What Powell and his team are probably hoping for is a positive feedback loop from this regarding inflation. It is very possible that as recession talks grow, inflation expectations head lower, which then gets reflected in inflation.
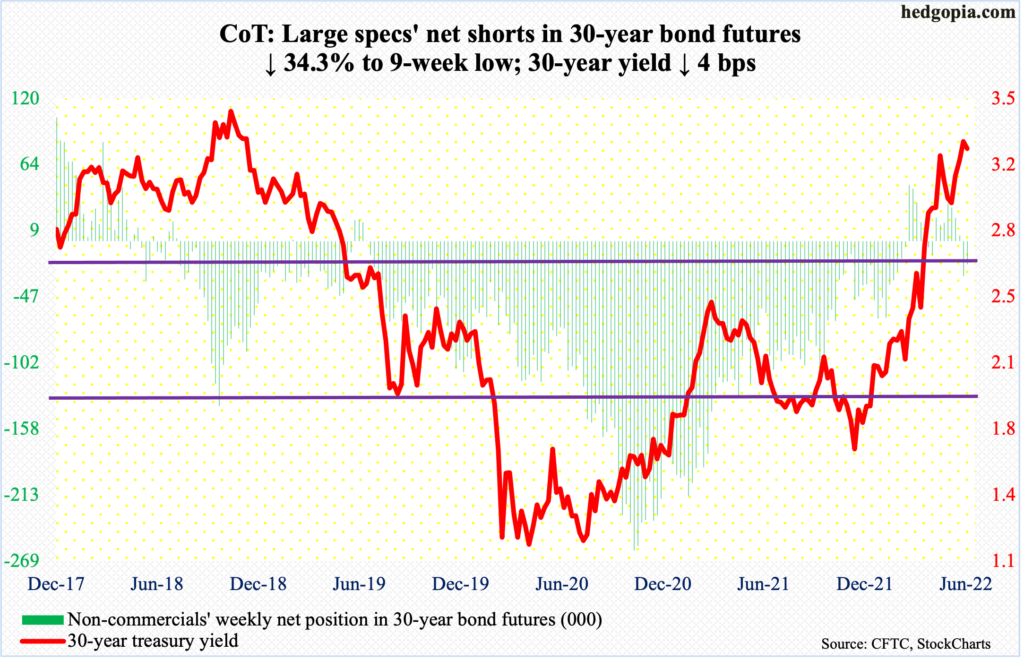
30-year bond: Currently net short 19.3k, down 10.1k.
Major economic releases for next week are as follows.
Durable goods orders (May) are on tap for Monday. In April, orders for non-defense capital goods ex-aircraft – proxy for business capex plans – grew 0.4 percent month-over-month to a seasonally adjusted annual rate of $73.2 billion, which is a new high.
The S&P Case-Shiller home price index (April) will be out on Tuesday. Nationally, US home prices in March jumped 20.6 percent year-over-year. This was the fastest pace of price appreciation in the series’ history going back to January 1975.
Wednesday brings GDP (1Q22, final). The second estimate showed real GDP shrank 1.5 percent last quarter, which was the first contraction in seven quarters.
Personal income/spending (May) is scheduled for Thursday. In the 12 months to April, headline and core PCE (personal consumption expenditures) increased 6.3 percent and 4.9 percent respectively.
On Friday, the ISM manufacturing index (June) is on dock. Manufacturing activity in May increased 0.7 percentage points m/m to 56.1 percent.
WTI crude oil: Currently net long 281.6k, down 32.2k.
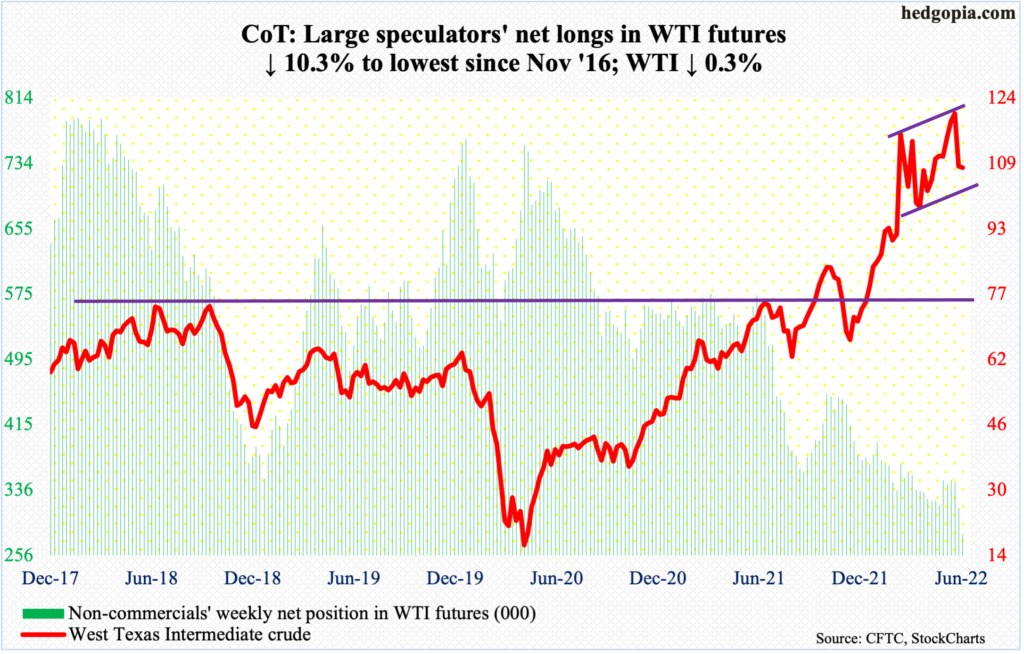
West Texas Intermediate crude ($107.62/barrel) has found itself trapped in an ascending channel since April. Intra-week, the lower support gave way this week, as it tagged $101.53 at Wednesday’s low. But by the end of the week, oil bulls rallied the crude to close at $107.62, only down 0.3 percent for the week. This followed last week’s 10.5-percent drubbing.
The crude has come under pressure since tagging $123.68 intraday on the 14th, which represents a lower high versus $130.50 posted on March 7. Immediately ahead, bulls likely will try to build on this week’s action by reclaiming the 50-day moving average at $109.74.
E-mini S&P 500: Currently net short 114.3k, up 148.6k.
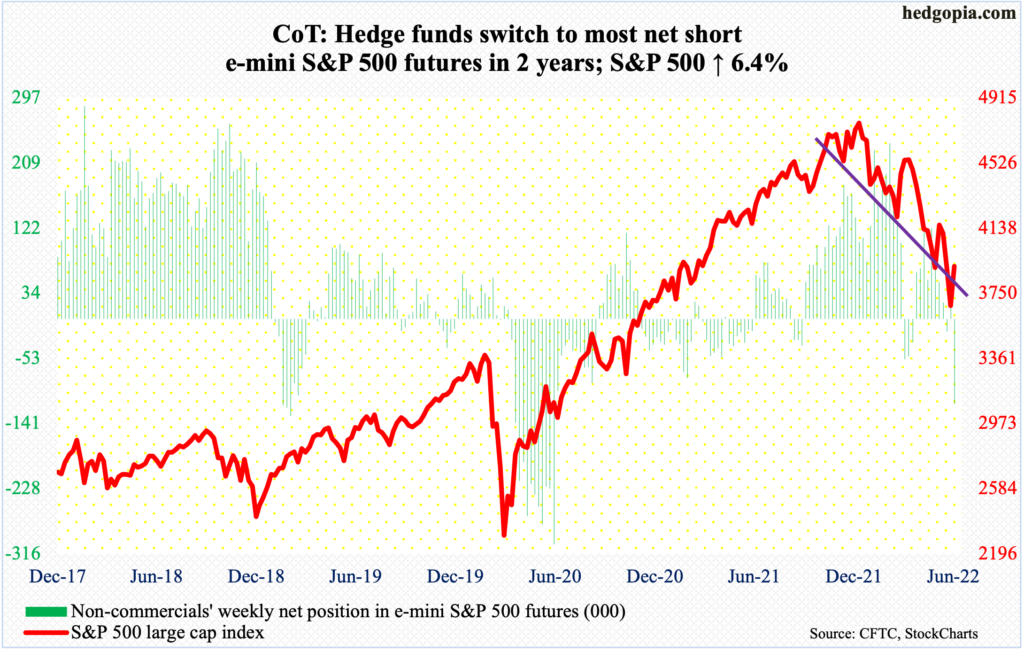
After two daily spinning tops last week and a 24.5-percent plunge between the January 4th high 4819 and last Friday’s low 3637, bulls put their foot down this week. Last week’s slight breach of a descending channel from January proved temporary. With the help of a 6.4-percent rally, the S&P 500 pushed back into the channel. This was the first up week in four and second in 12.
Most recently, the large cap index rolled over on the 8th, a couple of sessions before the red-hot inflation report for May was published. On the way down, there were two gap-downs, one of which was filled by Friday’s gap-up marubozu; the second gets filled just north of 4000. The index closed out the week at 3912.
In the meantime, non-commercials are now the most net short in two years. In the right circumstances, this could end up helping the longs through short squeeze.
Euro: Currently net short 15.6k, up 9.6k.
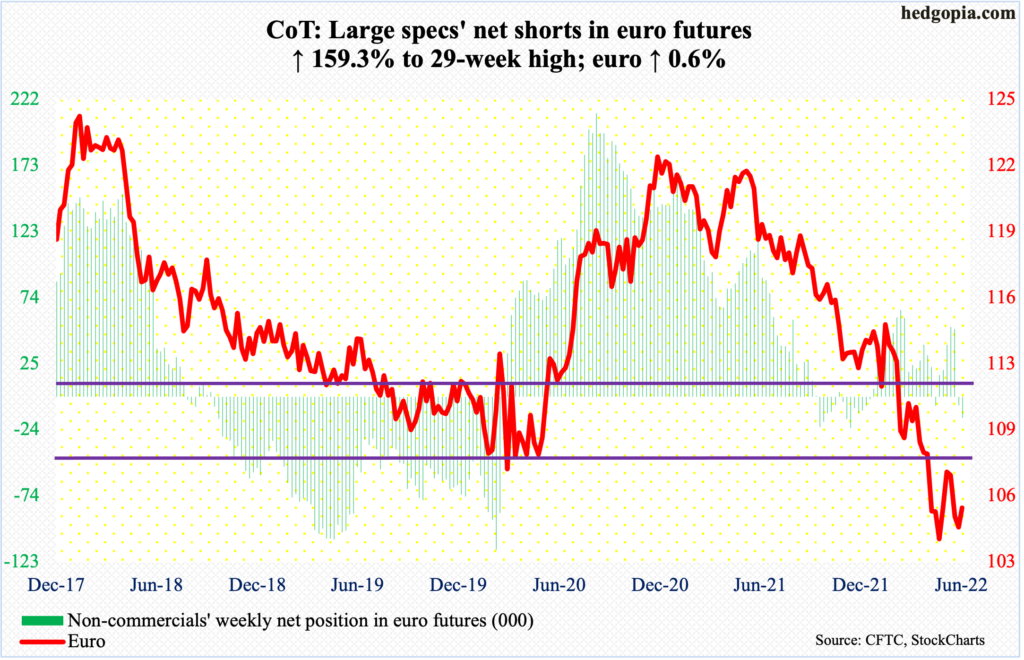
The euro faced resistance where it could possibly have. It rose as high as $1.0606 intraday Wednesday but only to meet with minor selling. The 50-day at $1.0613 lies around there. Plus, there was straight-line resistance at $1.0570s, followed by $1.0750s.
For the week, the currency ($1.0561) rose 0.6 percent. This week’s action preceded last Wednesday’s low of $1.0358 matching the May 13 low of $1.0350, which was a successful retest of the January 2017 low of $1.0341.
For now, a takeout of $1.0570s opens the door toward $1.0750s.
Gold: Currently net long 163.3k, up 8.7k.
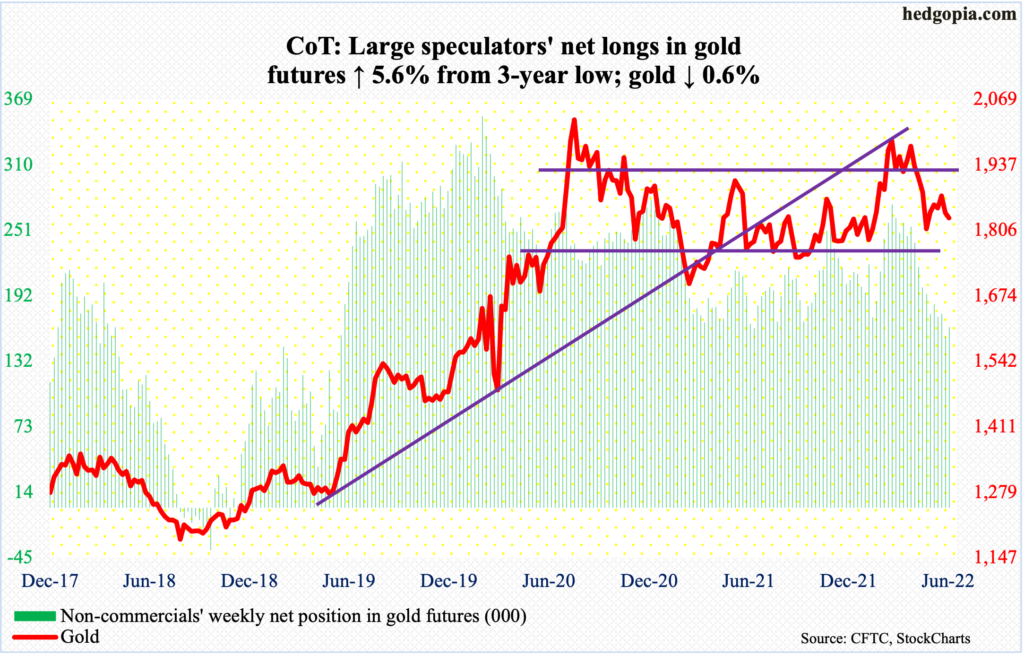
There was not a whole lot of movement in gold this week, with a high of $1,850 on Wednesday and a low of $1,818 on Friday, closing at $1,830/ounce. Last week, the metal found support at a rising trend line from March last year, even as a shorter-term trend line from last August was breached.
This week, gold just went sideways between the two. It tried to recapture the 200-day ($1,844) but unsuccessfully. The yellow metal is already under its 50-day ($1,867). In essence, gold remains in no-man’s land.
Nasdaq 100 index (mini): Currently net long 30.8k, up 2.4k.
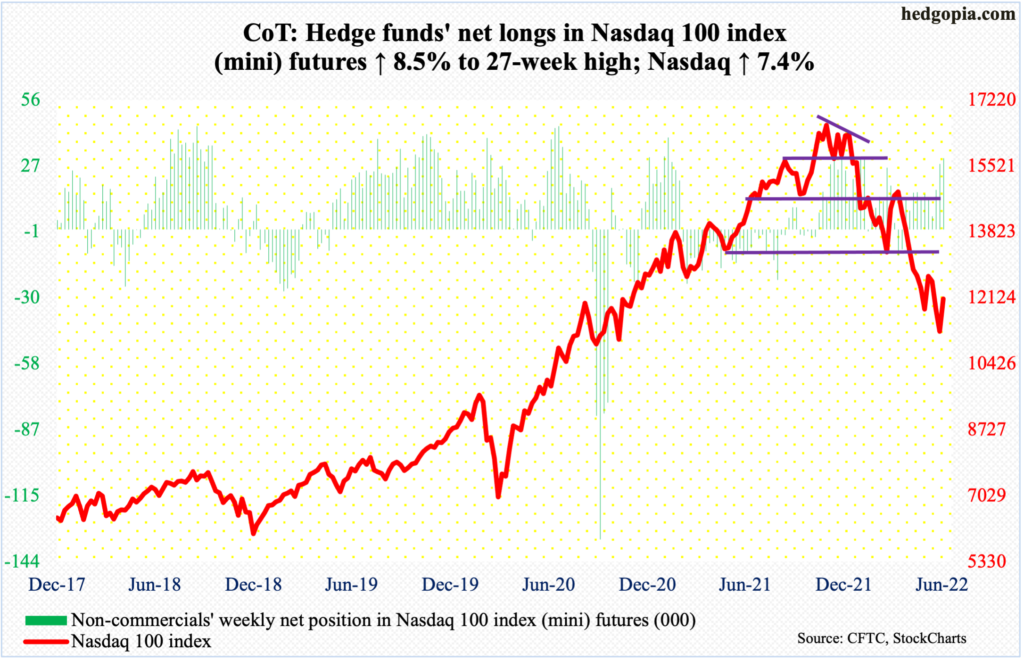
Last week, tech bulls defended a falling trend line from late last year. This came after the Nasdaq 100 tumbled 34.2 percent from last November’s record high 16765 through last Thursday’s low 11037. This week, the index rallied 7.4 percent – its first up week in four and second in 12.
Things remain oversold. The daily MACD just completed a potentially bullish crossover. The daily RSI, at 50.7, needs to decisively go over the median before momentum feeds on itself.
Immediately ahead, there is gap-down resistance just under 12300. The Nasdaq 100 closed out the week at 12106.
Russell 2000 mini-index: Currently net short 105.6k, up 10.4k.
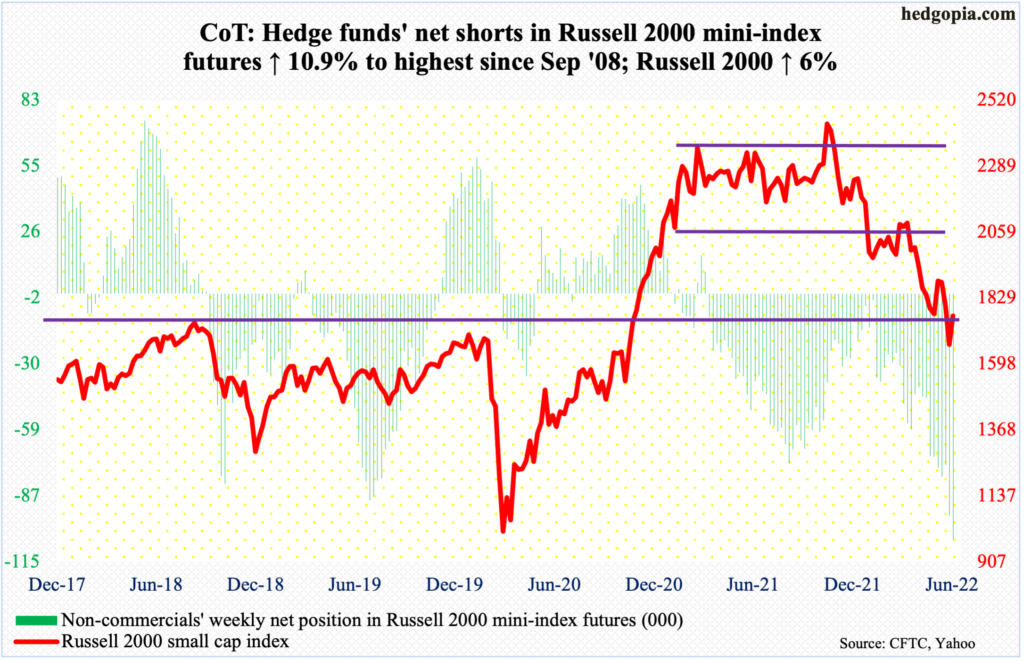
The Russell 2000 reclaimed 1700, ending the week at 1766. Last week, it slightly breached the level – which represented a failed breakout retest from November 2000. Odds have grown the small cap index now rallies toward 1900, which was lost in late April. Before that, a major breakdown occurred mid-January, losing 2080s; for 10 months, the Russell 2000 went back and forth between 2080s and 2350s.
Through all these range breakdowns, from last November’s high 2459 through last Thursday’s low 1641 – the Russell 2000 cratered 33.2 percent.
Amidst this, non-commercials’ net shorts are the highest since September 2008. An unwinding of this bearishness can result in upward pressure for the cash.
US Dollar Index: Currently net long 45k, up 534.
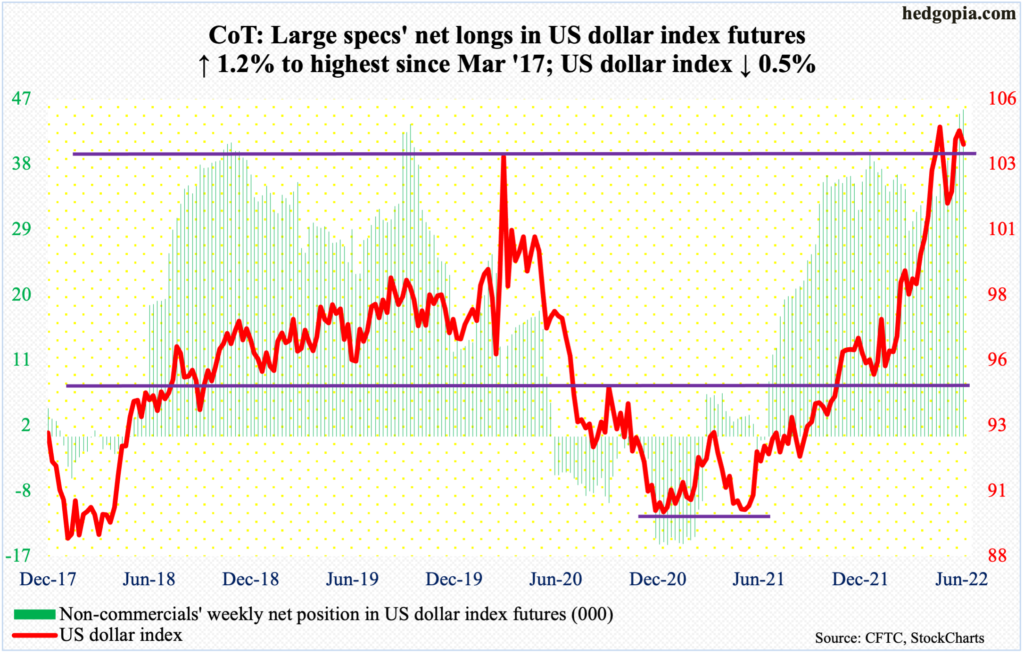
Odds are rising the US dollar index made an important high this month. The 105.56 reached intraday on the 15th was the highest print since December 2002, which dollar bulls failed to hang on to. By the end of the week, the index dropped 0.5 percent. This week’s spinning top followed last week’s exact same pattern. From 89.17 in January last year through that high, the US dollar index rallied very strong.
The index (103.96) can come under sustained pressure once 104, which acted as a ceiling going back to January 2017, gives way. After that, there is short-term horizontal support at 102.70s, which coincides with the 50-day at 102.91, and horizontal support at 101.40s after that.
VIX: Currently net short 49.9k, down 24.3k.
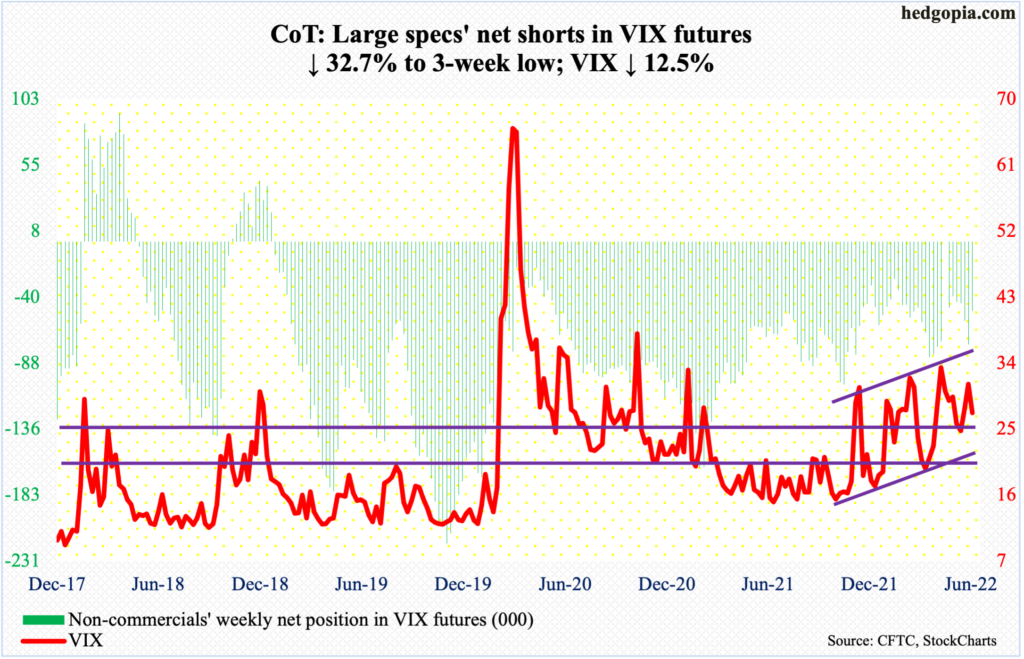
Last week, VIX flashed subtle signs of fatigue, with a weekly spinning top and Thursday posting yet another lower high in a series of lower highs (intraday) since January this year when the volatility index tagged 38.94 (more on this here). Concurrently, it has made higher lows since late last year. Accordingly, a pennant has formed. (On a closing basis, however, VIX trades within an ascending channel.)
As has been the case for the last several months, mid-20s is where a bull-bear tussle likely unfolds, followed by low-20s. As things stand, volatility bears probably have the upper hand. VIX closed Friday at 27.23.
Thanks for reading!

