Following futures positions of non-commercials are as of July 26, 2022.
10-year note: Currently net short 199.9k, up 83.9k.
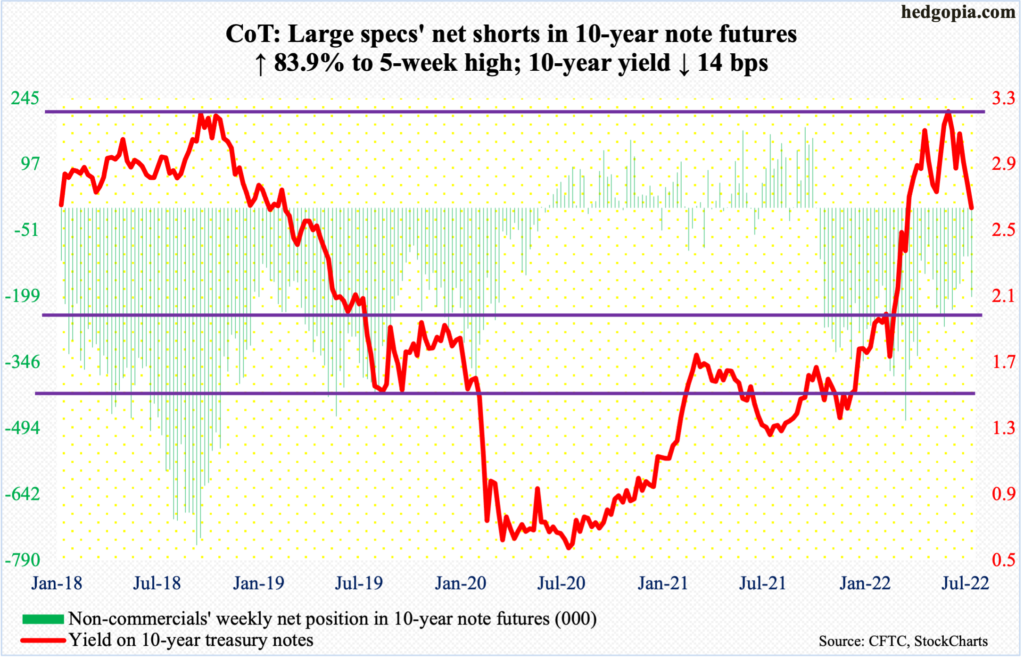
The FOMC this week delivered what officials had telegraphed the rate-setting body would do. The fed funds rate was raised by 75 basis points to a range of 225 basis points to 250 basis points. This was the fourth hike this year – preceded by increases of 75 basis points in June, 50 basis points in May and 25 basis points in March.
Markets largely expected this. As a matter of fact, right after June’s CPI report, which was published on the 13th this month showing consumer inflation shot up 9.1 percent year-over-year, they immediately priced in a 100-basis-point increase in this week’s meeting, leading several Federal Reserve officials to begin jawboning, after which futures traders went back to expecting 75.
Jay Powell, Fed chair, again seemed to be subtly preparing the markets to lower their expectations as relates to the tightening trajectory. Until a couple of weeks ago, fed funds futures saw it probable the benchmark rates would end 2022 between 350 basis points and 375 basis points. Leading into the meeting, this was lowered to a range of 325 basis points and 350 basis points.
Powell’s post-meeting statement read, “As the stance of monetary policy tightens further, it likely will become appropriate to slow the pace of increases while we assess how our cumulative policy adjustments are affecting the economy and inflation.”
He seemed to be telling the markets to go it slow. But the message at best is blurred. Right now, the Fed’s dot plot is tighter. Fed funds futures anticipate the Fed to start cutting by next summer, even as the FOMC in June expected no cuts until at least 2024.
Once again, it is likely to be a case of markets leading the Fed – this time, it will be to the downside.
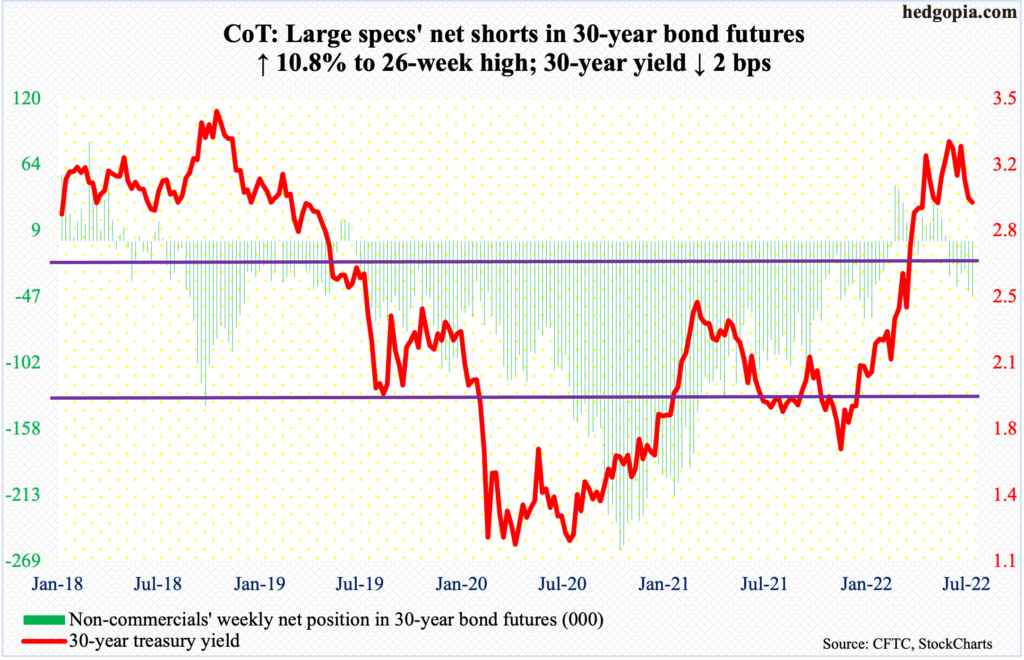
30-year bond: Currently net short 46.6k, up 4.5k.
Major economic releases for next week are as follows.
Monday brings the ISM manufacturing index (July). In June, US manufacturing activity dropped 3.1 percentage points month-over-month to 53 percent.
Job openings (JOLTs, June) are due out on Tuesday. In May, non-farm openings declined 427,000 m/m to 11.3 million. The series peaked at 11.9 million in March.
The ISM services index (July) and durable goods orders (June, revised) are on dock for Wednesday.
US services activity edged lower six-tenths of a percentage point m/m in June to 55.3 percent.
Preliminarily, June orders for non-defense capital goods ex-aircraft – proxy for business capex plans – increased 0.5 percent m/m to a seasonally adjusted annual rate of $73.9 billion, which was a new record.
Payroll (July) is scheduled for Friday. In the first half this year, the economy averaged 457,000 non-farm jobs a month, which represents significant deceleration from last year’s monthly average of 562,000.
WTI crude oil: Currently net long 256.9k, down 21.5k.
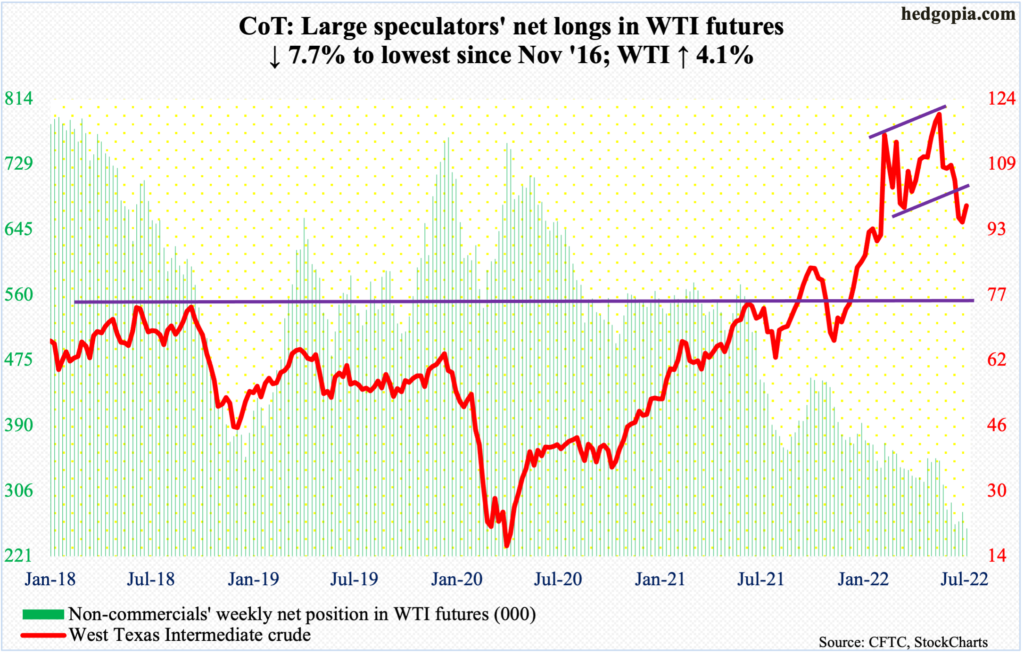
Horizontal support at $93-$94 was once again tested – successfully. This was the third week in a row this level found buyers.
On June 14, WTI ($98.62/barrel) rolled over after tagging $123.68 intraday, which was a lower high versus $130.50 posted on March 7. The subsequent selloff bottomed at $90.56 on the 14th (this month).
Since that low, the crude has pretty much been trading just above the 200-day ($94.36), with a few intraday breaches.
At this point, it remains bulls’ ball to lose so long as $93-$94 remains intact. The 50-day lies at $107.52.
In the meantime, per the EIA, US crude production in the week to July 22 increased 200,000 barrels per day to 12.1 million b/d. Crude imports decreased 355,000 b/d to 6.2 mb/d. As did stocks of crude, gasoline and distillates, which respectively dropped 4.5 million barrels, 3.3 million barrels and 784,000 barrels to 422.1 million barrels, 225.1 million barrels and 111.7 million barrels. Refinery utilization dropped 1.5 percentage points to 92.2 percent.
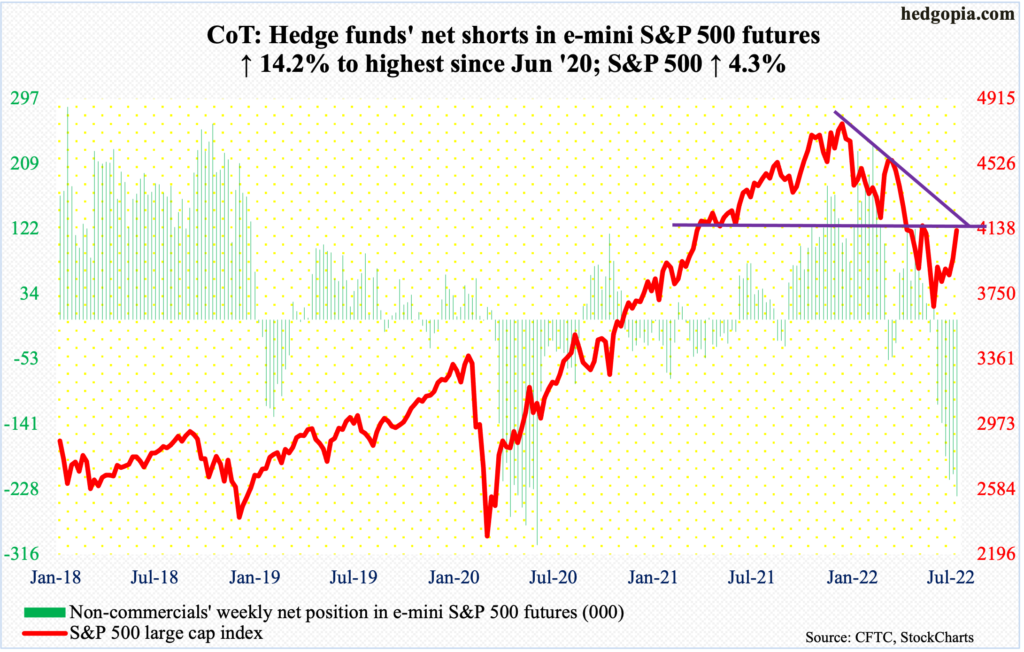
E-mini S&P 500: Currently net short 237.6k, up 29.5k.
For the first time in seven weeks, flows into US-based equity funds turned positive in the week to Wednesday, taking in $372 million; in the prior six, $51 billion came out (courtesy of Lipper). SPY (SPDR S&P 500 ETF), VOO (Vanguard S&P 500 ETF) and IVV (iShares Core S&P 500 ETF), too, attracted $5.2 billion in the week to Wednesday (courtesy of ETF.com).
This week’s inflows followed last week’s 2.5-percent rally in the S&P 500. This week, the large cap index tacked on another 4.3 percent. This was the fourth up week in the last six.
Earlier, the index ticked 3637 on June 17, down 24.5 percent from January’s record high 4819.
The daily is extended, but should the weekly prevail, there is room for continued rally. There is decent resistance at 4160s. At the same time, several weekly indicators are approaching the median from oversold levels, and this is where weakness can occur.
A 50-percent retracement of the January-June decline lies at 4228. The S&P 500 closed out the week at 4130.
Euro: Currently net short 41.6k, down 1.2k.
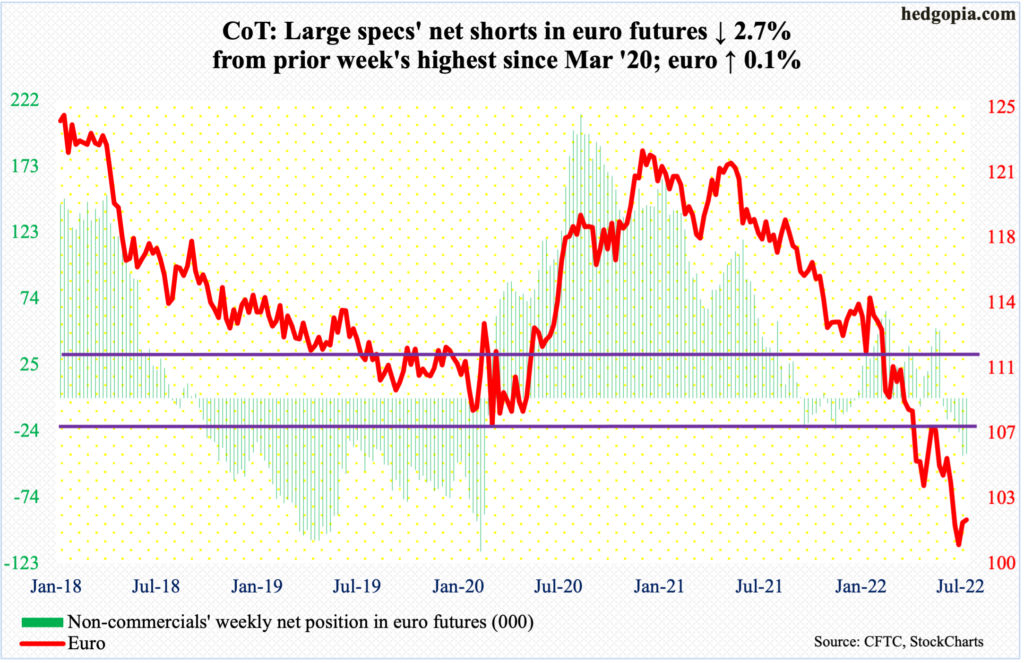
The euro ($1.0221) just completed a potentially bullish crossover between the 10- and 20-day.
This week, the currency edged up 0.1 percent. Euro bulls nevertheless should view this as positive as the currency is trying to stabilize after a big drop, having fallen from $1.2345 in January last year to $0.9952 on the 14th (this month). It also breached parity on the 13th, touching $0.9998.
The first step toward recovery takes place once bulls reclaim $1.0350s, which incidentally would also have filled a July 5th gap. After this lies crucial $1.04-$1.05, which, once recaptured, would mark a shift in trend.
Importantly, two of the last three weeks have formed a weekly dragonfly doji. Dip-buying is taking place.
Gold: Currently net long 92.7k, down 2.3k.
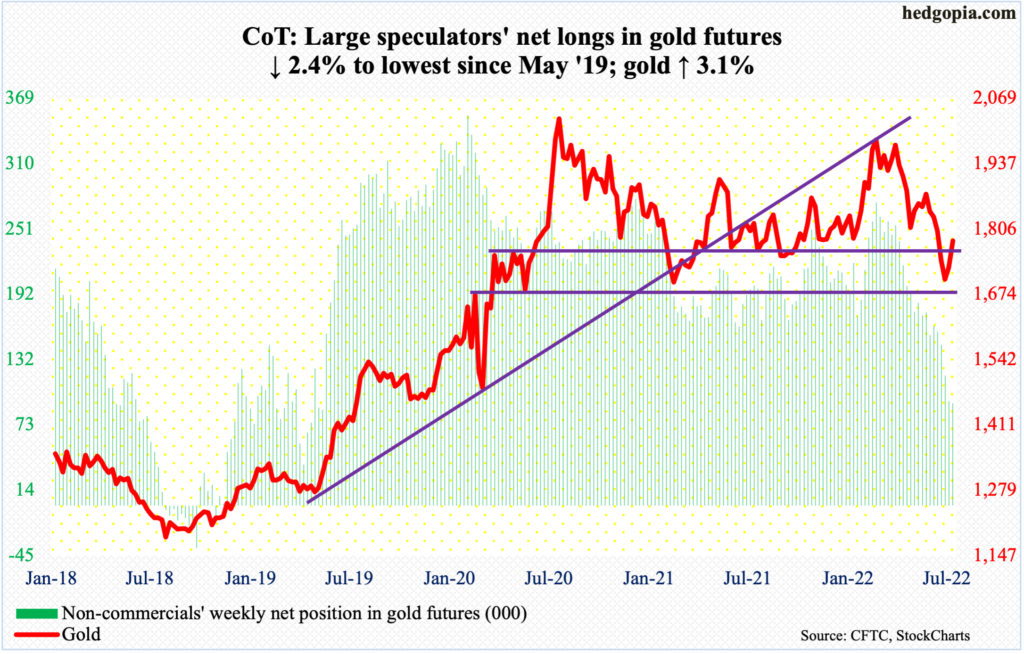
Gold ($1,782/ounce) rallied 3.1 percent this week to nudge its head out of a crucial roadblock.
This was the second straight positive week, which came after five down weeks in a row. Last week, the metal tagged $1,678 and rallied, for a successful test of $1,670s, which was also successfully defended last August.
Before that, gold breached $1,760s-$1,770s early this month, leading to sustained pressure. This is the one to watch for now. The weekly is setting up well for gold bugs, and they should be able to capitalize on this.
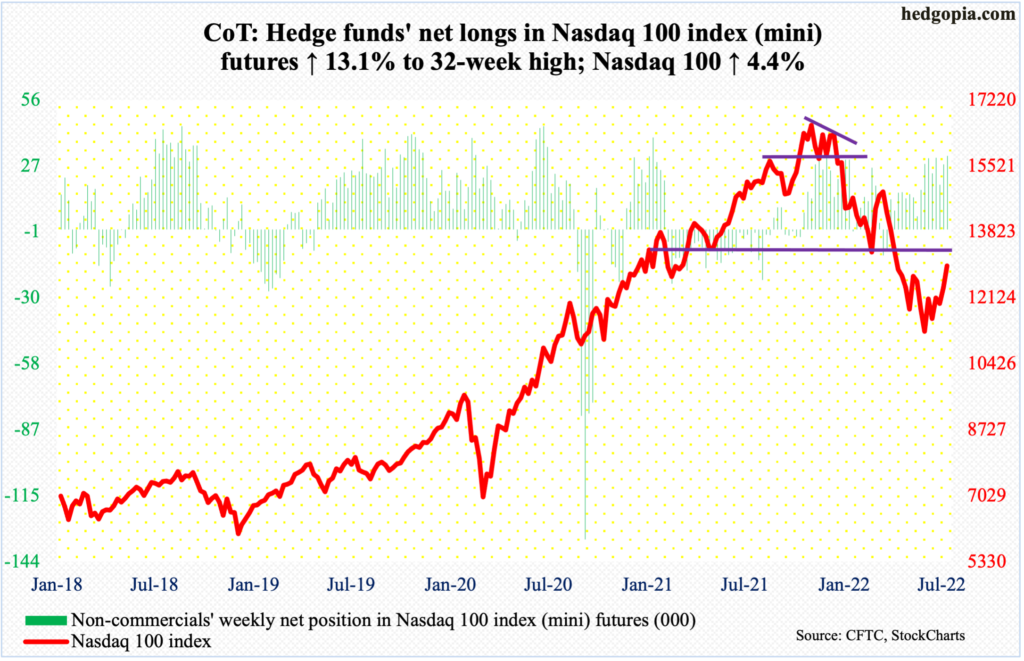
Nasdaq 100 index (mini): Currently net long 31.8k, up 3.7k.
Tech delivered. Or, markets interpreted their results as such (more on this here).
Of the five major tech outfits reporting the June quarter this week, Microsoft (MSFT) and Google owner Alphabet (GOOG) missed but elicited positive post-earnings reaction anyway; Facebook owner META (META), too, missed and sold off but is drawing buying interest at important support. Apple (AAPL) and Amazon (AMZN) beat on both the top and bottom lines and were rewarded.
In the end, the Nasdaq 100 rallied 4.4 percent for the week – its second consecutive up week and fourth in six.
The tech-heavy index has made higher lows since it bottomed at 11037 on June 16. Through that low, it plunged 34.2 percent from last November’s high 16765.
Resistance is likely to be strong at 13000. Now that the earnings-driven push has come through, it is likely weakness develops at this level. On Friday, the index tagged 12987 before closing at 12948.
Russell 2000 mini-index: Currently net short 105.2k, up 4.5k.
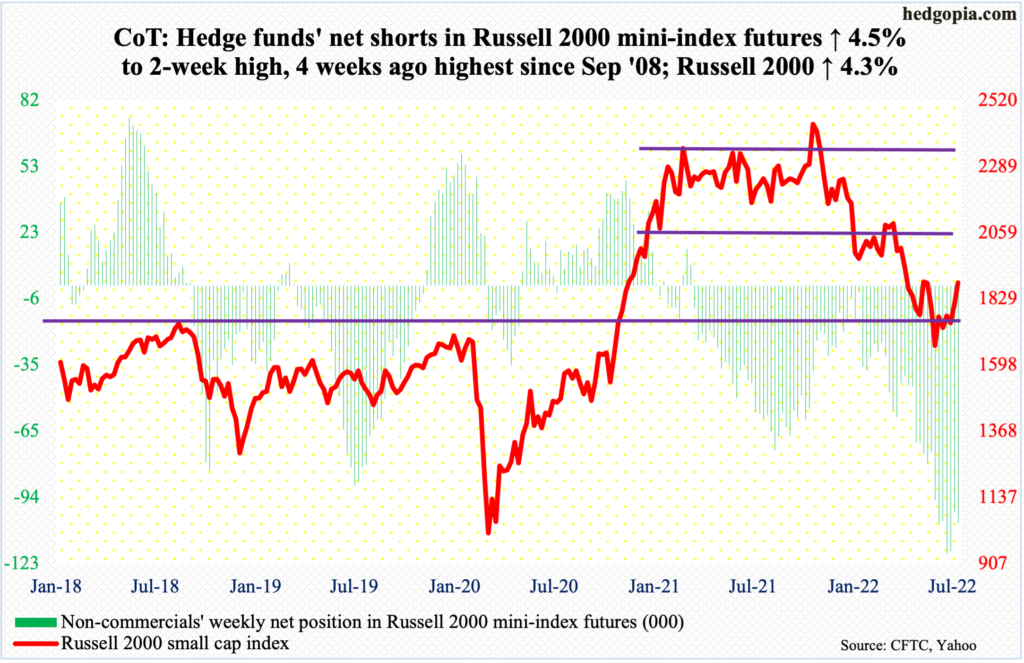
At Friday’s intraday high of 1888, the Russell 2000 (1882) was 0.6 percent from testing range resistance at 1900. This would have been the first test after similar tests in May and June were rejected. The small cap index breached the level in early May, subsequently defending 1700, which is where it broke out of in November 2020.
Earlier, a major breakdown occurred mid-January, losing 2080s; for 10 months, the Russell 2000 went back and forth between 2080s and 2350s. It then seesawed between 2080s and 1900, followed by a ping pong match between 1900 and 1700.
The recent stability has come after the index suffered a 33.2-percent plunge between last November’s peak (2459) and June’s trough at 1641. This week, the index broke through a falling trend line from that peak. The icing on the cake will be a push through 1900, which in due course would open the door toward 2080s.
But until that happens, odds favor shorts get active here. The daily is extended.
US Dollar Index: Currently net long 40.5k, up 1.5k.
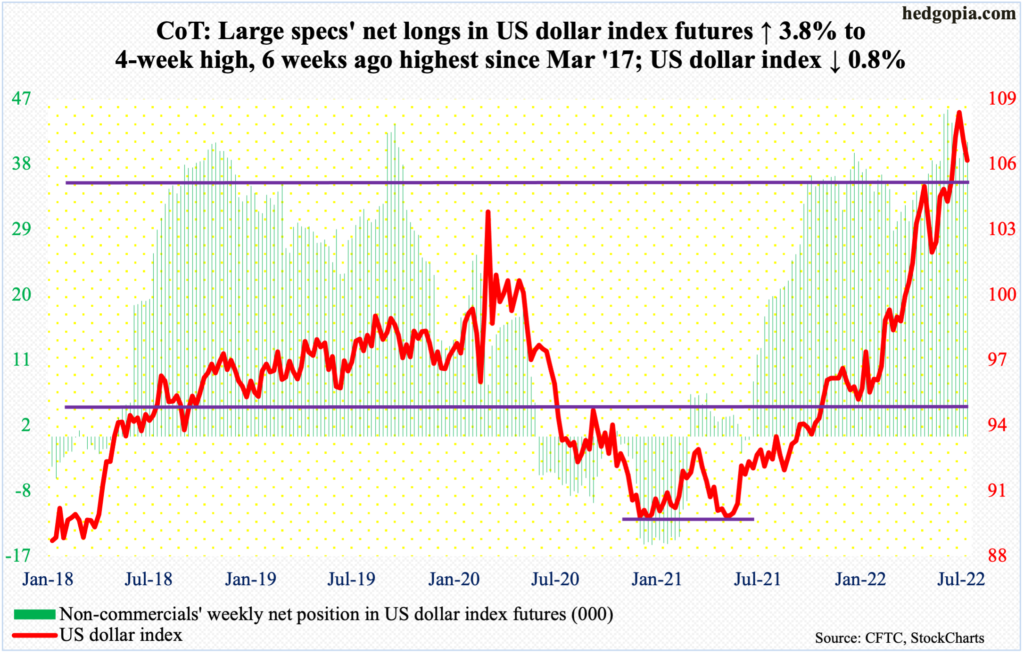
Through Thursday, the US dollar index saw bids appear at 106 for several sessions before slightly breaching it on Friday. Earlier on the 14th (this month), it ticked 109.14 intraday; in January last year, the index bottomed at 89.17.
The mid-month high could prove to be an important high. The US dollar index remains way overbought on both the weekly and monthly, with July producing a shooting star.
As the overbought condition gets unwound, a crucial breakout retest lies ahead. Three weeks ago, the index (105.78) broke out of 105, and out of 104 before that in June, with the latter acting as a ceiling going back to January 2017. A loss of 104 will be a major negative for dollar bulls.
VIX: Currently net short 92.6k, up 22.7k.
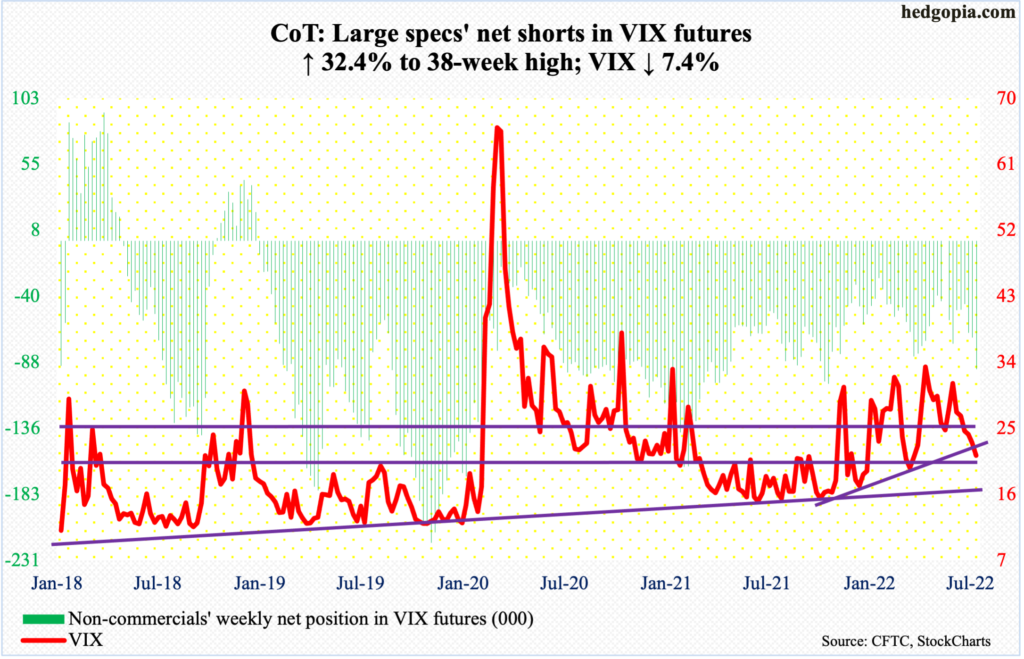
VIX suffered its sixth consecutive down week, down 7.4 percent for the week and under the 200-day, with only one of the last eight sessions closing above the average (24.18).
Amidst this, the volatility index approaches important support. There is horizontal support at low-20s. A rising trend line from last November when VIX (21.33) bottomed at 14.73 has been slightly breached. If this decisively gives way, then volatility bears – or, equity bulls – could be eyeing 17, which represents a rising trend line from November 2017 when VIX made an all-time low of 8.56; right at this moment, it is unlikely things evolve this way.
Thanks for reading!

