
Following futures positions of non-commercials are as of May 23, 2023.
10-year note: Currently net short 771.6k, up 79.2k.
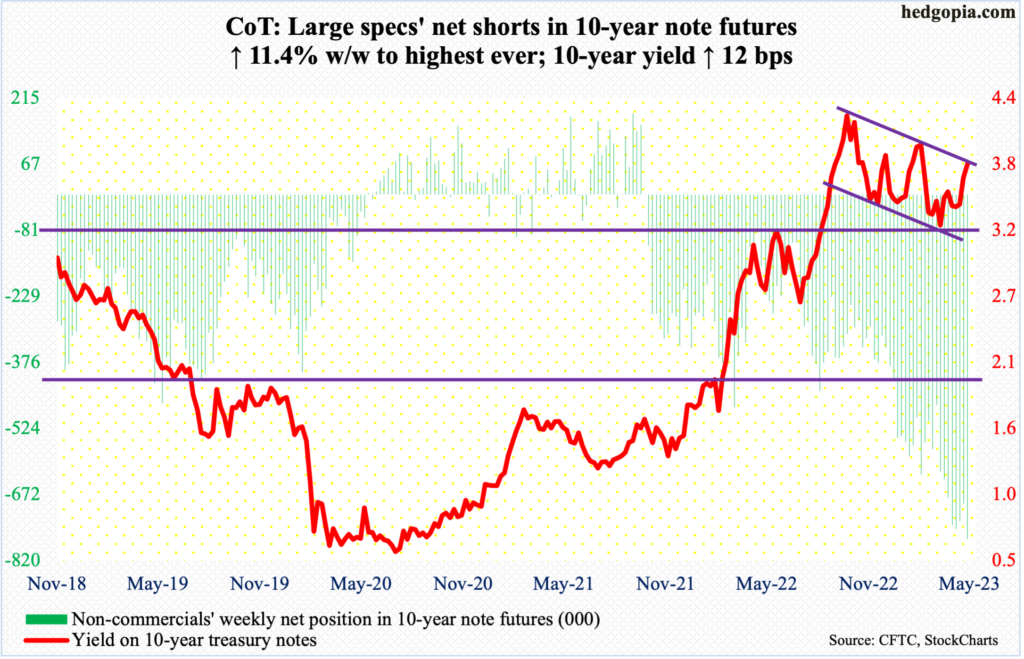
It took them a while, but futures traders have at long last stopped wasting money expecting an improbable outcome.
Until last week, they were pricing in this month’s 25-basis-point hike to be the last one in the current tightening cycle and for the fed funds rate to end the year at 450 basis points to 475 basis points. The benchmark rates are currently in a range of 500 basis points to 525 basis points.
In fact, until two weeks ago, they were expecting three 25-basis-point cuts by year-end. They doggedly stuck to this view, even though Chair Jerome Powell and his team made it loud and clear that they saw no easing this year, although he did drop hints at the May 2-3 FOMC meeting that they were ready to pause in the June meeting.
Fast forward to now, and these traders are now assigning a 64-percent probability to a 25-basis-point raise in next month’s (13-14) meeting, to a range of 525 basis points to 550 basis points, ending the year between 500 basis points and 525 basis points with one cut.
First, Powell deserves credit for not caving in to spoiled markets’ undue demands. Secondly, the futures traders still expect one cut this year, which, given how inflation and the job market are behaving, does not look like it is forthcoming.
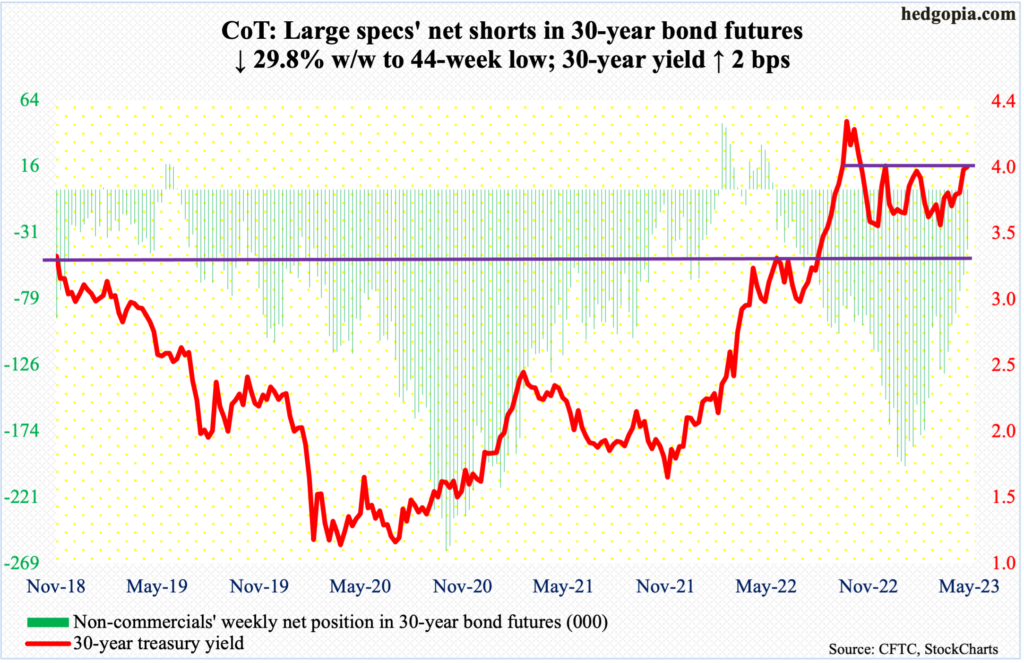
30-year bond: Currently net short 43.2k, down 18.3k.
Major economic releases for next week are as follows.
Markets are closed Monday for observance of Memorial Day!
The S&P Case-Shiller home price index (March) is scheduled for Tuesday. Nationally, US home prices in February increased 2.1 percent year-over-year. This was the slowest price appreciation since July 2012. The all-time high of 20.8 percent was recorded in March last year.
Non-farm job openings (JOLTS, April) are due out Wednesday. In March, non-farm openings declined 384,000 month-over-month to 9.59 million – a 23-month low. Openings peaked at 12.03 million in March last year.
Thursday brings labor productivity (1Q23, revised) and the ISM manufacturing index (May).
The preliminary reading showed non-farm output/hour contracted at an annualized rate of 2.8 percent in 1Q23.
April’s manufacturing activity increased eight-tenths of a percentage point m/m to 47.1 percent. This was the sixth consecutive month of sub-50 reading.
Payrolls (May) are on dock for Friday. In the first four months this year, the economy produced an average 285,000 non-farm jobs. This is healthy, although the pace has decelerated from last year’s monthly average of 399,000 and 606,000 before that in 2021.
WTI crude oil: Currently net long 239.7k, up 17.9k.
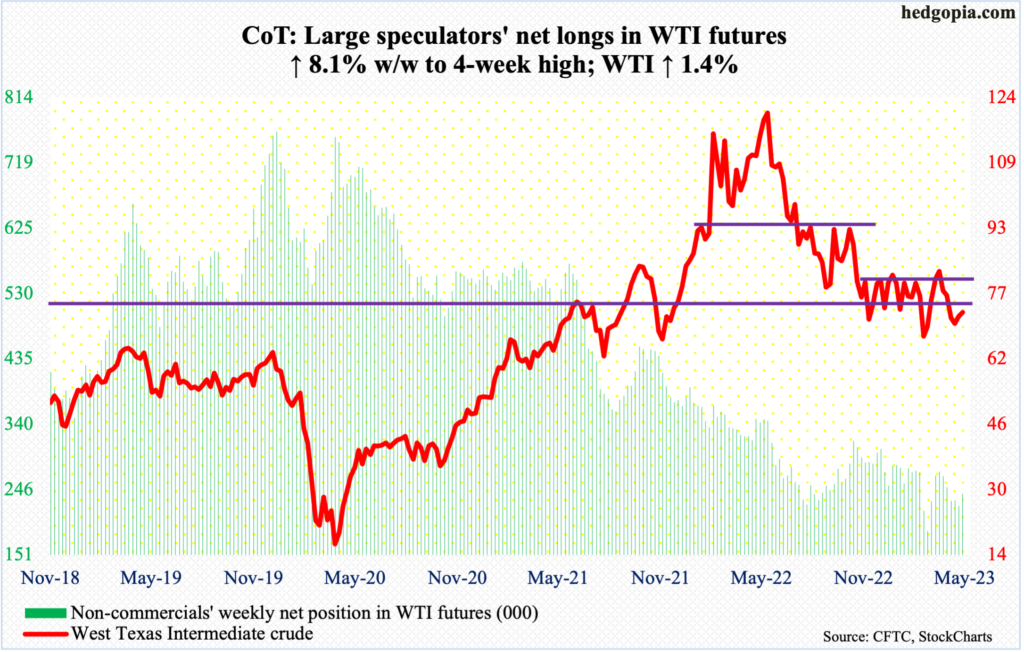
WTI continued to hover near the bottom of a five-and-a-half-month range between $71-$72 and $81-$82. Mid-week, it rallied as high as $74.73, but only to finish the week at $72.67/barrel. Sellers showed up Wednesday at the 50-day ($74.63). The crude has not closed above the average since late April, and for five weeks now it has had trouble penetrating $74.
Friday’s low ($71.49) found buyers at a rising trend line from early this month. A break – likely – can see WTI dropping toward at least high-$60s.
In the meantime, as per the EIA, US crude production in the week to May 19 increased 100,000 barrels per day week-over-week to 12.3 million b/d. Crude imports decreased 1 mb/d to 5.9 mb/d. As did stocks of crude, gasoline, and distillates, which respectively declined 12.5 million barrels, 2.1 million barrels and 561,000 barrels to 455.2 million barrels, 216.3 million barrels and 105.7 million barrels. Refinery utilization dropped three-tenths of a percentage point to 91.7 percent.
E-mini S&P 500: Currently net short 404.3k, up 15.6k.
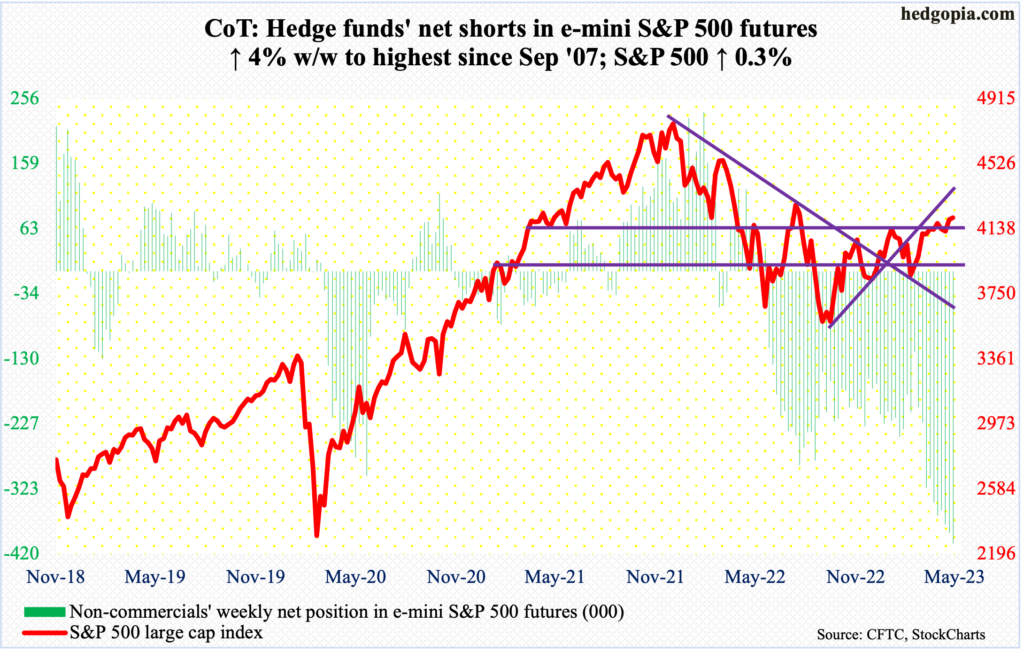
Non-commercials are ever closer to accumulating most net shorts ever. This week, they were sitting on 404,292 contracts, which is only second to the 408,653 net shorts they had in the week to September 11, 2007.
The S&P 500 back then peaked at 1576 in October 2007 and by March 2009 had tumbled to 667. Mid-to long-term, the index in all probability is headed a lot lower. Fund flows and margin debt in particular refuse to jump on the bullish bandwagon (more on this here). If non-commercials stay put with their holdings, they stand to do all. But the problem near-term is rising risk of a squeeze.
This week, through Wednesday’s low of 4104, the large cap index was down 2.1 percent for the week; by the end of the week, it finished up 0.3 percent to 4205, forming a weekly candle that only time will tell if it is a hanging man (bearish) or a hammer (bullish).
As things stand, if the bulls succeed in decisively pushing through 4200, a squeeze is looking probable – duration and magnitude notwithstanding.
Euro: Currently net long 173.7k, down 13.4k.
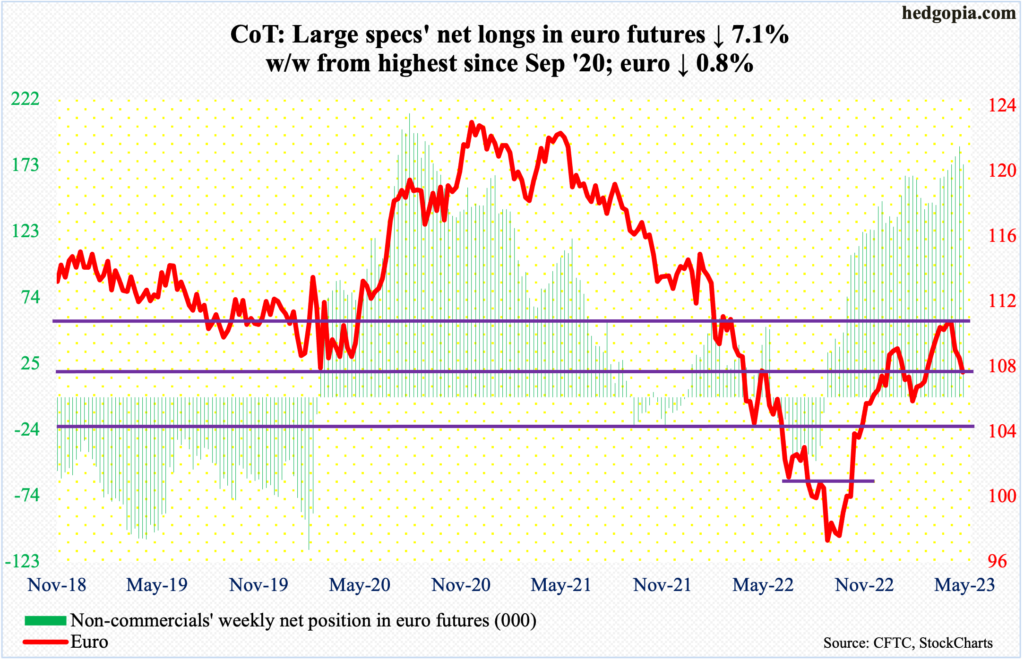
Rejection at horizontal resistance at $1.09-$1.10 is proving costly for euro bulls. The currency tagged $1.1095 five weeks ago, followed by $1.1092 the week after that, before coming under pressure the last three weeks.
Earlier last September the currency bottomed at $0.9559.
The daily is in oversold territory, but should the weekly prevail, there is more room for downward pressure. In this scenario, there is lateral support at $1.07-$1.08, which is where the euro ($1.0726) closed this week. A breach opens the door toward $1.04-$1.05, which has been an important level going back at least eight years and which was reclaimed last December and has not been tested since.
Gold: Currently net long 160.7k, down 19.1k.
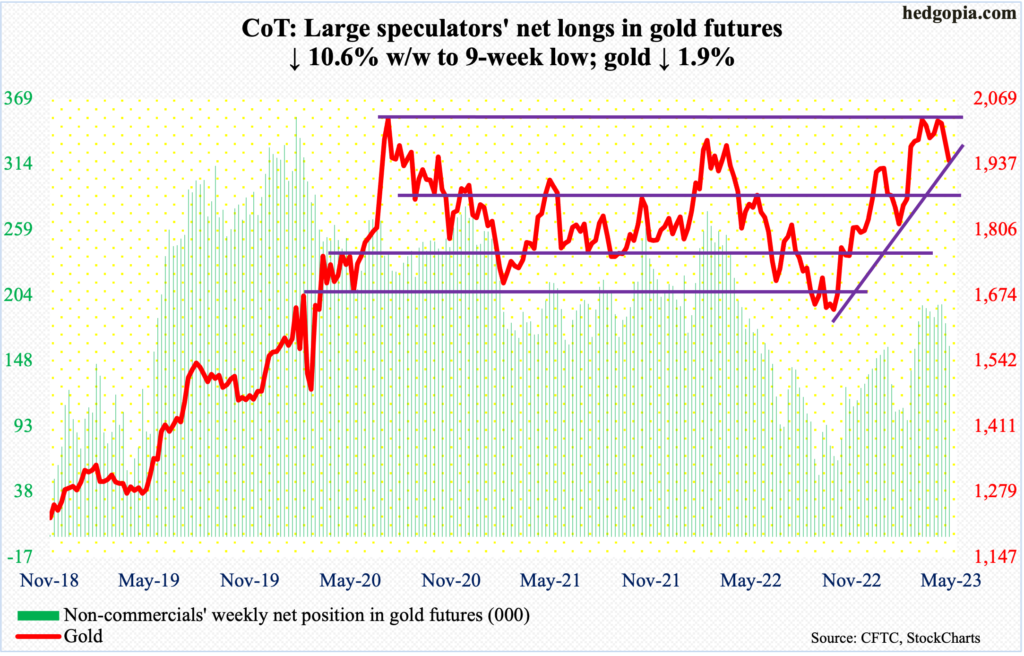
Non-commercials are beginning to cut back their net longs. They held 195,814 contracts in the week to May 9. On the 4th, in a spinning top session, gold touched $2,085 but was unable to hang on to the gains. The metal tagged $2,089 in August 2020 – an all-time high – and $2,079 in March 2022. This time around, bulls tried several times, but these levels kept attracting offers.
At 160,732 contracts, non-commercials are still sitting on boatloads of net longs. Gold this week closed at $1,944, right on rising trendline support from last October when it bottomed at $1,620s. A breach of this trendline can lead the yellow metal hurriedly head toward $1,920s, which is a must-hold for the bulls.
Nasdaq 100 index (mini): Currently net long 14.5k, down 5.5k.
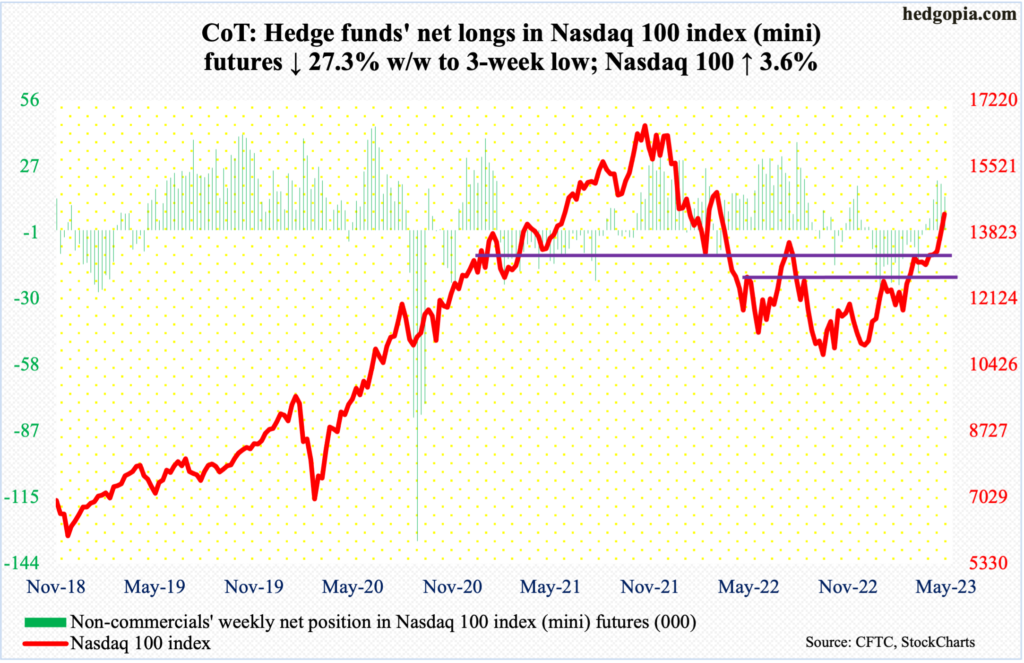
The Nasdaq 100 was held down at 13100s for four weeks before it poked its head out five weeks ago. The tech-heavy index has not looked back since – particularly this week when it added 3.6 percent and last week when it rallied 3.5 percent.
Semis shot up the last two weeks, with SMH (VanEck Vectors Semiconductor ETF) rallying 10.6 percent this week alone on the back of Nvidia’s (NVDA) earnings results. Of note, SMH short interest surged 95.4 percent period-over-period mid-May (chart here); odds favor these shorts got squeezed.
The way tech is rallying, there will come a time when sentiment will have shifted too bullish and there is nothing to push it higher. It is too soon to say if the trade is overcrowded. The next level to watch is 14500s, with the Nasdaq 100 closing at 14298 this week.
Russell 2000 mini-index: Currently net short 48.9k, down 15.1k.
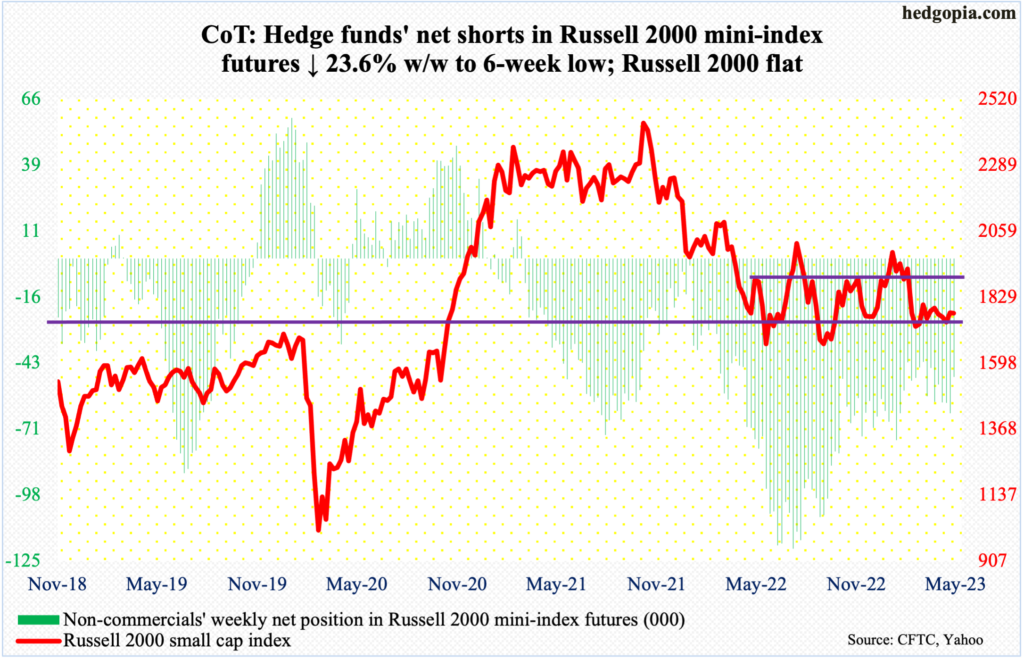
While tech shines, small-caps are losing luster.
Once again, the Russell 2000 was denied at 1800, which represents the mid-point of a range between 1900 and 1700 intact since January last year. For two and a half months now, the small cap index has struggled at 1800.
This week, the index traded north of 1800 intraday Monday through Wednesday but only to close below in all three sessions. The range has clearly narrowed between 1800 and 1700. At some point, a test of 1700 is more likely than reaching 1900.
US Dollar Index: Currently net long 11.2k, up 1.7k.
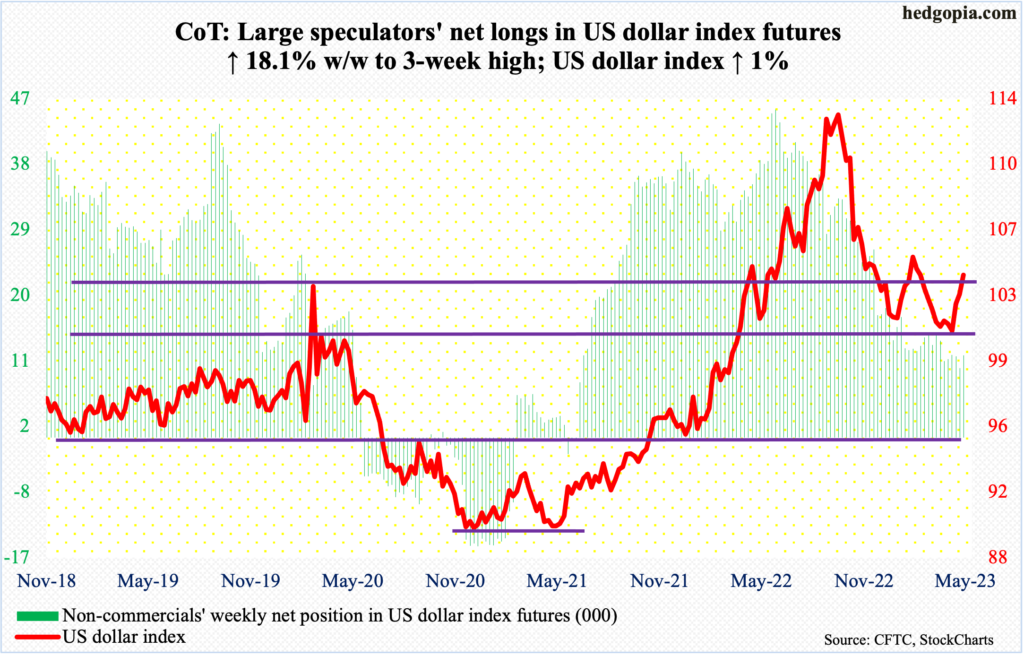
The US dollar index rallied one percent this week but is yet to decisively break out of 103-104. Closing at 104.14, it has now rallied for three weeks in a row. The latest rally preceded four weeks of sideways action at 100-101, wherein lies eight-year horizontal support.
Support-turned resistance at 103-104 was lost mid-March. The next level of resistance lies at 105-106.
VIX: Currently net short 64.6k, up 10.2k.
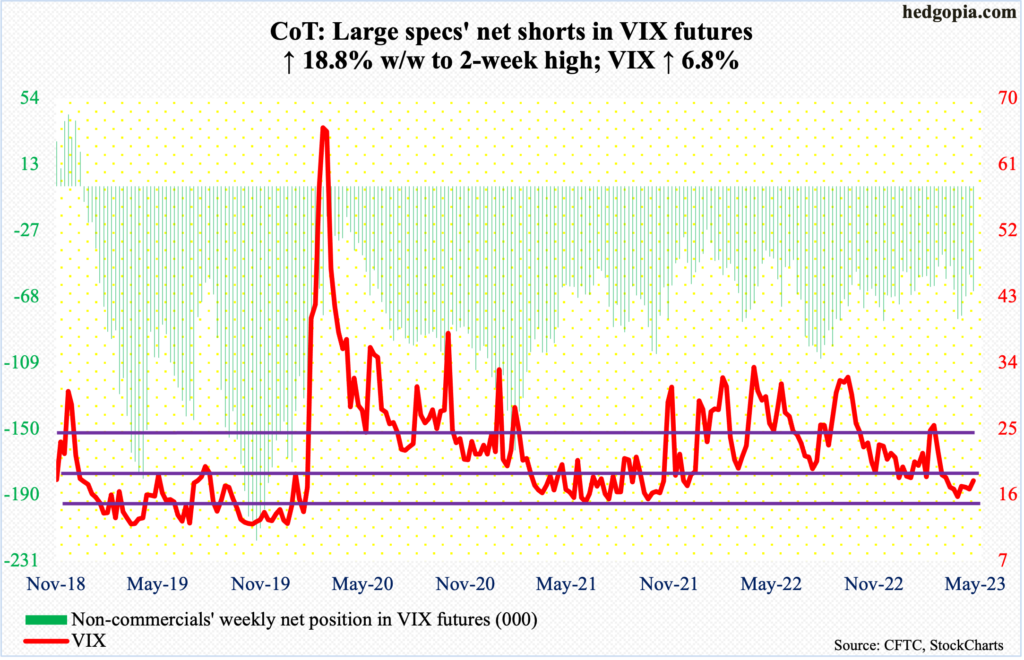
Volatility bulls are not in a mood to lose a rising trendline from November 2017 when VIX reached an all-time low of 8.56.
This week, both the volatility index and the S&P 500 rallied; they normally go the opposite ways. Last week, VIX just about closed right on the trendline; this week’s 1.14-point rise puts the index comfortably past the trendline.
That said, volatility bulls did fail to cling on to all of the weekly gains, with VIX ticking 20.81 intraday Wednesday and closing the week out at 17.95.
There is decent resistance just north of 18.
Thanks for reading!
