
Following futures positions of non-commercials are as of July 18, 2023.
10-year note: Currently net short 629.6k, down 5.6k.
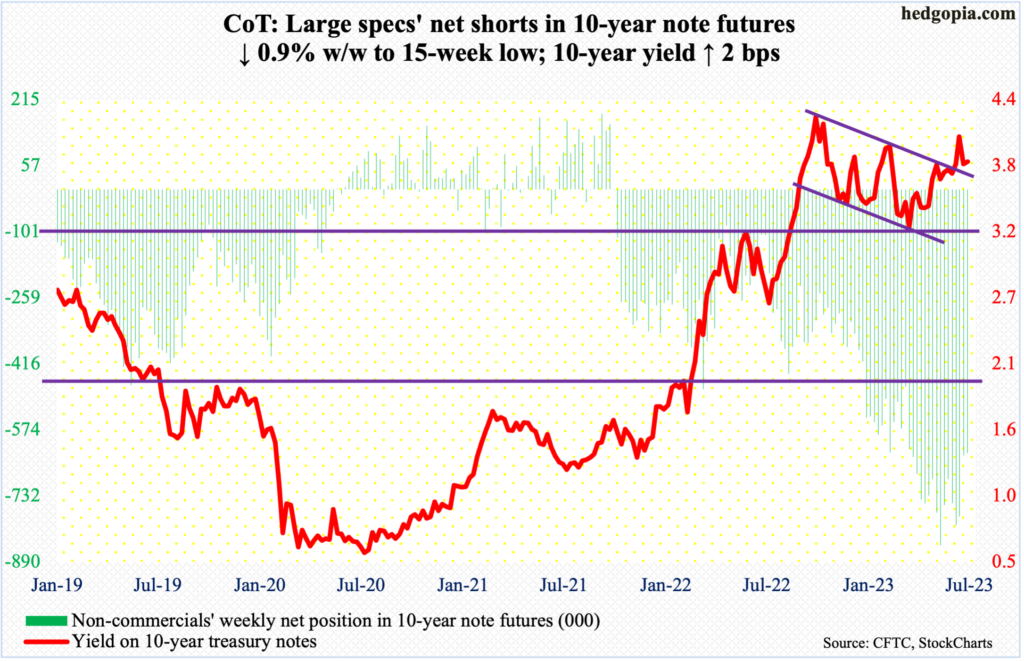
The FOMC meets next week. Ahead of this, the fed funds rate was left unchanged in the June meeting, pausing for the first time after raising the fed funds rate from a range of zero to 25 basis points in March last year to a range of 500 basis points to 525 basis points.
In June, the statement, as well as Chair Jerome Powell before the press, hinted strongly that they would hike in July. Markets are ready. In the futures market, a 25-basis-point increase is baked in, with a near certainty.
More crucial is the outlook – or a lack thereof. Futures traders currently believe that this would be the last hike in the current tightening cycle and that the Fed would begin to lower rates by next March, ending 2024 between 400 basis points and 425 basis points, which would be 125 basis points lower from next week’s hike. This is aggressive.
For this level of easing to occur, the economy will have to significantly decelerate/enter recession, which markets have not yet priced in – either in equities or bonds.
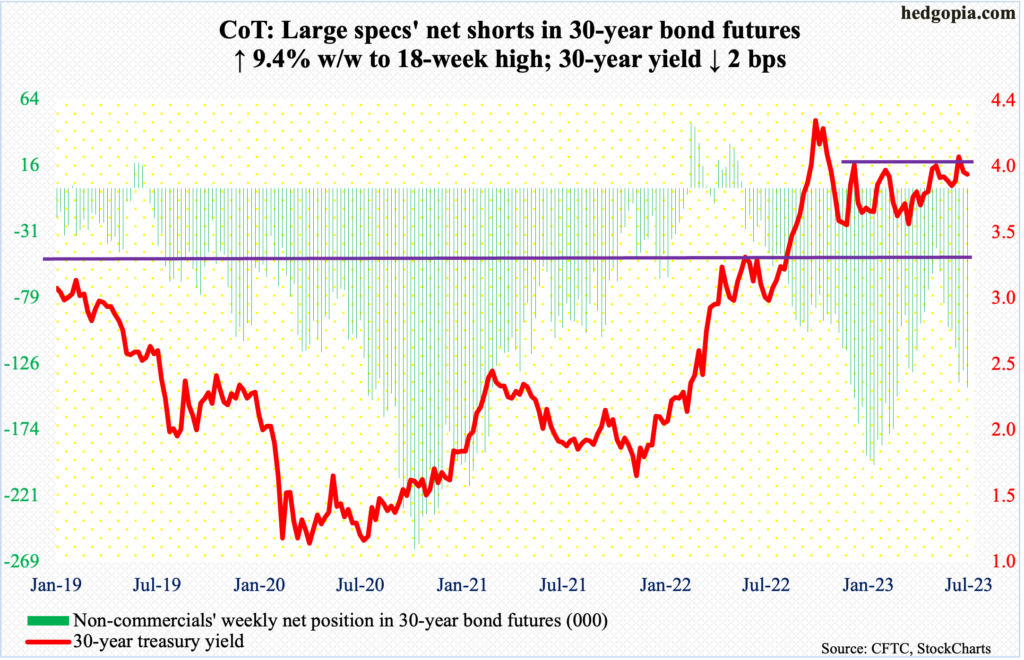
30-year bond: Currently net short 143.3k, up 12.3k.
Major US economic releases for next week are as follows.
Tuesday brings the S&P Case-Shiller home price index (May). In April, US home prices nationally inched lower 0.2 percent from a year ago. This was the first year-over-year drop in 11 years.
New home sales (June) are due out Wednesday. In May, sales jumped 12.2 percent month-over-month to a seasonally adjusted annual rate of 763,000 units – a 15-month high.
On Thursday, durable goods orders (June) and GDP (2Q23, first print) are on deck.
Orders for non-defense capital goods ex-aircraft – proxy for business capex plans – rose 0.7 percent m/m to $74.1 billion (SAAR). This is a new record.
In the first quarter, real GDP grew at an annualized rate of two percent, which was slower than 2.6 percent in 4Q22 and 3.2 percent before that. In the first two quarters last year, the economy shrank 1.6 percent and 0.6 percent, in that order.
Personal income/spending (June), the employment cost index (2Q23) and the University of Michigan’s consumer sentiment index (July, final) are scheduled for Friday.
In the 12 months to May, headline and core PCE (personal consumption expenditures) increased 3.9 percent and 4.6 percent respectively. They respectively peaked last year at seven percent and 5.4 percent in June and February, in that order. The Fed targets two percent on core PCE.
In the first quarter, total compensation for private industry workers grew 4.8 percent y/y. The 5.5-percent y/y pace recorded in 2Q22 was the steepest since 2Q84.
July’s preliminary reading showed consumer sentiment jumped 8.2 points m/m to 72.6, which was the highest since September 2021. In June last year, sentiment hit a record low 50.
WTI crude oil: Currently net long 255.1k, up 46.9k.
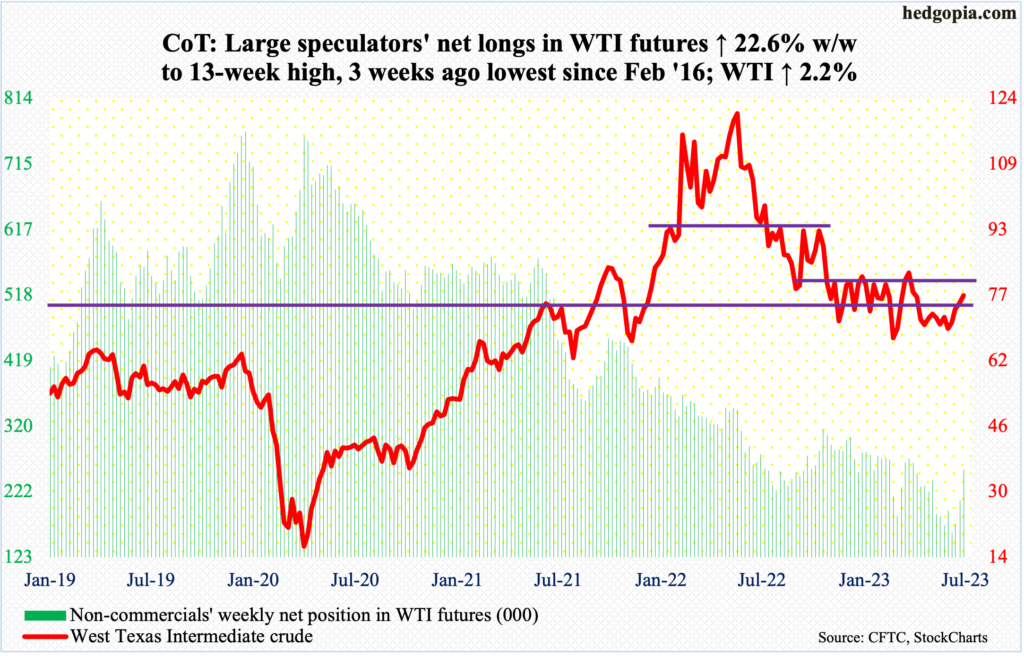
West Texas Intermediate crude is back at testing its 200-day. On Thursday and Friday last week, the average was tested but could not be recaptured. This week, once again, the crude finished just under the average ($77.18), rallying 2.2 percent for the week to $77.07/barrel; earlier, oil bulls on Monday and Tuesday used session lows just south of $74 as an opportunity to go long.
Non-commercials have been adding to net longs, which are at a 13-week high; in the week to July 3, holdings were down to the lowest since February 2016.
Odds favor the 200-day gets taken out in the sessions ahead. WTI has been rangebound between $71-$72 and $81-$82 for over seven months now. Longs have a shot at the upper bound.
In the meantime, as per the EIA, US crude production in the week to July 14 was unchanged week-over-week at 12.3 million barrels per day. Crude imports increased 1.3 mb/d to 7.2 mb/d. Distillate stocks edged up 13,000 barrels to 118.5 million barrels, even as stocks of crude and gasoline decreased – respectively down 708,000 barrels and 1.1 million barrels to 457.4 million barrels and 218.4 million barrels. Refinery utilization rose six-tenths of a percentage point to 94.3 percent.
E-mini S&P 500: Currently net short 263.7k, up 54.7k.
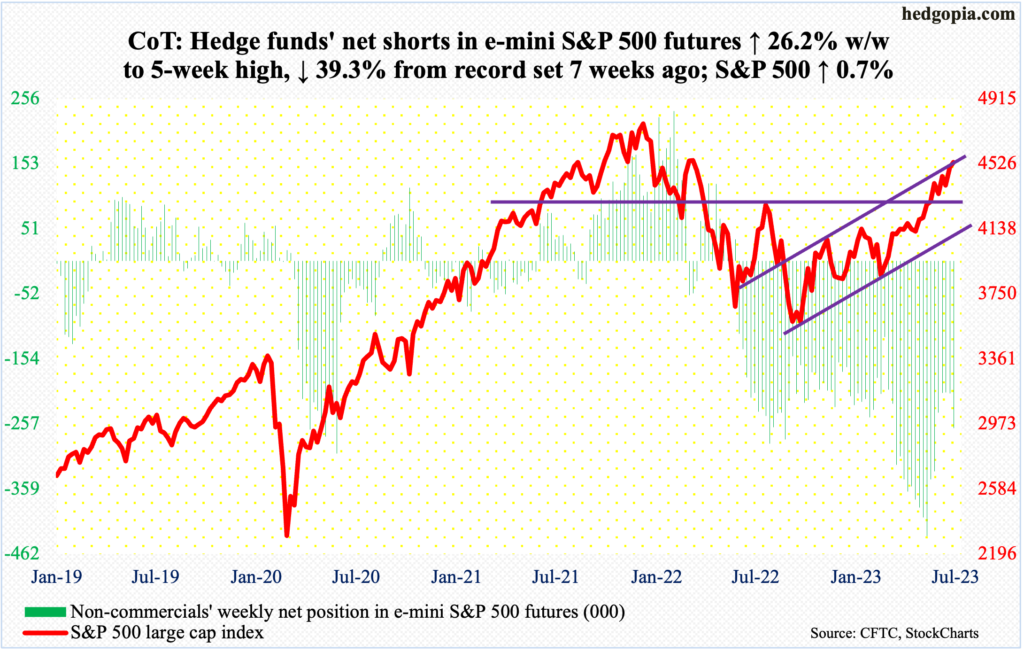
The S&P 500 continues to rally along the upper trendline of an ascending channel from last October’s low. Since it is a rising channel, resistance level rises as time passes. This week, the large cap index rose 0.7 percent to 4536, essentially ending right on the trendline. In fact, if Wednesday’s high of 4578 held, the index would be comfortably above the ceiling, but bulls were unable to hang on to it, thereby resulting in a weekly shooting star.
The index is attempting to break out at a time when metric after metric is yelling ‘overbought’. Intraday Friday, 89 percent of S&P 500 stocks were above the 50-day; historically, this metric tends to peak in the low-90s (more on this here).
Immediately ahead, there is decent support at 4450s. After that comes the make-or-break 4320s, which the S&P 500 broke out of on June 12, followed by a successful retest on June 26.
Euro: Currently net long 178.8k, up 38.7k.
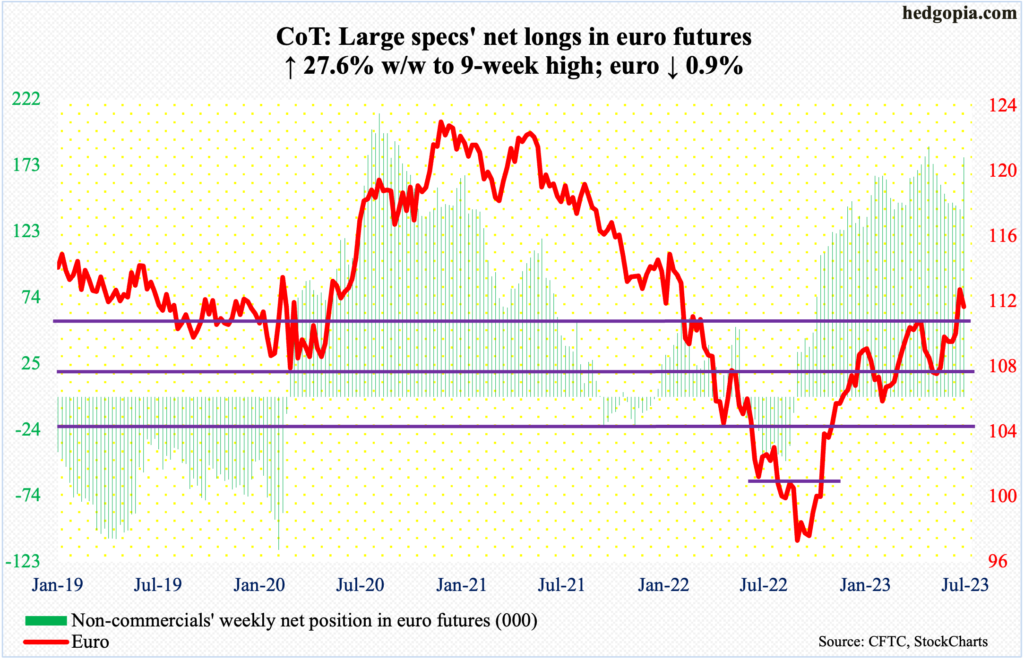
Last week, after hammering on $1.09-$1.10 several times since April, the euro broke out. This week, bulls did build on this early on, rallying past last week’s high of $1.1250 and tagging $1.1270 intraday Tuesday, but only to then weaken in subsequent sessions, ending the week at $1.1128.
The currency has come a long way since last September’s low of $0.9559 – and $1.0635 in late May. Odds favor a breakout retest ahead at $1.09-$1.10.
Several times in the past, the euro has tended to come under pressure as soon as the weekly RSI entered 70, or thereabouts. The metric closed last week at 70.24 and this week at 63.83; if the euro’s move since last September is real, the weekly RSI needs to stay above the median.
Gold: Currently net long 193.3k, up 27.6k.
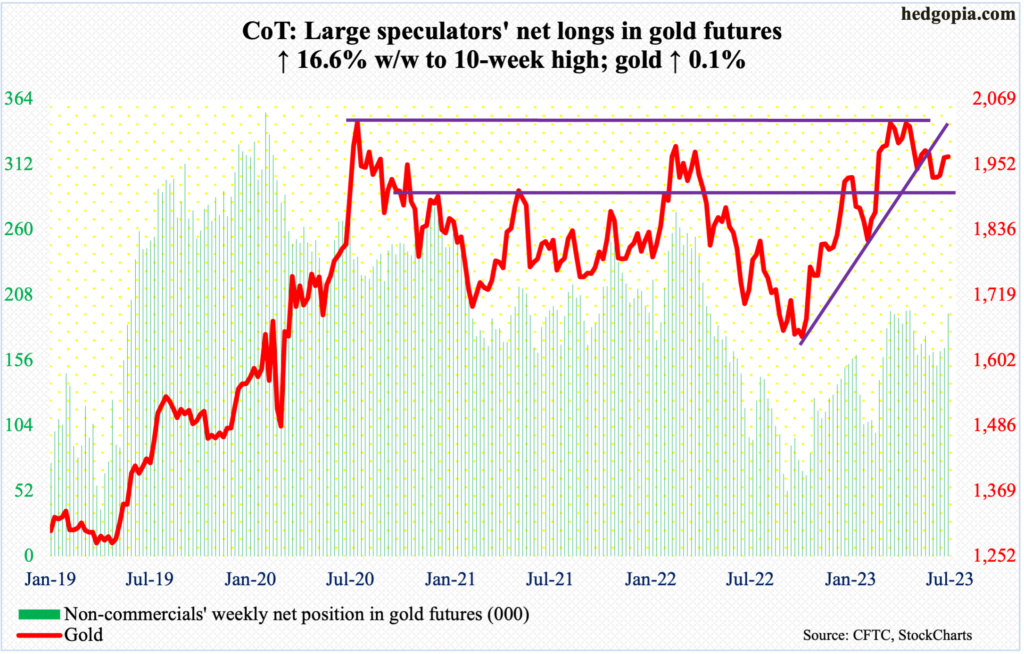
After remaining under the 50-day for a couple of months, the average was reclaimed on Tuesday. Gold rose as high as $1,990 on Thursday. But keeping the gains proved difficult, as was staying above the average ($1,963). On Friday, as a matter of fact, gold ($1,967/ounce) lost the average intraday but only to regain – barely – by close.
There is horizontal resistance at $1,980s and it held. This comes after a major failure at $2,080s. On May 4 (this year), in a spinning top session, the metal ticked $2,085 before retreating. In the past, $2,089 was tagged in August 2020 – an all-time high – and $2,079 in March 2022.
There is crucial support at $1,920s.
Nasdaq 100 index (mini): Currently net long 1.2k, down 9.7k.
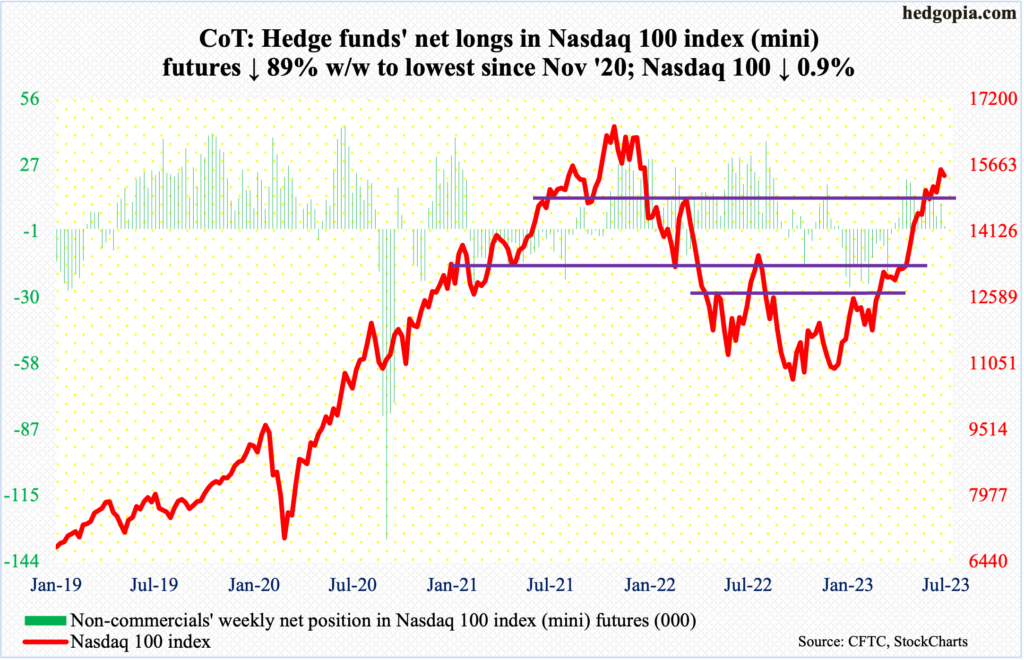
With six sessions of trading left, July is at risk of a monthly candle with a very long upper wick. This would have come after a rip-roaring 52.6-percent surge from last October’s low. On Wednesday, the Nasdaq 100 ticked 15932 but only to end the week at 15426, down 0.9 percent, with the week finishing with a weekly shooting star.
At Wednesday’s high, the Nasdaq 100 was merely 5.2 percent from its record high posted in November 2021. The fact remains that XLK, which is a technology sector SPDR ETF, already took out its high from December 2021 (more on this here).
The Nasdaq 100 suffered on the back of negative post-earnings reaction to June-quarter results from Tesla (TSLA) and Netflix (NFLX). Next week, Microsoft (MSFT) and Google owner Alphabet (GOOG) report on Tuesday and Facebook owner Meta Platforms (META) on Wednesday. Apple (AAPL) and Amazon (AMZN) report the week after on August 3. They have all had strong rallies heading into earnings, and this could very well be a case of ‘buy the rumor, sell the news’.
Immediately ahead, there is short-term support at 15280s.
Russell 2000 mini-index: Currently net short 65.7k, down 171.
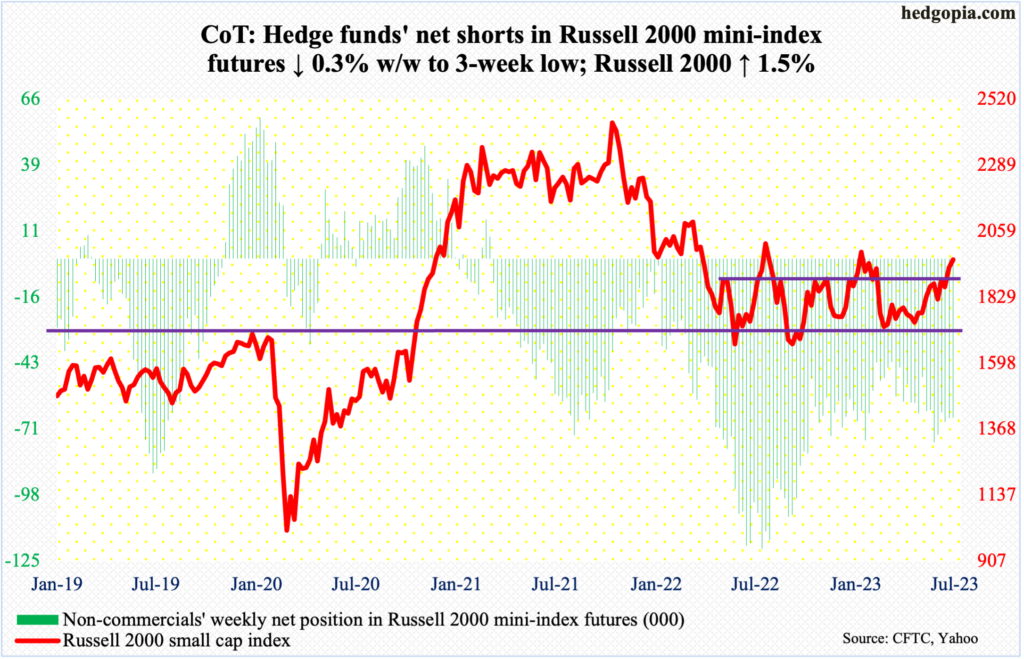
The Russell 2000 ran out of steam before testing the February high. The small cap index peaked in November 2021 at 2459 before suffering a 33.2-percent tumble through June last year when it tagged 1641, which was later matched by October’s 1642. From the June low to August’s high of 2017, it quickly rallied 22.9 percent before momentum petered out. It later made a lower high of 2007 in February (this year).
On Wednesday, the Russell 2000 printed 1990 before heading south, ending the week at 1960, still up 1.5 percent for the week; the session produced a potentially important spinning top.
Two weeks ago – on July 11, to be specific – the Russell 2000 broke to the upside, reclaiming 1900. Since January last year, the index has been rangebound between 1700 and 1900, with false breakouts in August and February. A retest probably lies ahead. Whether or not small-cap bulls will be able to defend will be telling.
US Dollar Index: Currently net long 11.1k, down 944.
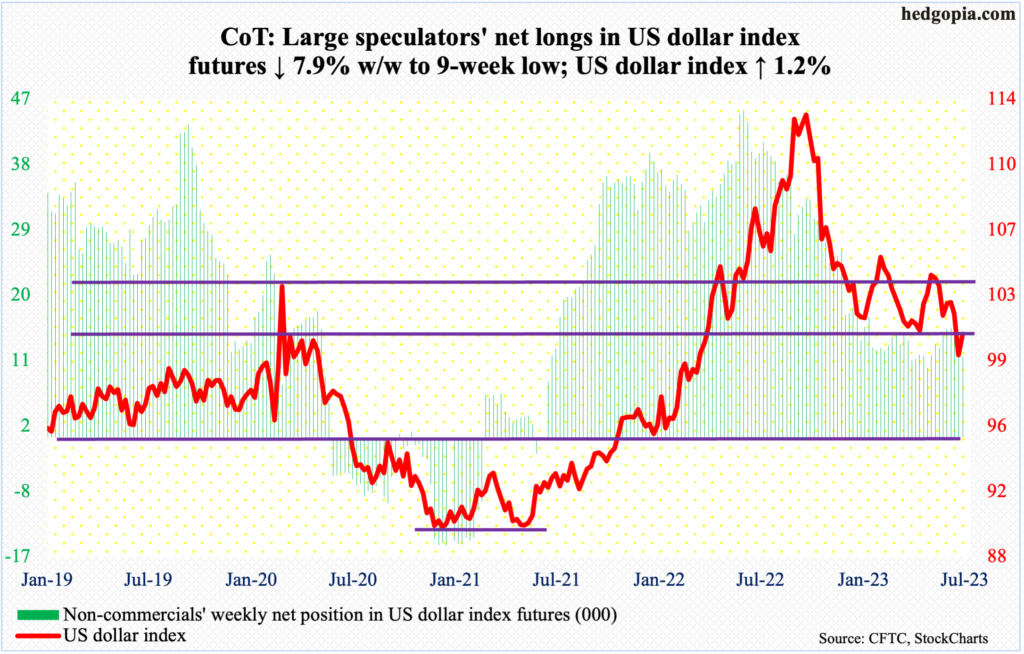
No sooner did dollar bulls lose horizontal support at 100-101, which goes back eight years, last week than they rallied the US dollar index to test the breakdown. This week, it rose 1.2 percent to 100.80.
Earlier, the index last Friday ticked 99.26, which this Tuesday was slightly undercut dropping to 99.22 intraday. Then, it took off, rallying for four sessions.
It is possible the US dollar index shows some hesitancy around here, but the path of least resistance is higher – toward 103-104.
VIX: Currently net short 40.3k, down 10.4k.
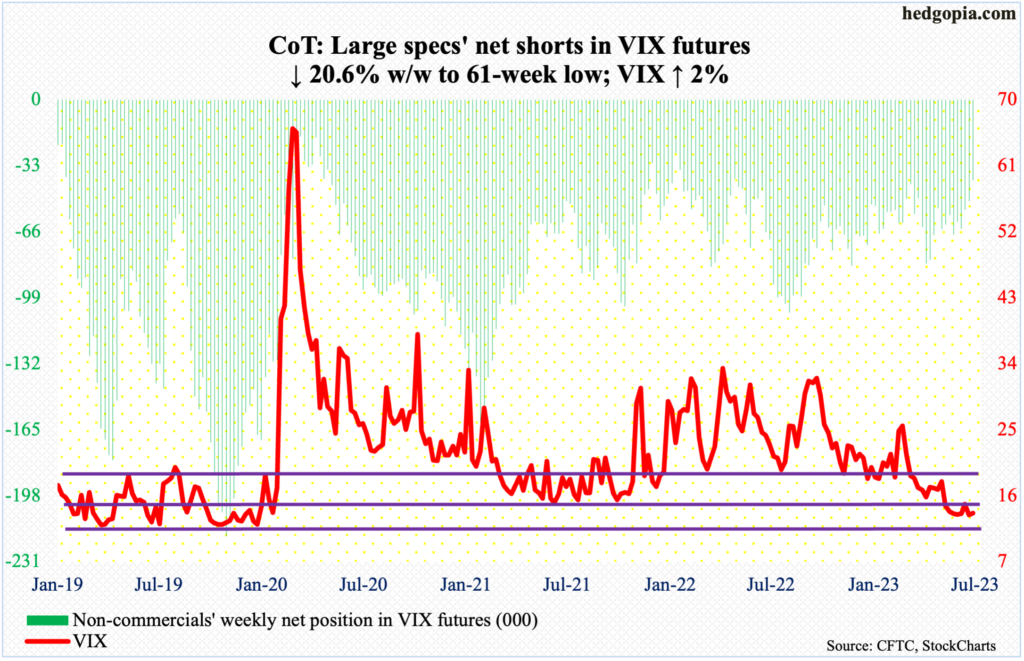
VIX rose two percent this week to 13.60, as did the S&P 500. Ordinarily, the two tend to go in the opposite direction. The volatility index has refused to break 13 on a sustained basis, going sideways just above 13 the last five weeks.
On the daily, Bollinger bands have narrowed. This in general precedes a sharp more – either up or down – when all that suppressed energy gets released. Volatility is very suppressed currently; if there is a sharp move, it will probably be to the upside.
It is possible non-commercials are anticipating this. Their net shorts in VIX futures are at a 61-week low. If past is prelude, VIX only peaks once these traders go either net long or get close to doing that.
Thanks for reading!
