
Following futures positions of non-commercials are as of October 3, 2023.
10-year note: Currently net short 733.9k, up 1.9k.

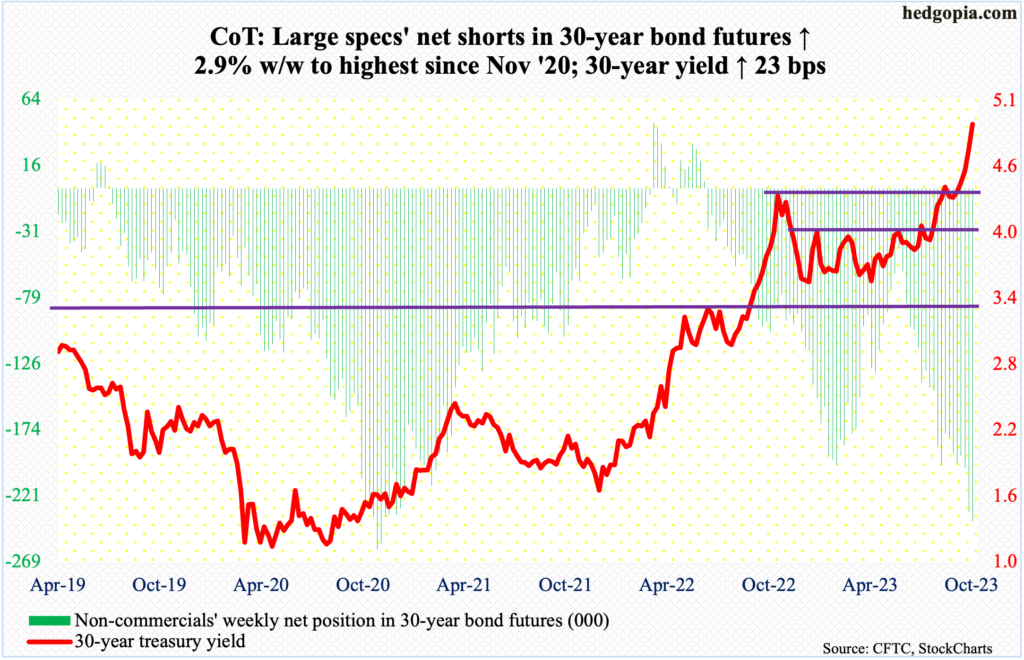
The FOMC minutes for the September 19-20 meeting will be reported on Wednesday. As expected, the fed funds rate was left unchanged at that meeting at a range of 525 basis points to 550 basis points. The rate-setting body did pull up a surprise in that the tone was quite hawkish, with the dot plot indicating that one more hike was possible this year. Two more FOMC meetings remain this year – in October/November and in December. Further, for next year, FOMC members were now expecting two cuts, which is two fewer than June’s dot plot indicated.
Given this hawkish tilt, the minutes probably are not going to contain any new market-moving information. More important perhaps is the fact that futures traders continue not to buy into the Fed’s message. In their eyes, the benchmark rates peaked with the July hike and that they expect three 25-basis-point cuts next year to a range of 450 basis points to 475 basis points. If there is one more hike either in November or December, this would mean a full 100-basis-point cut next year.
In other words, there is a wide gap between what the markets expect and where the Fed is. Not even Friday’s much-better-than-expected jobs report for September convinced these futures traders to adjust their rates outlook. Next week’s minutes will definitely not do that.
30-year bond: Currently net short 239.6k, up 6.8k.
Major US economic releases for next week are as follows.
The NFIB Optimism Index (September) will be reported on Tuesday. Small-business optimism fell six-tenths of a point month-over-month in August to 91.3. Job openings declined a couple of points to 40, matching February 2021’s reading; the all-time high of 51 was hit twice – in September 2021 and May 2022.
The producer price index (September) is due out Wednesday. On a year-over-year basis, headline and core wholesale prices in August rose 1.6 percent and 2.1 percent respectively.
Thursday brings the consumer price index (September). In the 12 months to August, headline and core CPI increased 3.7 percent and 4.4 percent, in that order. They respectively peaked last year at 9.1 percent (June) and 6.6 percent (September).
The University of Michigan’s consumer sentiment index (October, preliminary) is scheduled for Friday. In September, consumer sentiment dropped 1.4 points m/m to 68.1 – a three-month low. In June last year, sentiment hit a record low 50, subsequently reaching 71.6 this July.
WTI crude oil: Currently net long 394.8k, up 6.6k.
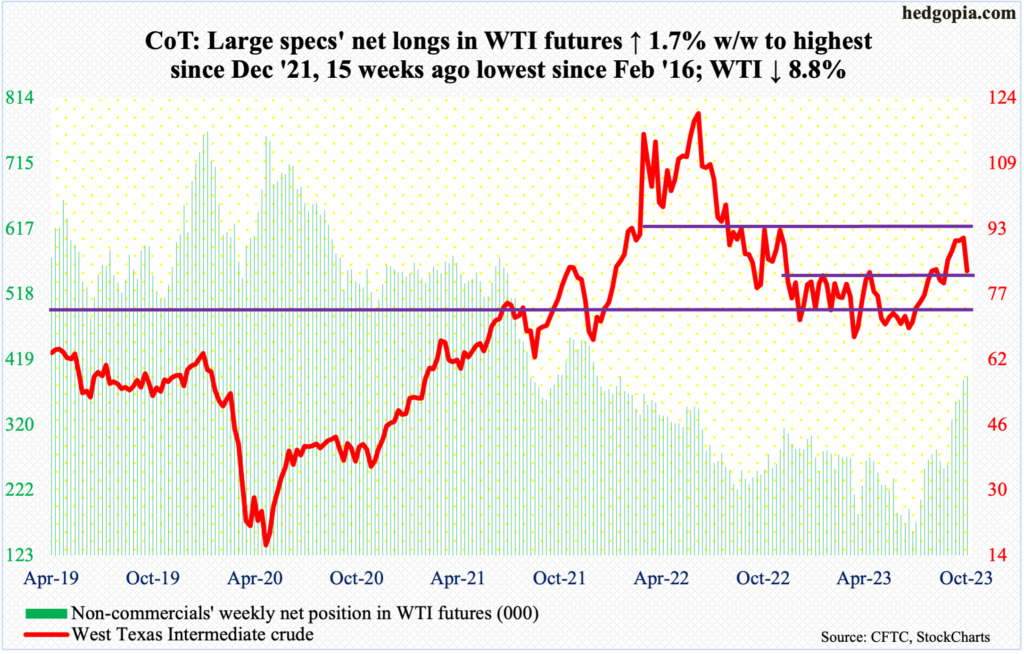
After giving out signs of fatigue for a couple of weeks, West Texas Intermediate crude tumbled 8.8 percent this week to $82.79/barrel.
Last week, the crude rallied as high as $95.03 before ending at $90.79, forming a weekly long-legged doji. Before that, a weekly spinning top formed. There is decent resistance at $93-$94. In late June, the crude tagged $67.05, so has risen a lot.
This week’s tumble puts WTI right on the top of a range that it had broken out of in late August. Before that breakout, it was rangebound between $71-$72 and $81-$82 for 10 months.
Friday’s drop to $81.50 was bought. The daily is beginning to get oversold. A possible rally likely draws sellers at $84-$85, which is where the 50-day moving average ($84.87) lies.
In the meantime, as per the EIA, US crude production in the week to September 29th was unchanged for the fourth week in a row at 12.9 million barrels per day, which is the highest since the week to April 17th, 2020. Crude imports decreased one million b/d week-over-week to 6.2 mb/d. As did stocks of crude and distillates, which respectively declined 2.2 million barrels and 1.3 million barrels to 414.1 million barrels and 118.8 million barrels. Gasoline inventory, however, rose 6.5 million barrels to 227 million barrels. Refinery utilization was down 2.2 percentage points to 87.3 percent – a 30-week low.
E-mini S&P 500: Currently net short 73.2k, down 16k.
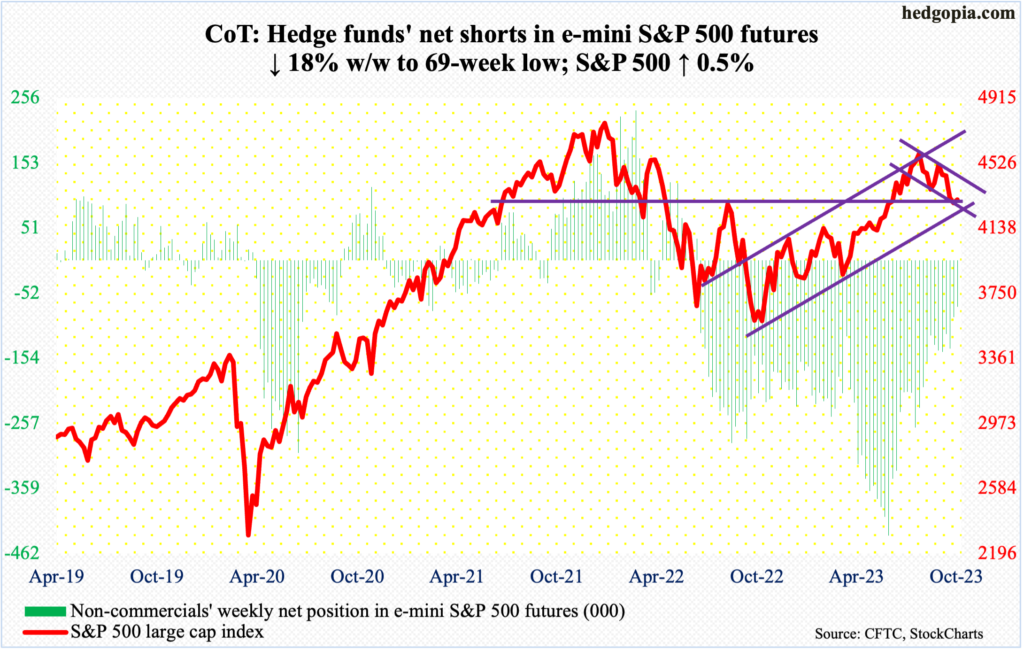
Equity bulls are not in a mood to let go of dual channel support as well as the 200-day (4208). After going sideways just above the average Tuesday through Thursday, the S&P 500 lifted off it on Friday; the session saw the large cap index reverse from down 0.9 percent intraday to close up 1.2 percent. For the week, it was up 0.5 percent to 4309, forming a weekly hammer.
Besides the 200-day, bulls also defended dual channel support. The S&P 500 gave back 8.5 percent from its July 27th high (4607) through Tuesday’s low (4216), trading within a descending channel from that high. The index is bouncing off the lower bound of this channel, which also lines up with support at an ascending channel from last October’s low.
Horizontal support at 4320s was breached two weeks ago, and this needs to give way; Friday’s action suggests it is just a matter of time before that happens (more on this here). Immediately ahead, a gap from September 21st gets filled at 4400, with channel resistance at 4450s. The 50-day is at 4424.
Euro: Currently net long 78.9k, down 19.5k.
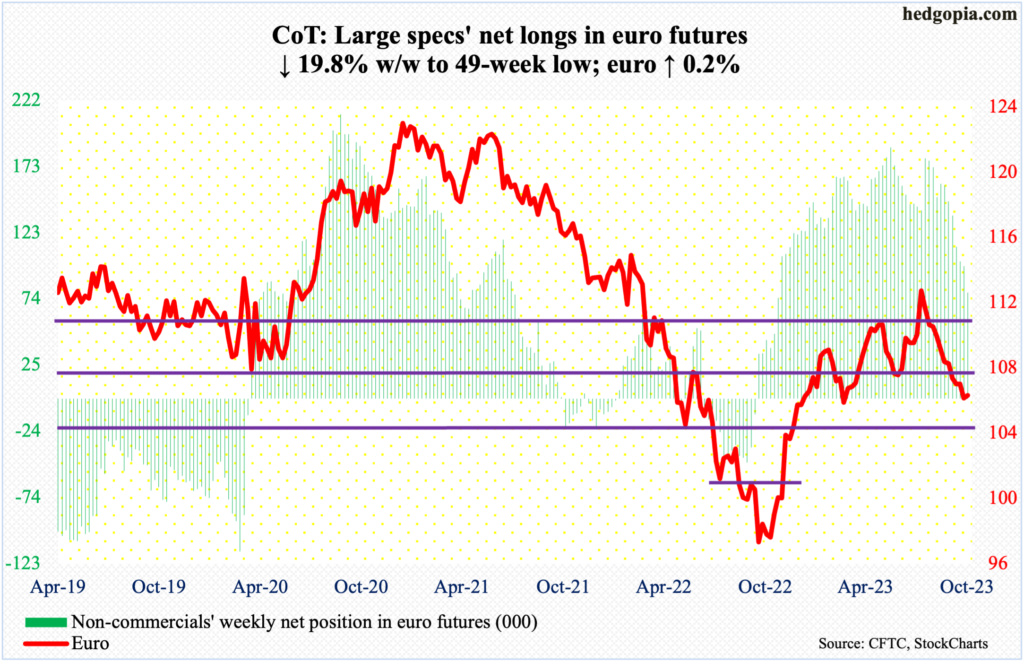
The euro reversed from down 1.2 percent at Tuesday’s low ($1.0448) to edge up 0.2 percent for the week. Before this, it was down in 10 out of 11 weeks. The currency peaked at $1.1270 on July 27th, rising from $0.9559 in September last year.
Lateral support at $1.04-$1.05 goes back to at least March 2015. Odds favor this support holds. On the weekly, both this week and last formed a hammer, which followed a weekly doji three weeks ago.
Immediately ahead, there is support-turned-resistance at $1.0630s. The week closed at $1.0592.
Gold: Currently net long 91.2k, down 24.6k.
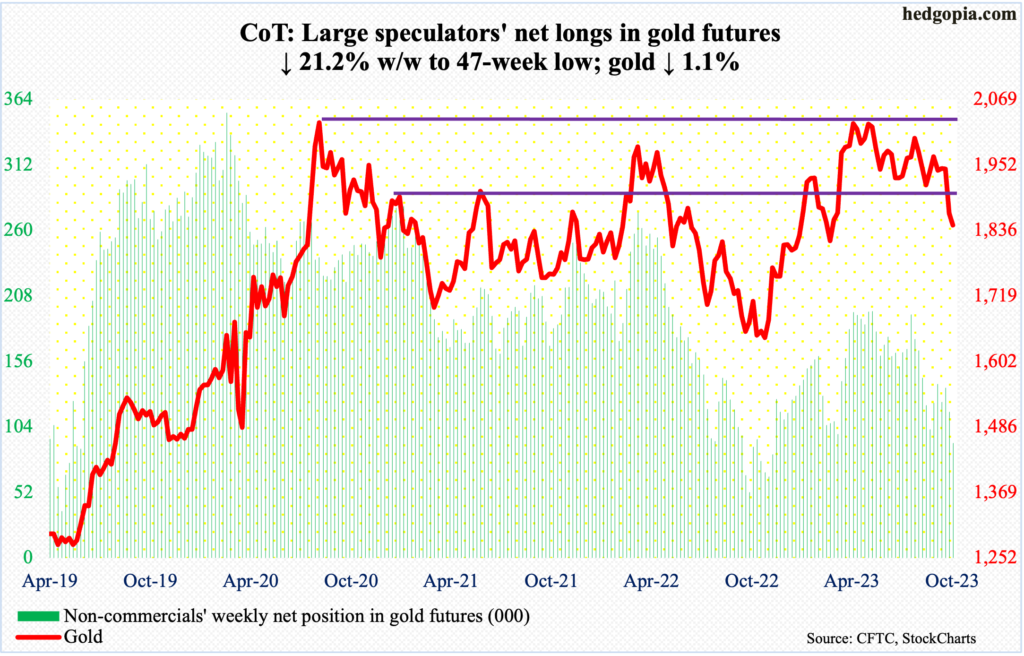
Non-commercials are reducing their net longs in gold futures as fast as they can, with holdings at a 47-week low.
The metal broke down last week, slicing through $1,920s, which held off gold bears for three months. This week, the yellow metal ticked $1,824 intraday Friday but only to end the session/week at $1,845/ounce. This is a must-hold level for gold bugs, and they will probably succeed in doing that – at least for now.
Bulls’ mettle of course will be tested at $1,920s. The 50- and 200-day respectively are at $1,935 and $1,937, with a death cross occurring on Friday.
Nasdaq 100 index (mini): Currently net long 1.4k, up 589.
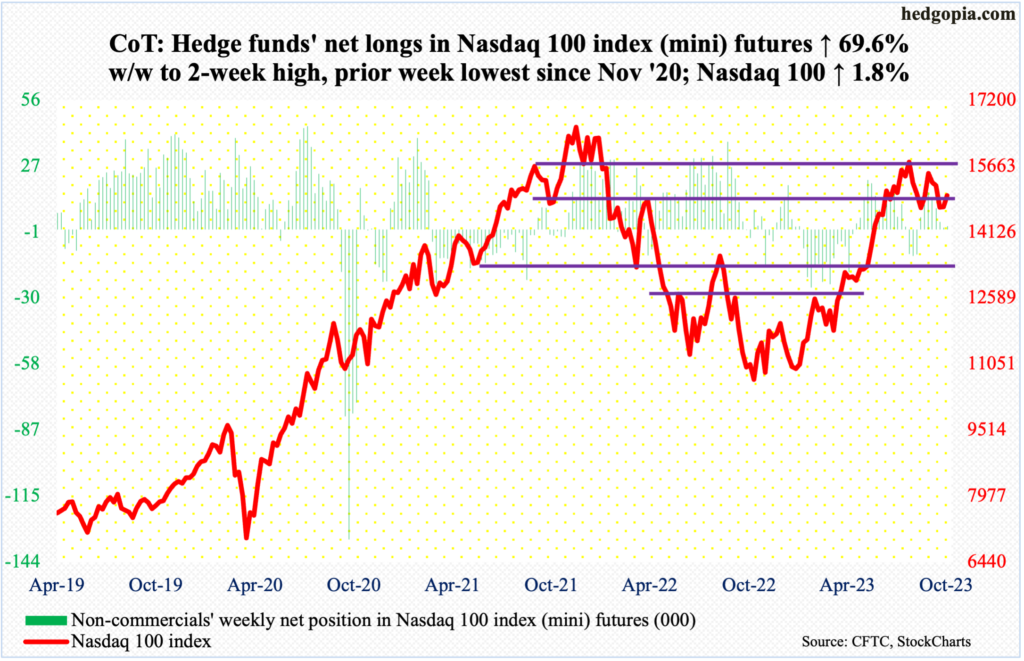
The Nasdaq 100 is itching to rally.
A gap-down from September 21st would have filled at 14960s, and that has happened. Friday’s 1.7-percent rally not only took care of that gap, but the index (14973) also managed to rally past shorter-term moving averages. Next up is the 50-day at 15110. After that lies trendline resistance at 15300s from July 19th when the tech-heavy index retreated at 15932.
Russell 2000 mini-index: Currently net short 63.3k, up 1.7k.
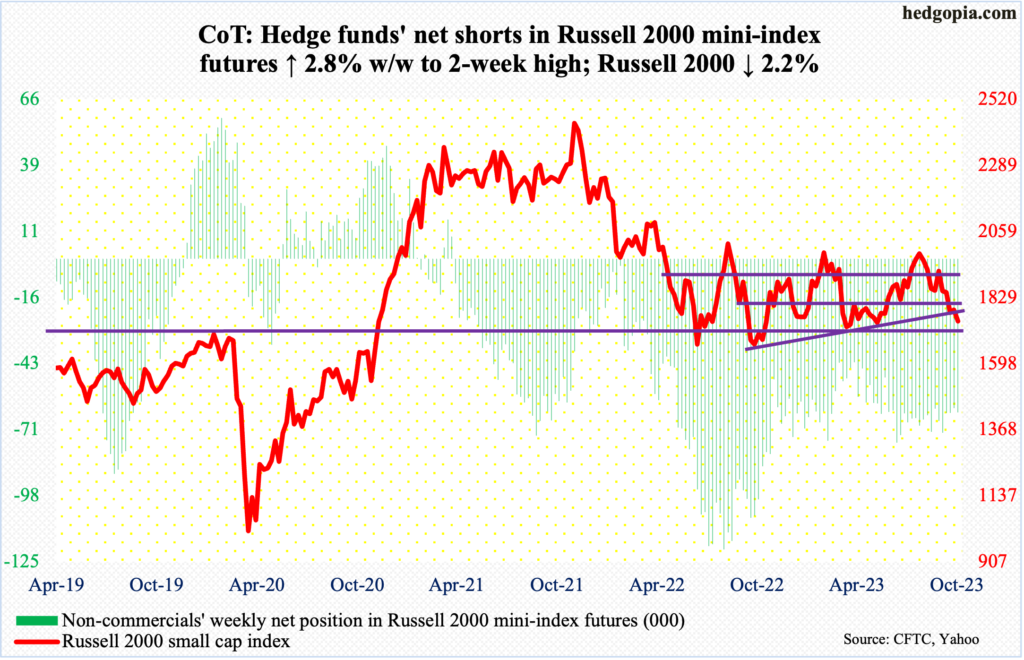
The Russell 2000 was a gross underperformer this week – down 2.2 percent. In contrast, the S&P 500 was up 0.5 percent and the Nasdaq 100 1.8 percent.
Nevertheless, small-cap bulls probably are not too unhappy about how the week ended.
The Russell 2000 two weeks ago breached the neckline of a head-and-shoulders pattern at 1800; if the pattern completes, downside risk is toward 1600. For that to happen, bears first needed to reclaim 1700, which constitutes the bottom of a 200-point range the Russell 2000 has been in since January last year.
This week, the index fell as low as 1710 on Wednesday, and this was bought. This was also the case with the intraday lows on Thursday and Friday. The index finished the week at 1746. Once 1750s, which represent a broken trendline from last October’s low, get recaptured, the path opens up toward at least 1800.
US Dollar Index: Currently net long 18.8k, up 2.1k.
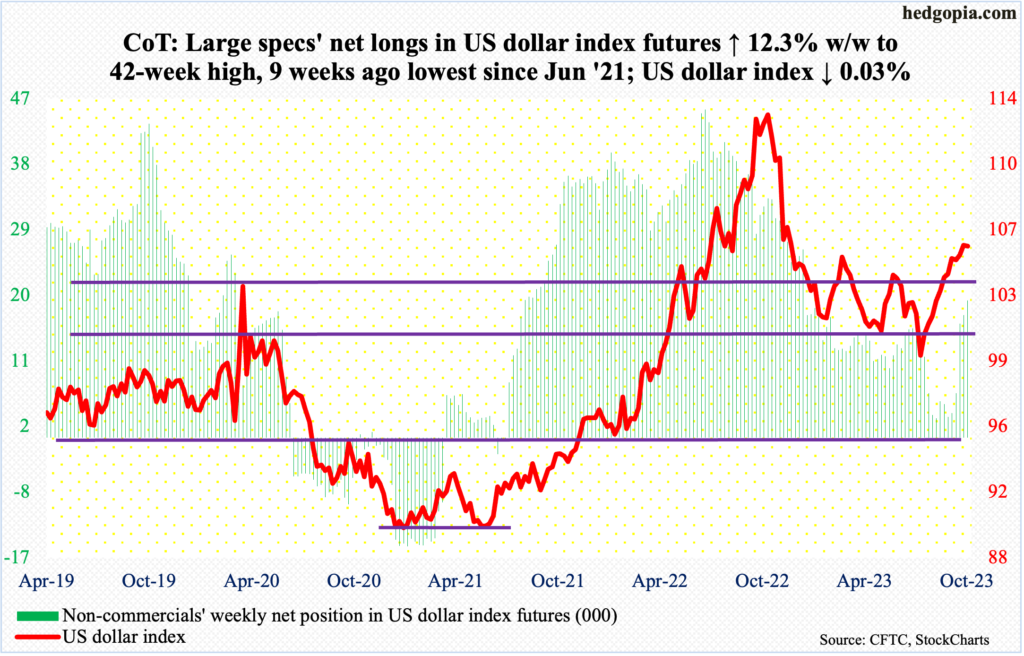
Last week’s weekly shooting star was not that clean, this week’s is. From up 1.2 percent at Tuesday’s long-legged doji high of 107.05, the US dollar index ended this week essentially unchanged – down 0.03 percent – to 105.78.
Earlier, the index bottomed at 99.22 on July 18th, having peaked last September at 114.75. As things stand, it is probably headed for breakout retest at 104, a level that has proven to be important going back several years. The 50-day rests at 104.17.
There is minor support at 105.10s.
VIX: Currently net short 34.2k, down 18.6k.
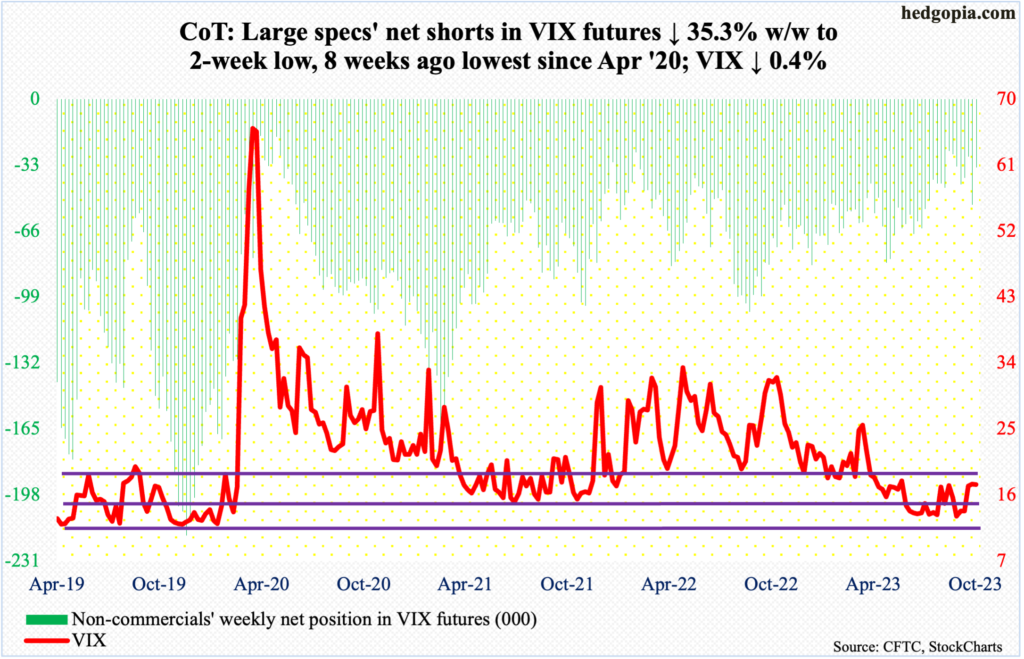
On Wednesday, VIX rallied as high as 20.88, but volatility bulls were unable to hang on to that high, reversing hard to end the session at 18.58. The remaining two sessions also saw candles with long upper wicks.
In the end, the week produced a gravestone doji, followed by last week’s spinning top.
VIX acts like it wants to go lower for now. This week’s candle reeks of a spike reversal.
In the meantime, the CBOE equity-only put-to-call ratio has pushed further into deep overbought territory. If past is prelude, unwinding of this helps equity longs (more on this here).
Thanks for reading!
