
Following futures positions of non-commercials are as of October 24, 2023.
10-year note: Currently net short 563.4k, down 147.4k.
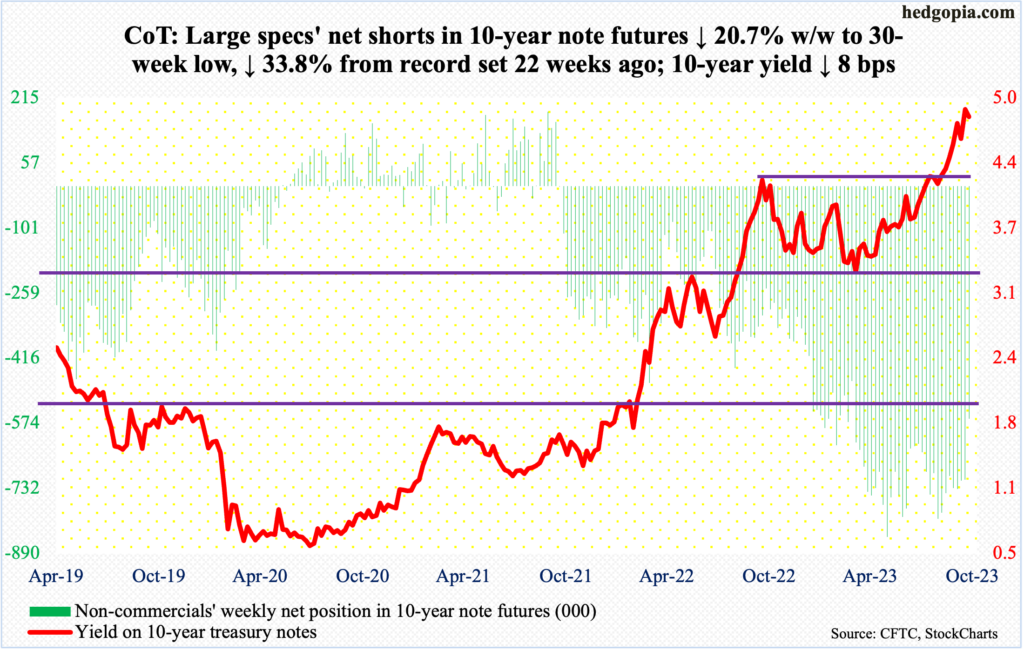
The FOMC meets next week. After this, there is only one scheduled meeting left this year – on December 12-13.
The futures market expects no hike next week. This is in line with a nod and a wink from several FOMC members in recent weeks. The fed funds rate currently lies at a range of 525 basis points to 550 basis points, up from zero to 25 basis points in March last year when the tightening campaign began.
At this stage of the cycle, the Federal Reserve likely hits the pause button soon, with the upside risk of one more hike – if that. The question then centers around when they will start easing. The central bank has made amply clear it would like to leave rates elevated longer than currently priced in. In the futures market, traders are betting this will begin as soon as June next year, ending 2024 between 450 basis points and 475 basis points. The Fed is nowhere near that.
If Jerome Powell, Fed chair, and the post-meeting statement stick to the status-quo language of ‘higher for longer’, then futures traders will once again come under pressure to readjust their expectations, which they have already done several times. Until a few months ago, they were expecting the easing cycle to begin much sooner and the benchmark rates to end 2024 under four percent. Kudos to Powell and his team for doggedly refusing to yield under pressure.
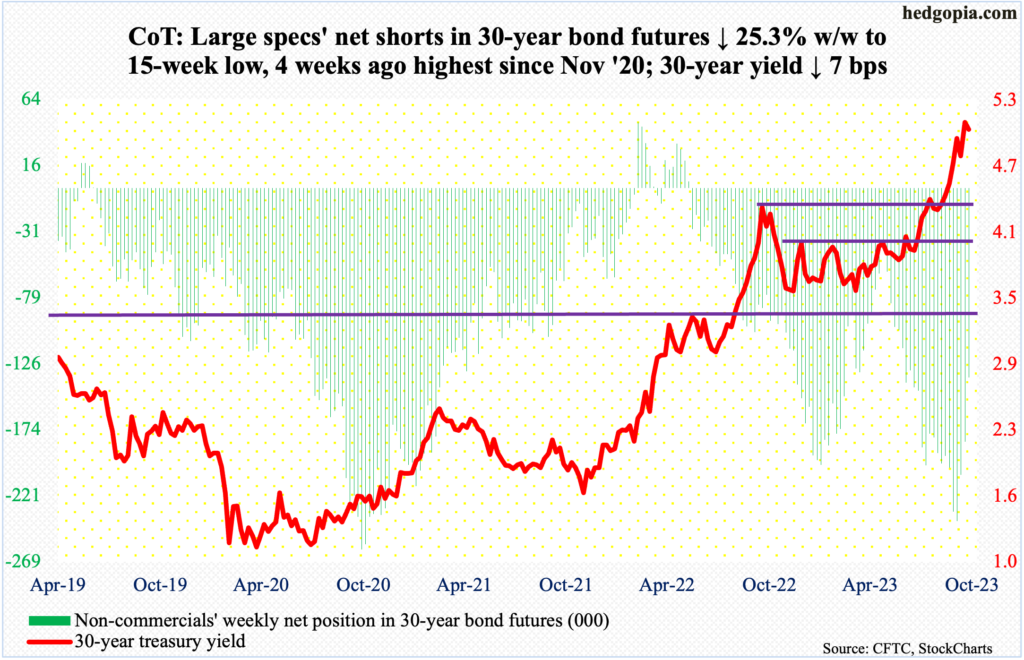
30-year bond: Currently net short 136.2k, down 46.2k.
Major US economic releases for next week are as follows.
The employment cost index (3Q23) and the S&P Case-Shiller home price index (August) are due out Tuesday.
In 2Q, private-industry total compensation rose 4.5 percent from the corresponding quarter last year. The rate of growth has decelerated every quarter since compensation increased at a rate of 5.5 percent in 2Q22, which was the highest since 2Q84.
Nationally, home prices inched up 0.98 percent year-over-year in July. The metric peaked at a record 20.8 percent in March last year.
On Wednesday, the ISM manufacturing index (October) and JOLTs job openings (September) will be reported.
Manufacturing activity in September increased 1.4 percentage points month-over-month to 49 percent. This was the 11th month in a row of sub-50 activity.
August non-farm job openings were 9.61 million, up 690,000 from July. Openings peaked at 12 million in March last year.
On tap for Thursday is labor productivity (3Q23) and durable goods orders (September, revised).
From a year ago, output per hour rose 1.3 percent in the June quarter. This comes on the heels of five consecutive quarters of contraction y/y.
September’s advance report showed orders for non-defense capital goods ex-aircraft – proxy for corporate capex plans – grew 0.6 percent m/m to a seasonally adjusted annual rate of $74.5 billion, which is a new record.
Friday brings payroll (October) and the ISM services index (October).
For the first time in eight months in September, non-farm jobs grew with a three handle. In the first nine months this year, an average of 260,000 jobs was created, versus a monthly average of 399,000 last year and 606,000 the year before.
Services activity decreased nine-tenths of a percentage point m/m in September to 53.6 percent. Barring a sub-50 reading last December, non-manufacturing activity has remained above 50 the last nine months.
WTI crude oil: Currently net long 298.7k, down 2.4k.
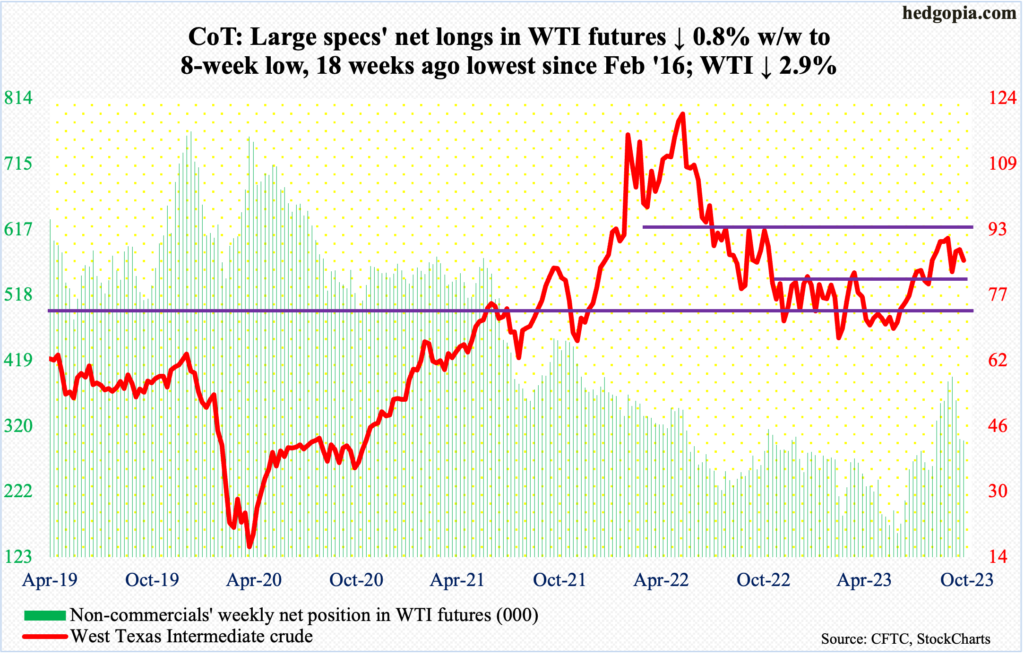
West Texas Intermediate crude had another wide-ranging week, with a high of $88.29 on Monday and a low of $82.08 on Wednesday, closing at $85.54. The weekly low was a successful retest of a range breakout in late August, when it broke out of a 10-month range between $71-$72 and $81-$82.
By the end of the week, the crude finished just under the 50-day moving average at $86.07. In the current circumstances, $81-$82 should continue to attract bids. In this scenario, there is short-term resistance at $88. WTI peaked at $95.03 on September 28th.
In the meantime, as per the EIA, US crude production in the week to October 20th remained unchanged for three weeks in a row at 13.2 million barrels per day, which is a record; this preceded four weeks of sideways move at 12.9 mb/d. Crude imports increased 71,000 b/d to six mb/d. As did stocks of crude and gasoline, which respectively grew 1.4 million barrels and 156,000 barrels to 421.1 million barrels and 223.5 million barrels. Distillates inventory, on the other hand, fell 1.7 million barrels to 112.1 million barrels. Refinery utilization was down five-tenths of a percentage point to 85.6 percent.
E-mini S&P 500: Currently net long 10.2k, up 73.4k.
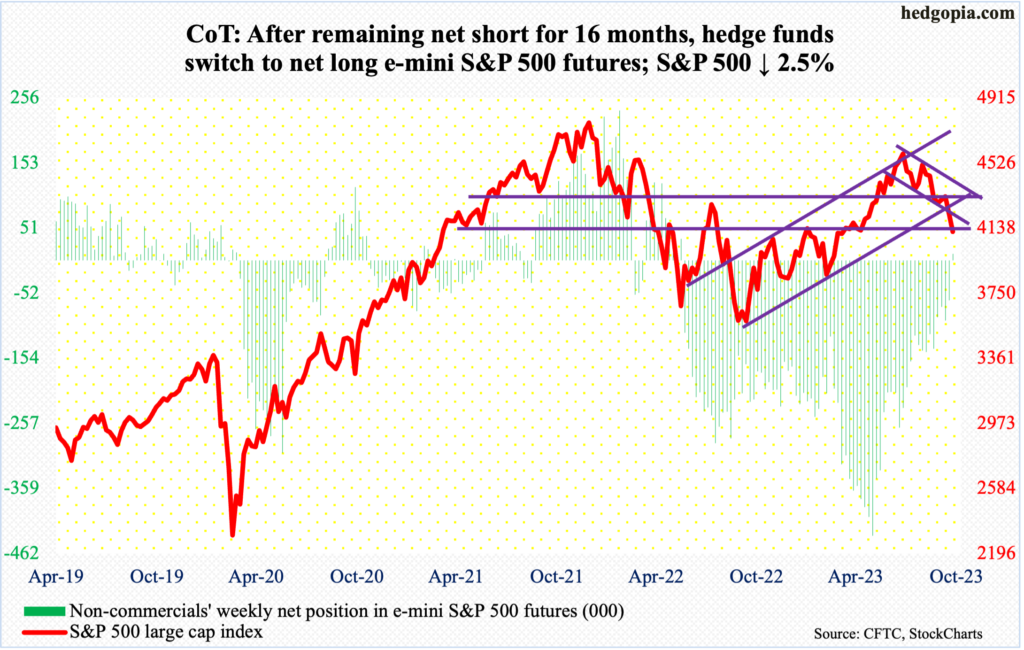
The S&P 500 breached several important levels this week, including dual channel support and the 200-day. Last week, the large cap index just about closed on the lower bound of an ascending channel from last October’s low (3492), which also coincided with the lower bound of a descending channel from this July’s reversal at 4607.
In the end, the index lost 2.5 percent for the week, closing at 4117. There is horizontal support just north of 4100. From the July 27th high through Friday’s low, the S&P 500 is down 10.9 percent. The daily RSI just dipped below 30; early this month when this happened, the index rallied north of four percent in the next two weeks.
In the meantime, non-commercials are no longer net short e-mini S&P 500 futures. After 16 months of uninterrupted bearish bias, they flipped to net long this week.
The 200-day is at 4240.
Euro: Currently net long 85.3k, up 2.8k.
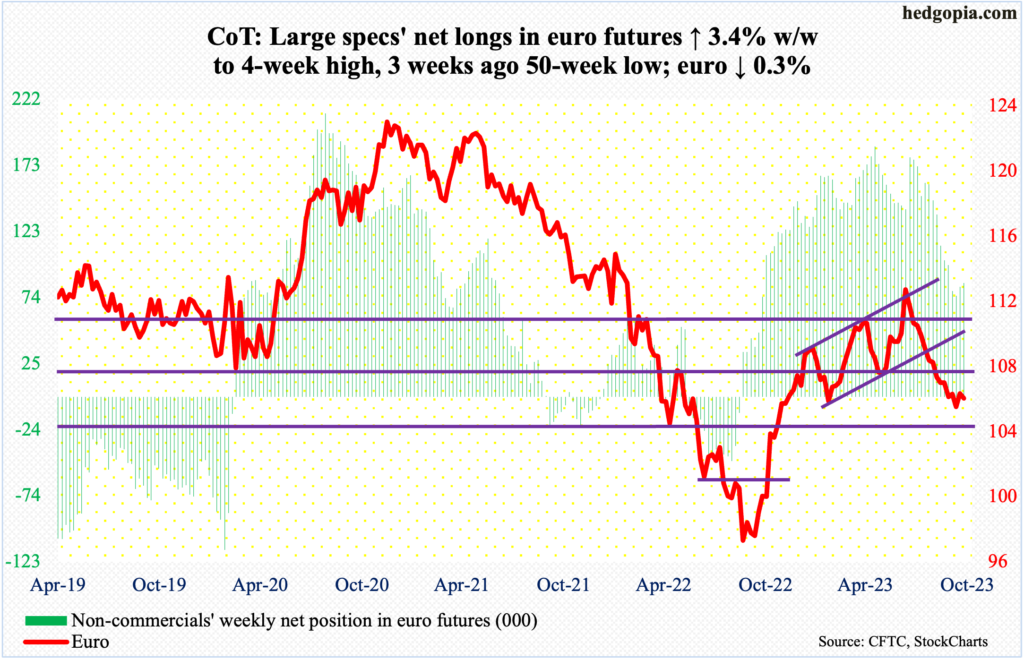
The euro is trying to stabilize after a 7.3-percent drop between the July 18th high and October 3rd low. The low early this month of $1.0448 was a successful test of straight-line support at $1.04-$1.05 that goes back to at least March 2015. But the currency has not been able to rally strongly off that support.
Rally attempts this month repeatedly drew offers at $1.0630s, which was lost on September 25th. This occurred again this week. As a matter of fact, the euro began the week strongly with Monday’s 0.7-percent rally to $1.0669, taking care of $1.0630s resistance, but the momentum only lasted a session; the 50-day was just above. When it was all said and done, it fell 0.3 percent for the week to $1.0564.
As things stand, it is unlikely the euro breaches $1.04-$1.05 soon. Thus, it is only a matter of time before $1.0630s give way.
Gold: Currently net long 149.4k, up 36.6k.
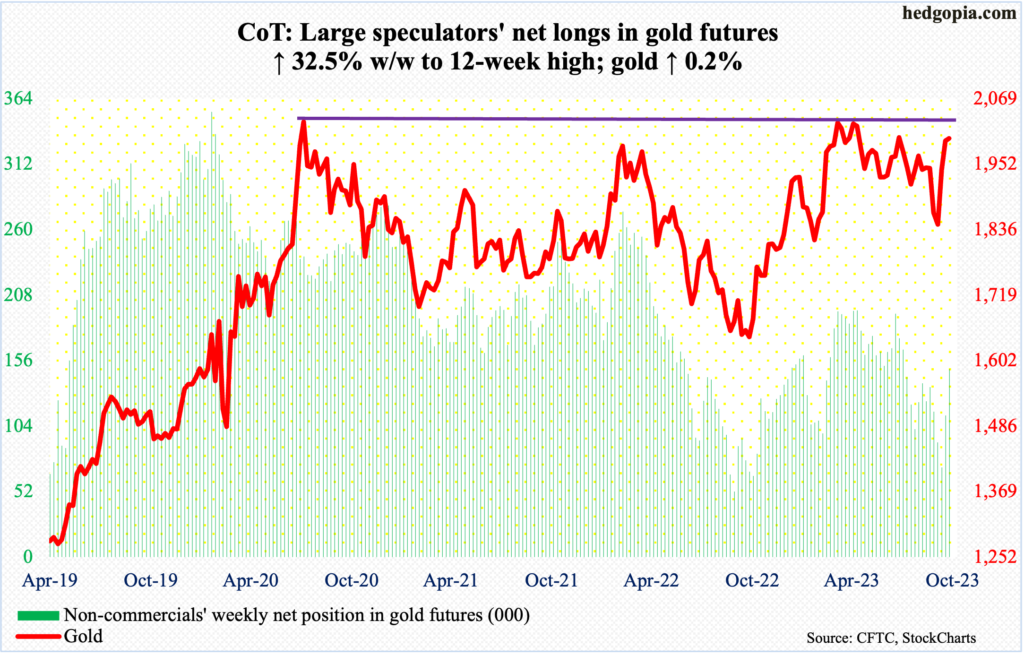
Gold tried to build on the recent momentum when it rallied 2.7 percent last week and 5.2 percent the week before, but scraped by a 0.2-percent gain this week to $1,998.50/ounce. In fact, Friday’s intraday high of $2,019 would have easily surpassed last week’s high, closing above the psychologically important $2k, but gold bugs could not quite pull it off.
The daily is now beginning to get stretched. The yellow metal has failed at $2,080s at least twice since August 2020 when it reached an all-time high of $2,089, with a print of $2,079 in March last year and $2,085 in May this year. Looks like the bulls will have to regroup at a lower level so they can launch another attack at that resistance.
Nasdaq 100 index (mini): Currently net long 2.7k, down 11.7k.
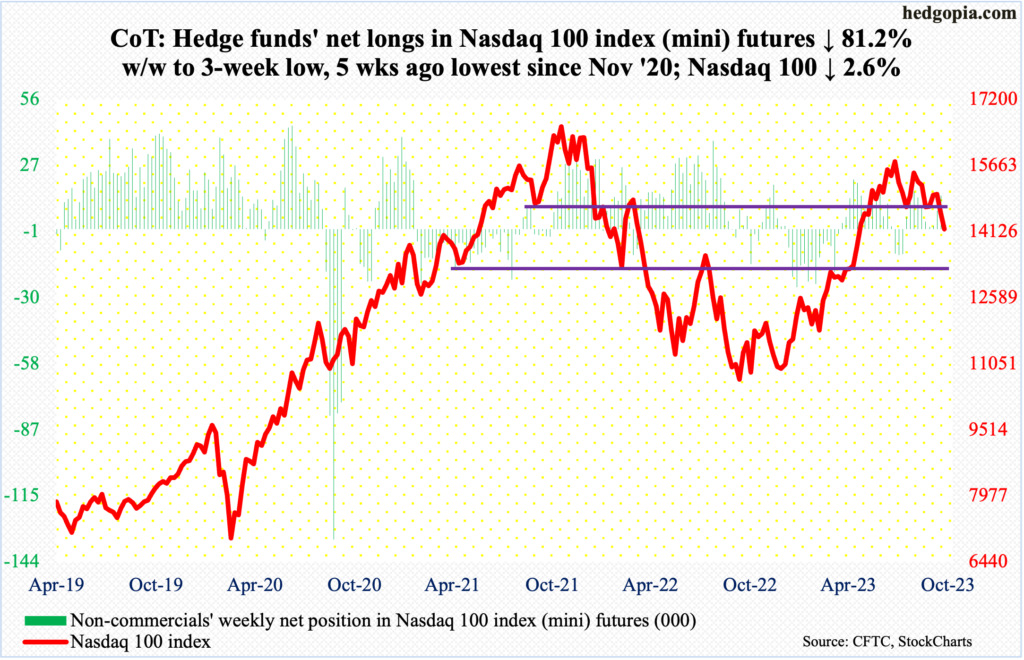
On July 19th, the Nasdaq 100 put in a lower high and retreated – 15932 versus its all-time high of 16765 from November 2021. It then traded within a descending channel, the lower bound of which was breached this week.
September-quarter results from tech behemoths such as Microsoft (MSFT), Google owner Alphabet (GOOG), Facebook owner Meta Platforms (META) and Amazon (AMZN) were not quite able to salvage the wounded tech bulls (more on this here). The Nasdaq 100 was handed out a 2.6-percent punishment this week. Last week, it declined 2.9 percent. From its July high through’s Friday’s low (14058), it is now down 11.8 percent.
Mid- to long-term, more downside pressure is probable. Near-term, there is hope for the bulls. This week’s close of 14180 rests just above the 200-day at 13927. Concurrently, a 38.2-percent Fibonacci retracement of the October 2022-July 2023 rally lies at 13834. This is as good a spot as any for tech bulls to try to put their foot down, with odds heavily in their favor.
Russell 2000 mini-index: Currently net short 44.2k, down 1.3k.
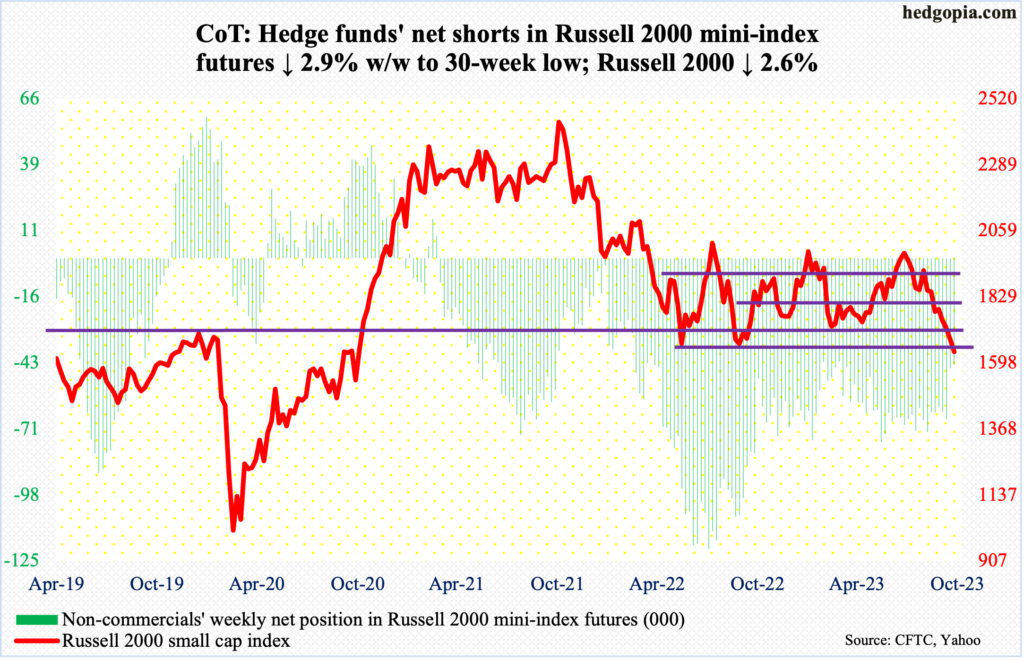
It is a make-or-break moment for small-cap bulls. They have already been on the defensive for a while now.
The Russell 2000 peaked in November 2021. Beginning the following January, the small-cap index pretty much traded within a range between 1700 and 1900. Last June and October, it dropped out of that range but only to find bids waiting at 1640s, which is being tested again.
This week, the index closed at 1637. A convincing breach of 1640s will open the door to 1600, which is where a head-and-shoulders pattern, the neckline of which was broken on September 21st at 1800, will complete (more on this here).
If small-cap bulls put their foot down, nearest resistance of course is 1700, followed by 1800.
US Dollar Index: Currently net long 19.7k, up 504.
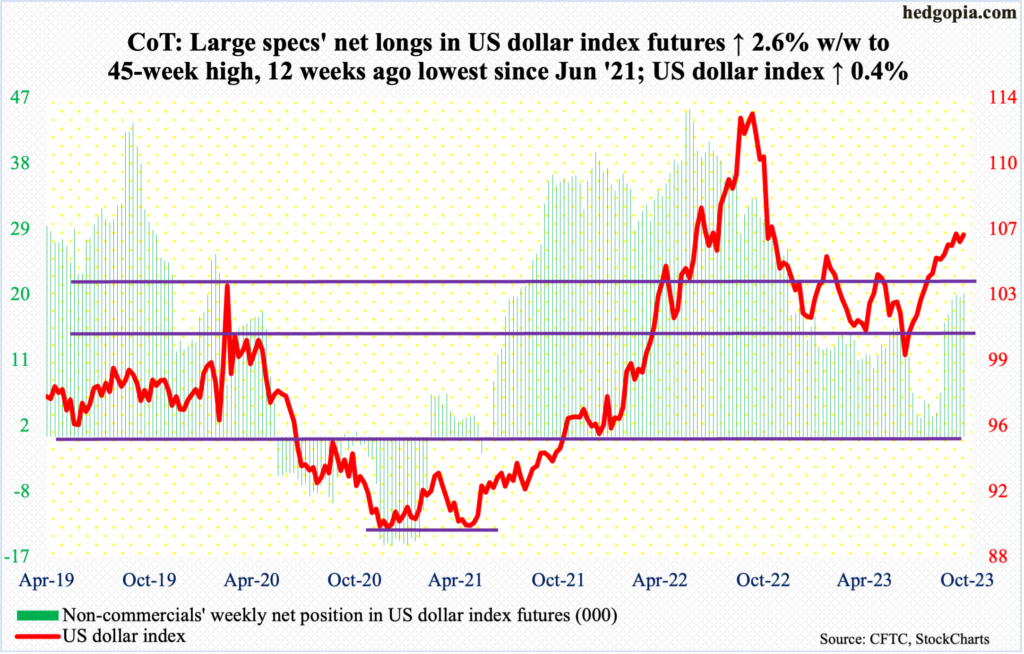
Dollar bulls showed up just above the 50-day on Tuesday with a session low of 105.16. By Thursday’s gravestone doji session, the US dollar index tagged 106.78, followed by a spinning top Friday, ending the week at 106.38. Thursday’s high was not that far away from the October 3rd high of 107.05. Earlier, the index bottomed at 99.22 on July 18th, having peaked last September at 114.75.
For five weeks now, the US dollar index has had a flattish look with the lows congregated around 105.10s and the highs around 106.50s. Either way it breaks, momentum should follow.
VIX: Currently net short 21.6k, down 1.4k.
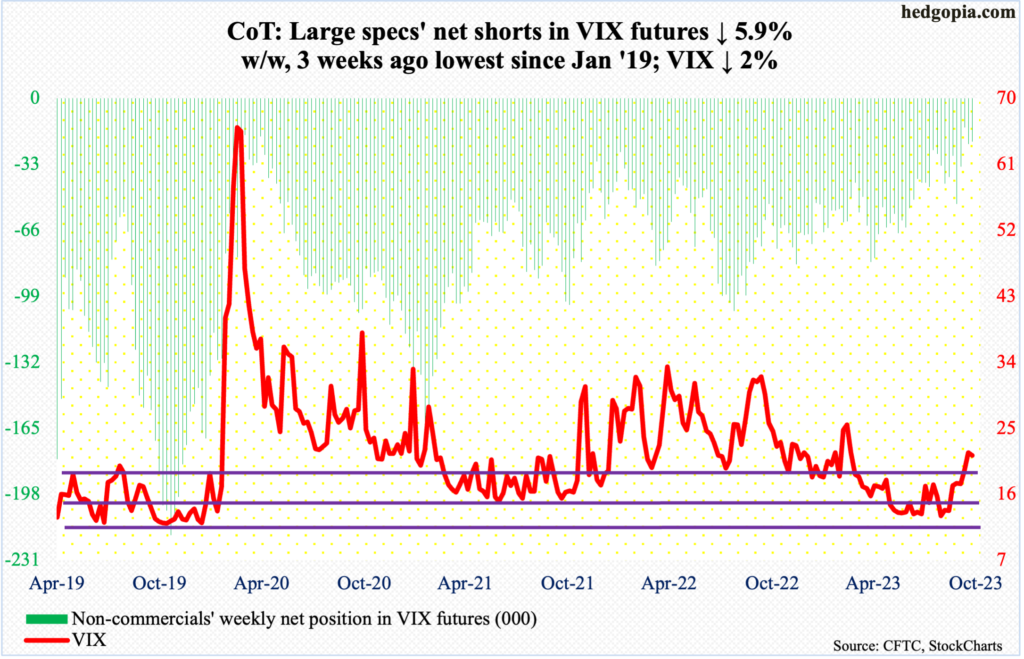
Compared to how the S&P 500 fared, VIX fared poorly. The latter did rally as high as 23.08 on Monday, but only to reverse hard lower. For the week, the volatility index was down 0.44 to 21.27.
If it rallies early next week, unless Monday’s high gets taken out, it is hard to imagine volatility regaining momentum right here and now.
Thanks for reading!
