
Following futures positions of non-commercials are as of February 27, 2024.
10-year note: Currently net short 665.6k, down 63.5k.
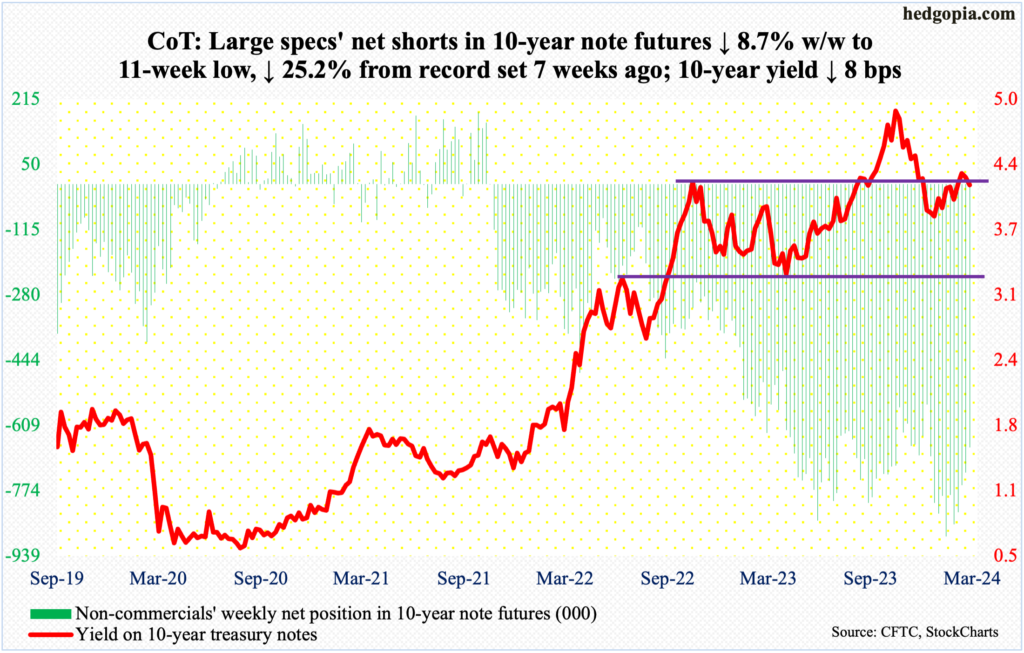
January’s PCE (personal consumption expenditures) price index came out Thursday. Ahead of the report, futures traders were pricing in three 25-basis-point cuts in the fed funds rate this year. Just a few weeks ago, they expected six cuts – even seven a little earlier.
Markets were on pins and needles – not only because the PCE report was the Federal Reserve’s favorite but also because January’s CPI (consumer price index) had come in hotter than expected. The PCE did not, however, with the headline and core rising 2.4 percent and 2.9 percent year-over-year – exactly as expected.
One would think the in-line report would coax the futures traders into once again demanding more than three cuts. But they did not. They remain right in line with what December’s FOMC dot plot telegraphed – three cuts, up from two at the September meeting.
The post-PCE inaction on the part of these traders can be interpreted as a sign they are now considering the possibility that the March dot plot will go back to forecasting two cuts. Most of the economic data have continued to exceed estimates, even as the financial conditions have eased tremendously, owing to massive rallies in equities. In this environment, the Fed probably does not want to further loosen these conditions.
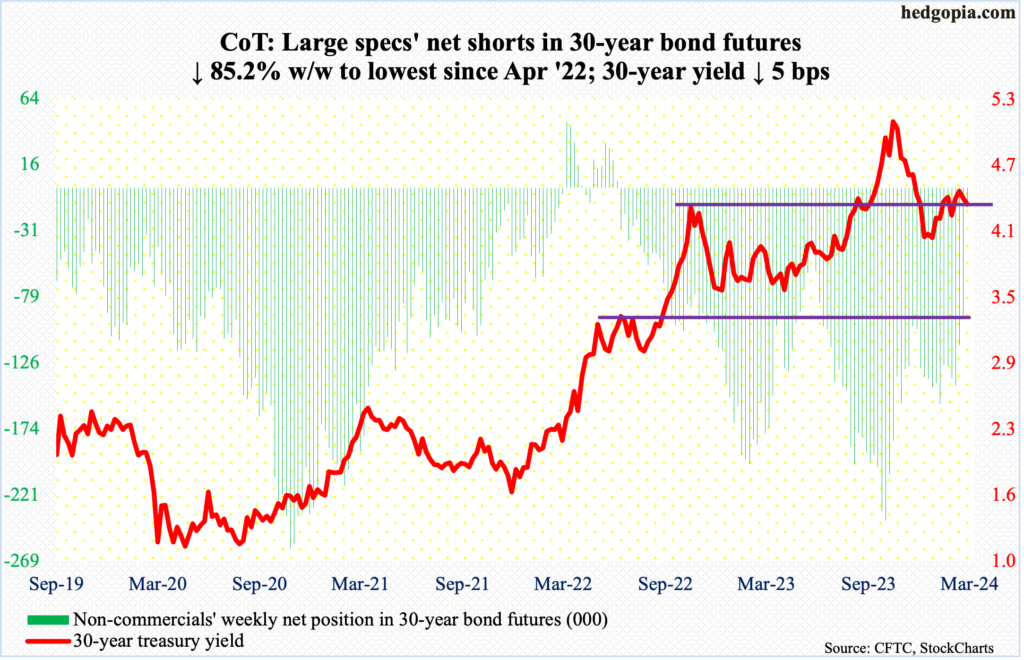
30-year bond: Currently net short 14k, down 80.8k.
Major US economic releases for next week are as follows.
Durable goods orders (January, revised) and the ISM services index (February) are due out Tuesday.
January’s preliminary estimate showed orders for non-defense capital goods ex-aircraft – proxy for business capex plans – inched up 0.1 percent month-over-month to a seasonally adjusted annual rate of $73.7 billion, which is not too far away from last November’s record $74 billion.
In January, non-manufacturing activity jumped 2.9 percentage points m/m to 53.4 percent. This was the 13th consecutive month of expansion after a one-month contraction in December 2022.
Job openings (JOLTs, January) will be out Wednesday. December non-farm openings increased 101,000 m/m to 9.03 million – a three-month high. Openings peaked at 12.03 million in March 2022.
Thursday brings labor productivity (4Q23, revised). Preliminarily, fourth-quarter non-farm output per hour expanded 2.7 percent from a year ago – an 11-quarter high.
Payrolls (February) and the University of Michigan’s consumer sentiment index (February, final) are on deck for Friday.
The year opened with the creation of better-than-expected 353,000 non-farm jobs in January. This followed December’s 333,000.
February’s preliminary estimate showed consumer sentiment rose six-tenths of a percentage point m/m to 79.6 percent, which was the highest since August 2021.
WTI crude oil: Currently net long 274.5k, up 36.8k.
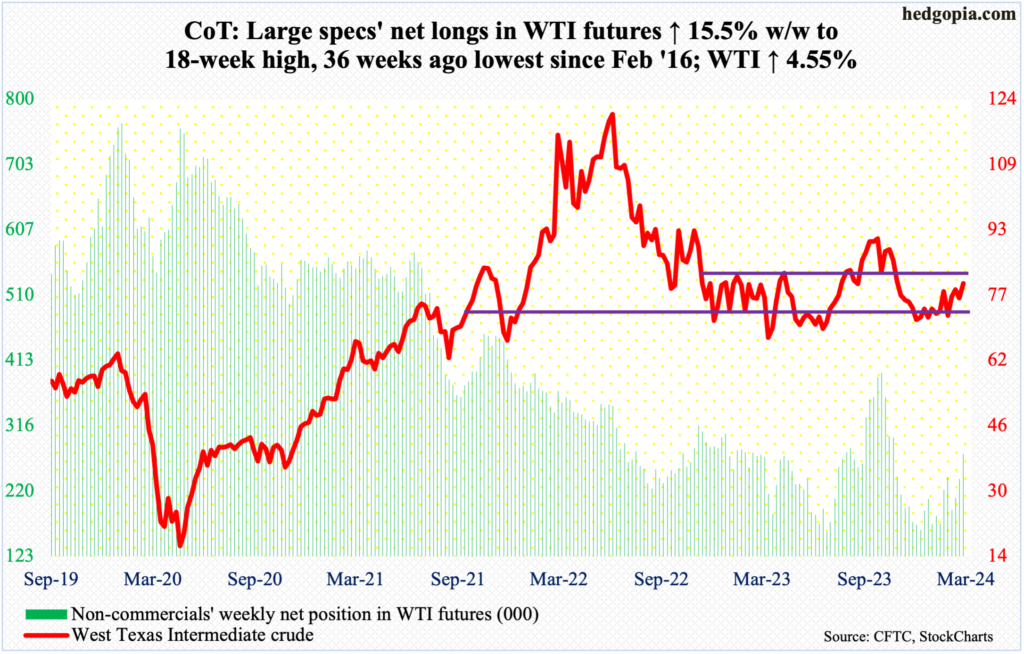
With the daily now looking to unwind its overbought condition, West Texas Intermediate crude unsuccessfully tested the upper bound of a 17-month range between $71-$72 and $81-$82. This was the first time in over three months the top of the range was tested, and it held firm, with Friday tagging $80.85 intraday and closing at $79.97/barrel, up 4.6 percent for the week.
The crude remains just above the 200-day ($77.72). Friday’s session high also kissed the daily upper Bollinger band. A loss of the average in the sessions ahead opens the door toward the lower band.
In the meantime, as per the EIA, US crude production in the week to February 23rd remained unchanged week-over-week for four weeks in a row at 13.3 million barrels per day, which is a record and was first hit in the week to December 15th. Crude imports decreased 269,000 b/d to 6.4 mb/d. As did stocks of gasoline and distillates, which respectively declined 2.8 million barrels and 510,000 barrels to 244.2 million barrels and 121.1 million barrels. Crude inventory, however, grew 4.2 million barrels to 447.2 million barrels. Refinery utilization increased nine-tenths of a percentage point to 81.5 percent.
E-mini S&P 500: Currently net short 224.2k, up 5.7k.
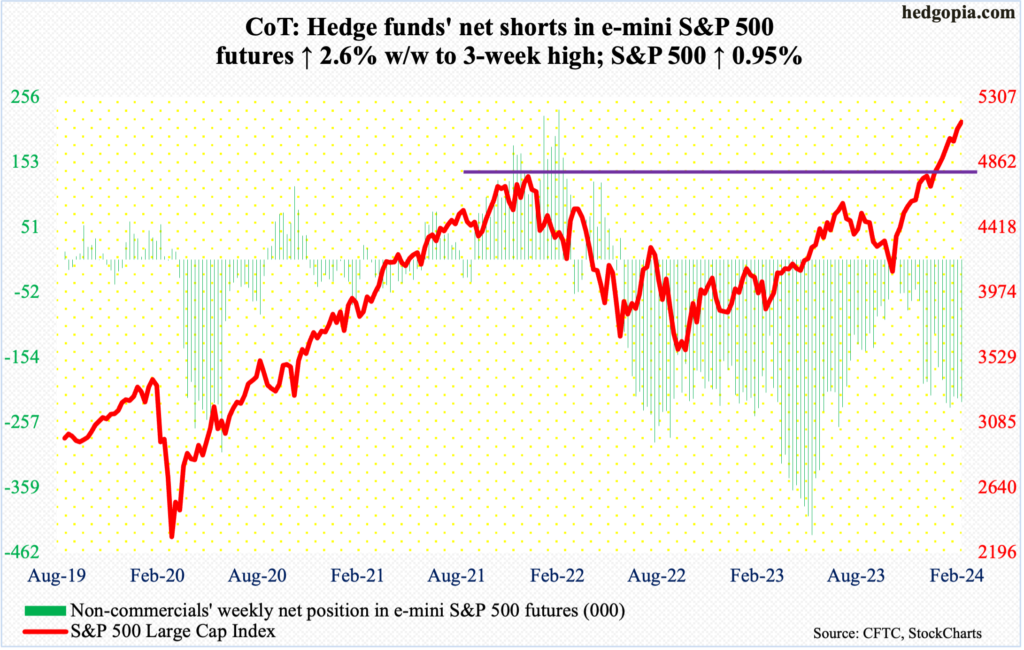
The last time the weekly RSI at 76.82 was as overbought was January 2020, when the S&P 500 then came under slight pressure but only to rally anew to subsequently peak in February, followed by a five-week, 35.4-percent drubbing. The Covid-19 virus was the catalyst back then for the sell-off. For lack of a catalyst, the current frenzy can go on. But the kind of giddy exuberance as is seen today always ends.
The large cap index is up north of 25 percent from last October’s lows. It is up in 16 of 18 weeks. Caution is warranted. Yet, the monthly RSI at 67.33 is yet to hit 70, which the bulls must be eyeing – at least.
Euro: Currently net long 62.9k, down 5.2k.
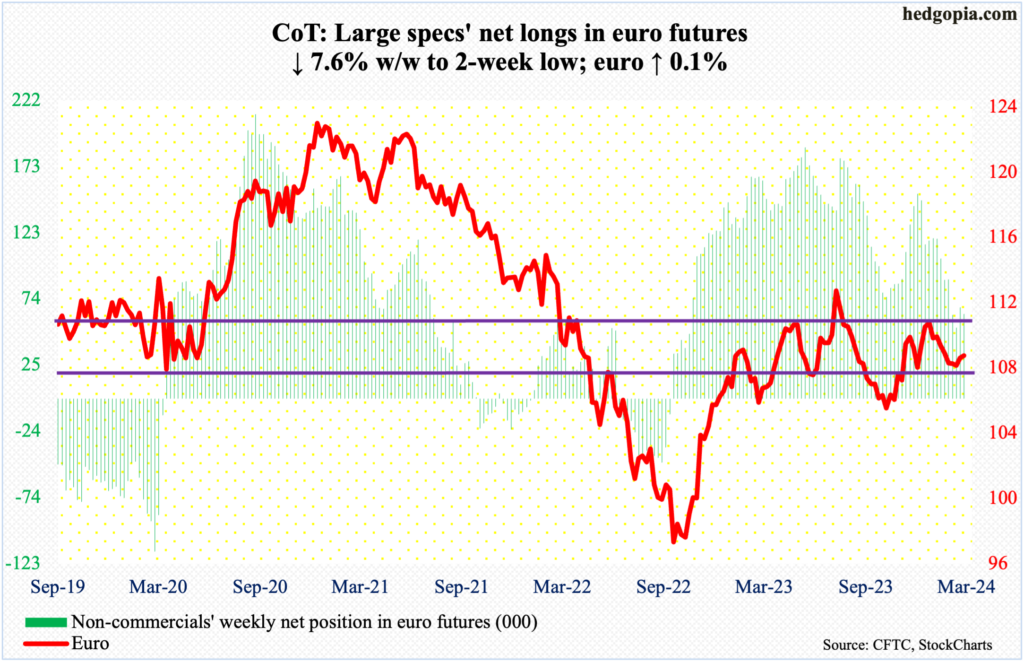
For at least going back to March 2015, $1.07-$1.08 has attracted both bulls and bears. It is happening again. For the last several weeks, the two camps are battling it out for control of the level. As things stand, euro bulls probably have the edge.
This week, the currency edged up 0.1 percent to $1.0836, with a weekly low of $1.0775 on Thursday. Last week, it poked its head out of a descending channel from December 27th when the euro peaked at $1.1125.
Gold: Currently net long 141.6k, up 1.4k.
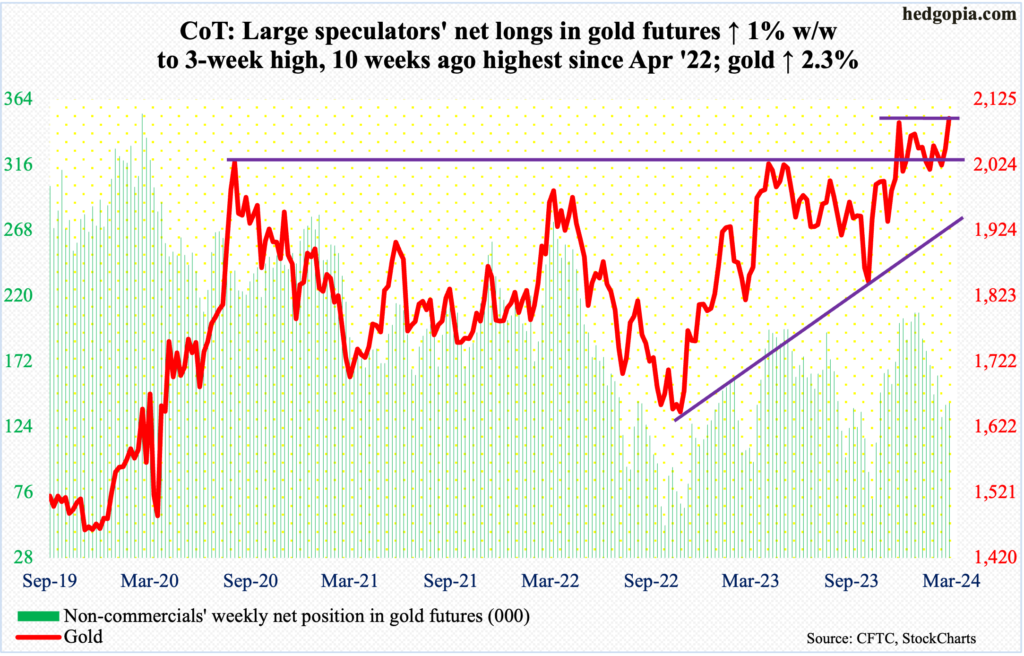
Gold bugs are back at it again. In fact, with a close of $2,096/ounce this week, it has managed to reclaim $2,080s, which has acted as a ceiling ever since August 2020 when it reached $2,089 and retreated. After that, rally attempts stopped at that price point in March 2022 ($2,079), May last year ($2,085) and several times this year, not to mention last December when the metal hit a new high of $2,152.
This is as good an opportunity as it gets to build on this week’s action. Needless to say, a breakout would be massive. Encouragingly for the bulls, the metal has been making higher lows since November 2022 when it bottomed at $1,618.
Nasdaq (mini): Currently net long 10.2k, down 15.3k.
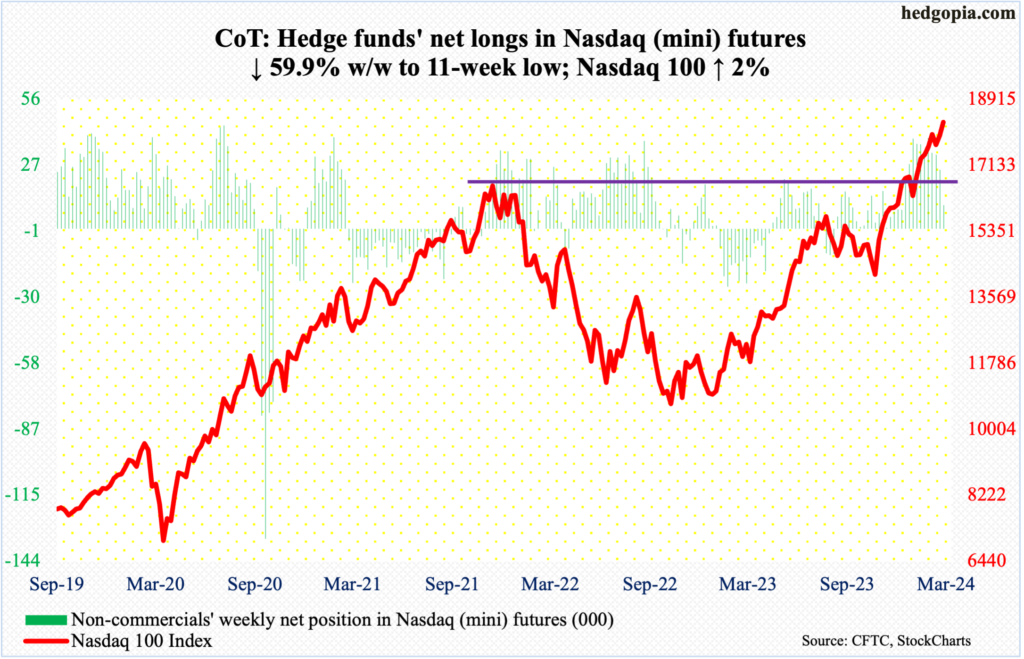
One more roadblock bit the dust. The Nasdaq 100 had been stopped at 18000 since February 9th. Friday, the tech-heavy index rallied 1.4 percent to score yet another breakout, albeit mini. For the week, it jumped two percent. This was the 16th up week in 18. From last October’s lows, it is up an insane 30.4 percent – and up 75.6 percent from October 2022. Unreal!
On Friday last week, Nvidia (NVDA) backed off after tagging $824, dropping to $771 this Thursday. By Friday, bulls were testing last week’s high, with the stock closing at $823. This is setting up as yet another opportunity for the stock to push higher. Rightly or wrongly, this has become a go-to stock for now and will help the overall market should it break out.
Russell 2000 mini-index: Currently net short 18.2k, down 6k.
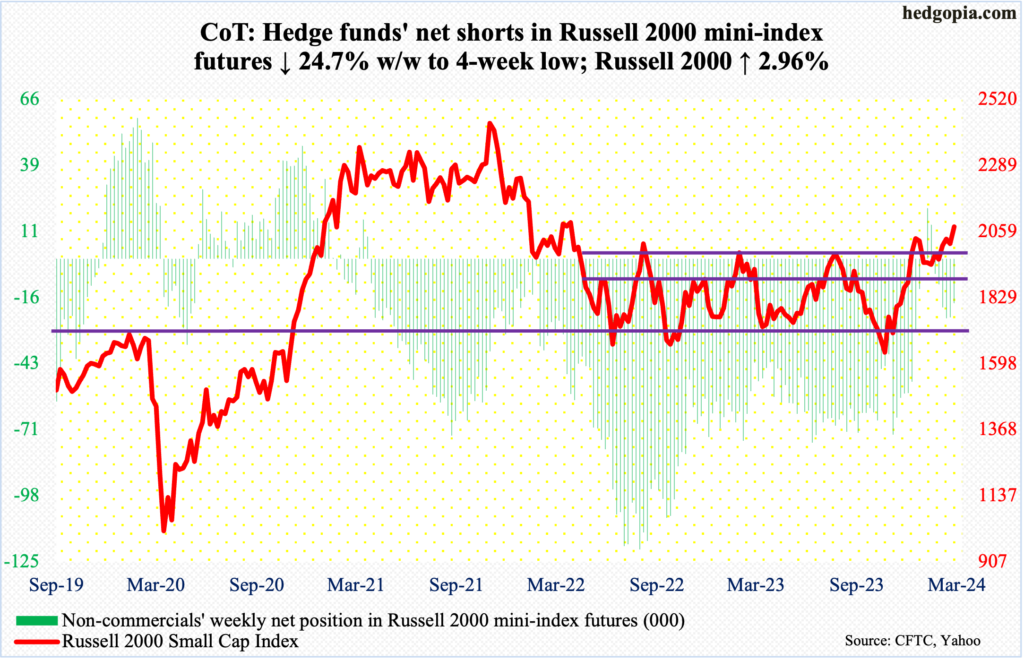
The Russell 2000 had a strong week – up three percent to 2076 – but it is yet to convincingly take out the December 27th high of 2072. Back then, the small cap index stopped at that price after a two-month rally that began at 1634 on October 27th.
Small-cap bulls have an opportunity to at least go attack 2100, which is a measured-move target following a 200-point – between 1900 and 1700 – range breakout on December 13th.
US Dollar Index: Currently net long 2.1k, up 537.
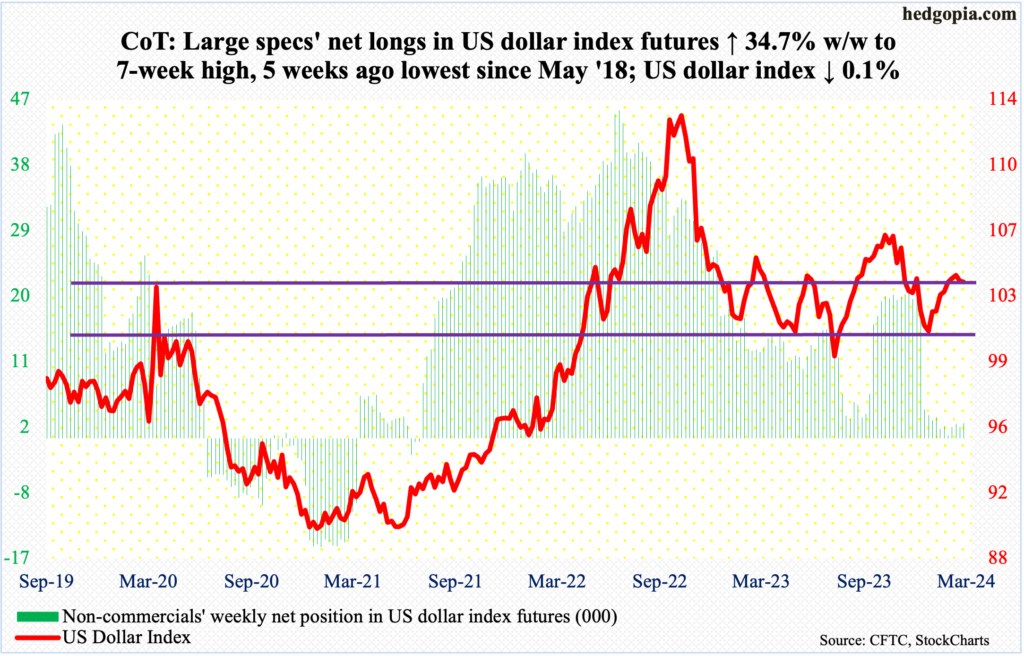
The US dollar index suffered a back-to-back down week, but only nominally this week, down 0.1 percent to 103.80. This follows a weekly spinning top two weeks ago and a shooting star before that. Last week’s could be a hanging man, and this week’s is a doji.
The point is, the chart points to a lot of indecision. Understandably so, as the index has hovered around 103-104, which goes back to December 2016, for several weeks now. Post-Fed pivot on December 13th, it sliced through that horizontal support. It has made a return trip to that level, but reclaiming it is proving difficult for dollar bulls. Odds favor the bears for now.
VIX: Currently net short 40.7k, up 1.6k.
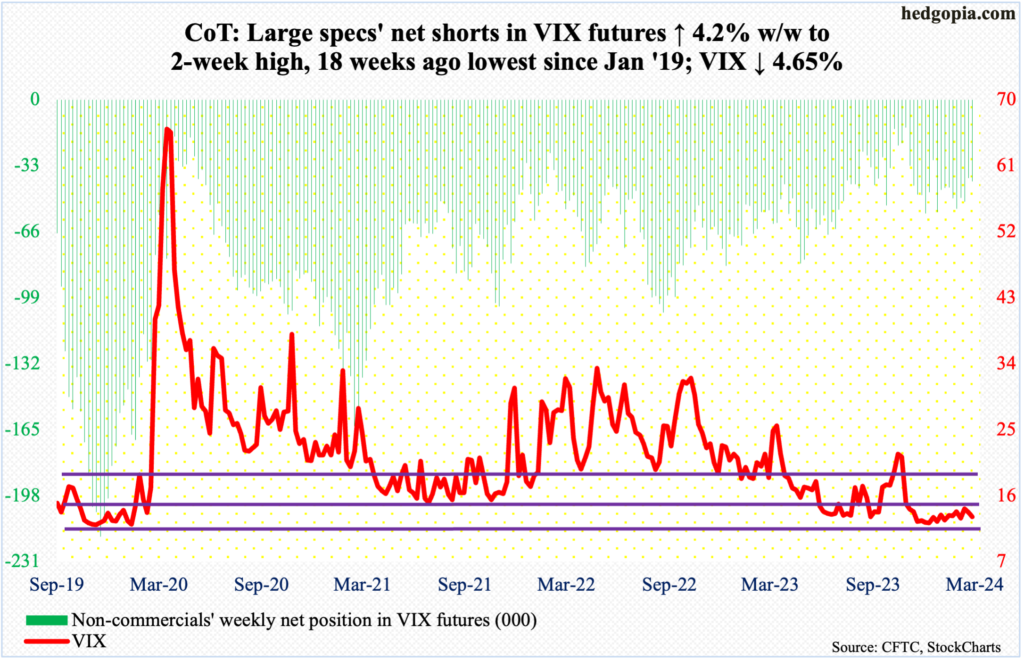
VIX this week gave back 0.29 points to 13.11 – ever so close to a rising trend line from December 12th when VIX bottomed at 11.81; this gets breached at 13. Right here and now, odds favor the bears – volatility bears, that is.
The current lack of momentum for the bulls is highlighted by the fact that the weekly RSI is turning lower at the median.
Thanks for reading!
