
Following futures positions of non-commercials are as of January 23, 2018.
10-year note: Currently net short 117.9k, up 28.6k.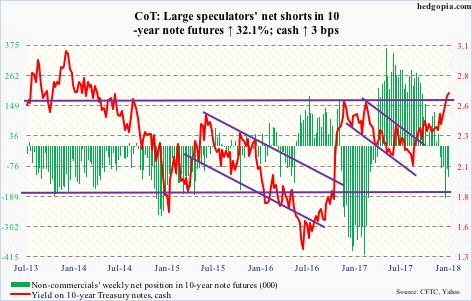
Tuesday, a two-day FOMC meeting begins. This is the year’s first, and will be Janet Yellen’s, the outgoing chair, last. (The FOMC meets eight times a year.)
The next one is on March 20-21, and this one comes with a press conference by the chair. Jerome Powell is replacing Ms. Yellen.
In the futures market, the likelihood of a hike next week is almost non-existent. In all probability, there is not going to be much change in the language as well. The dot plot expects three hikes this year.
More interesting will be the March meeting. Futures have priced in 77-percent odds of a 25-basis-point rise in that meeting. Importantly, would the Powell-led FOMC continue the status quo or chart a different path – regardless hawkish or dovish? Markets currently expect only two hikes this year.
30-year bond: Currently net long 55.7k, down 11.4k.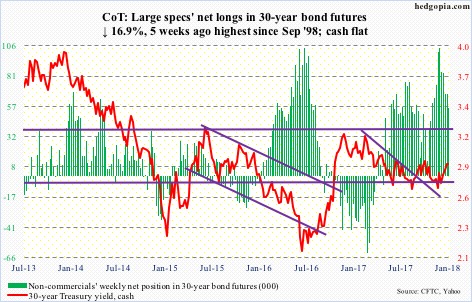
Major economic releases next week are as follows.
Personal income for December is due out Monday. In the 12 months to November, core PCE rose 1.48 percent. This is the Fed’s favorite measure of consumer inflation, and has remained sub-two percent since May 2012.
Tuesday, the S&P Corelogic Case-Shiller home price index for November comes out. Nationally, home prices in October rose 6.2 percent year-over-year. This was the highest growth rate since June 2014. Prices have risen every month since May 2012.
Wednesday brings the employment cost index (4Q17) and the pending home sales index (December).
Compensation costs for private-industry workers increased 2.5 percent in the 12 months to September last year. While still subdued, this was the fastest growth in 10 quarters.
Pending home sales in November inched up two-tenths of a point month-over-month to 109.5. The cycle high 113.6 was reached in April 2016.
Labor productivity (4Q17, preliminary) and the ISM manufacturing index (January) are due out Thursday.
Non-farm output per hour increased 1.46 percent y/y in 3Q17. This was the highest growth rate in nine quarters. Productivity remains subdued.
Manufacturing activity rose 1.5 points m/m in December to 59.7, not too far away from September’s 60.8, which was the highest since May 2004.
Employment (January), the University of Michigan’s consumer sentiment (January, final), and durable goods (December, revised) are scheduled for Friday.
The economy only added 148,000 non-farm jobs in December. In all of 2017, the monthly average was 171,000, versus 187,000 in 2016, 226,000 in 2015 and 250,000 in 2014.
Preliminarily, consumer sentiment fell 1.5 points m/m in January to 94.4. October’s 100.7 was the highest since January 2004.
December orders for non-defense capital goods ex-aircraft – proxy for business capital expenditures – rose 8.4 percent y/y to $67.1 billion (SAAR). They fell 0.3 percent m/m. Orders peaked in September 2014 at $70.3 billion and have risen since bottoming in May 2016 at $59.9 billion.
Crude oil: Currently net long 781.5k, down 5k.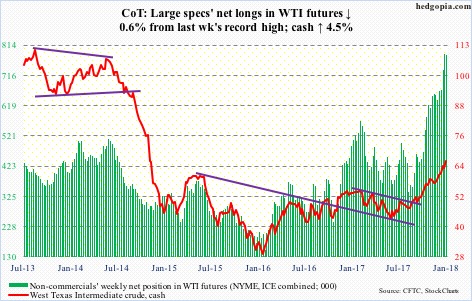
Spot West Texas Intermediate crude ($66.14/barrel) continued higher, before drawing sellers after hitting $66.66, leaving behind a long wick.
The bears have work to do, however. Nearest support lies at $65, which was defended Friday, then $62, and after that $59.
The EIA report for the week of January 19 showed that U.S. crude production increased 128,000 barrels per day to 9.89 million b/d – a new record.
Crude imports rose as well – by 91,000 b/d to eight mb/d. This was a 13-week high.
Refinery utilization fell 2.1 percentage points to 90.9 percent. The 96.7-percent reading three weeks ago was the highest since August 2005.
Gasoline and distillate stocks rose 3.1 million barrels to 244 million barrels and 639,000 barrels to 139.8 million barrels, respectively.
Crude stocks, however, dropped 1.1 million barrels to 411.6 million barrels – the lowest since February 2015.
E-mini S&P 500: Currently net long 166.5k, up 44k.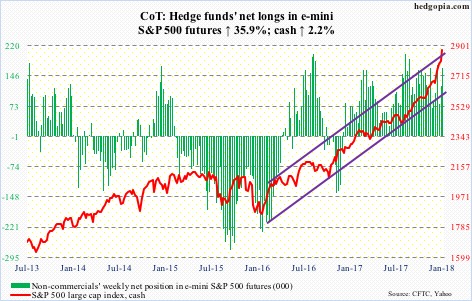
The crowd is jumping on board.
In the week through Wednesday, U.S.-based equity funds (including ETFs) took in $23.4 billion. This followed inflows of $36.8 billion in the prior four (courtesy of Lipper).
In the same week, $13.7 billion went into SPY (SPDR S&P 500 ETF), while VOO (Vanguard S&P 500 ETF) attracted $657 million. IVV (iShares core S&P 500 ETF), however, lost $126 million (courtesy of ETF.com).
Late to the party? Time will tell. This much we know. The S&P 500 (cash) has rallied 19 percent in the past five months, and 7.5 percent this year alone. These are heady numbers. We could very well be witnessing events before a blow-off top.
That said, momentum – as overbought as it is – is intact. The index Monday enjoyed a mini breakout – out of 2800 – followed by another on Friday out of 2845.
Euro: Currently net long 144.7k, up 5.2k.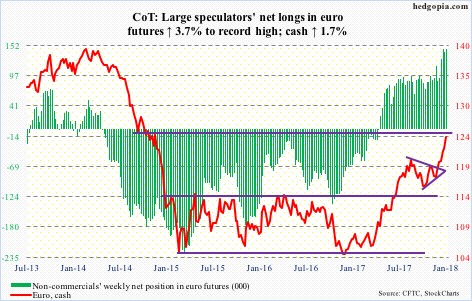
Last July, the cash ($124.27) broke out of a nearly 10-point range. A measured-move target extends to 124-125. Similarly, a trend line drawn from the all-time high of $160.20 in April 2008 draws to 125.
At one point Thursday, the euro was up as much as 1.1 percent, but only to reverse hard after hitting 125.37 to end the session down 0.1 percent.
Also Thursday, Mario Draghi, ECB president, talked about the potential impact of the stronger euro on inflation, suggesting it may end up prolonging the need for stimulus.
In all probability, this kind of verbal intervention will continue. Plus, there is that afore-mentioned resistance for the bulls to deal with.
Non-commercials are already the most net long ever.
Gold: Currently net long 214.7k, up 3k.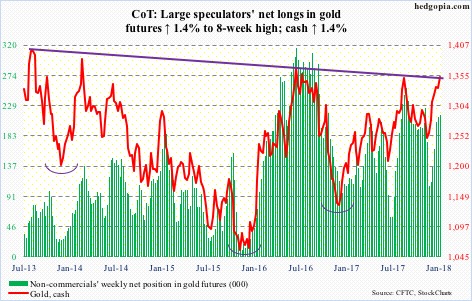
Intraday, the cash ($1,352.10) broke out of a slightly falling trend line from August 2013, but closed out the week right on it. A convincing breakout would be a significant development.
GLD (SPDR gold ETF) was already beginning to attract funds ahead of this, having taken in $760 million on Thursday and Friday last week. In the week through this Wednesday, $874 million moved into the ETF, and IAU (iShares gold trust) took in another $181 million (courtesy of ETF.com).
Also, during the January 1-12 period, GLD short interest shot up 97.3 percent to a four-month high. The metal’s advance this week probably squeezed these shorts.
Where gold trades currently is worth watching also because $1,360s also makes up the neckline of a four-and-a-half-year-old reverse-head-and-shoulders formation – potentially very bullish should a breakout occur.
Nasdaq 100 index (mini): Currently net long 15k, down 10.4k.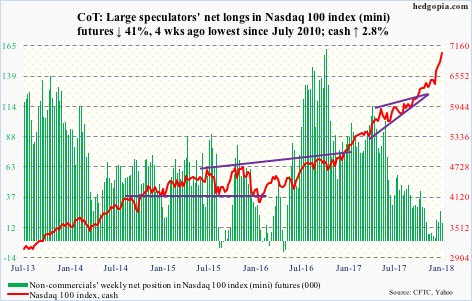
In the week through Wednesday, QQQ (PowerShares QQQ ETF) gained $1.2 billion (courtesy of ETF.com).
Friday, the cash rose to a new all-time high of 7022.97. It is possible shorts gave up some more.
During the January 1-12 period, short interest on XLK (SPDR technology sector ETF) dropped 13.1 percent to a one-year low. On SMH (VanEck Vectors Semiconductor ETF), it fell 15.1 percent to a seven-month low. QQQ’s (PowerShares QQQ ETF), however, rose 11 percent to a four-month high.
Russell 2000 mini-index: Currently net long 36.7k, down 5.2k.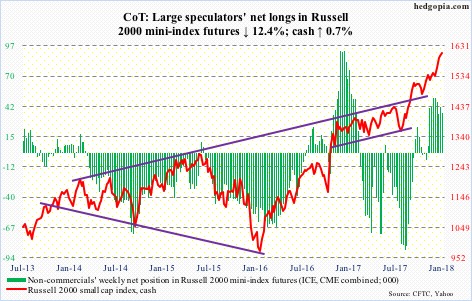
Flows continued into small-caps. In the week to Wednesday, $791 million moved into IWM (iShares Russell 2000 ETF), and IJR (iShares core S&P small-cap ETF) took in $52 million. This was preceded by inflows of $305 million and $87 million in the prior week, in that order (courtesy of ETF.com).
Nonetheless, small-caps continue to lag their large-cap peers. The week produced a candle with a little bit of a wick. The bears would love to make something out of it, but have persistently been denied an opportunity since particularly the most recent advance began mid-November last year.
US Dollar Index: Currently net short 4.2k, up 2.9k.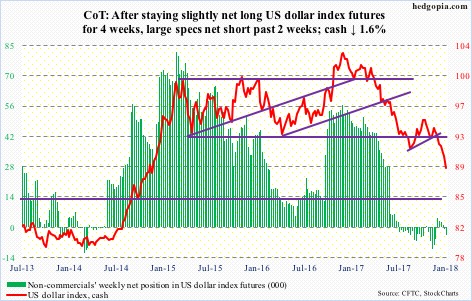
Treasury Secretary Steven Mnuchin versus President Trump. Wednesday in Davos, the former said a weak dollar would be good for U.S. trade. A day later, the latter said he ultimately would want the greenback to be strong. Predictably, the dollar seesawed.
Having just lost nearly two-decade support at 92-93, the US dollar index lost one percent on Wednesday, only to inch up 0.2 percent in the following session. Mr. Trump’s comments seem to have soothed traders’ nerves Thursday, as the cash (88.89) reversed hard from the intraday low of 88.25.
Support/resistance at 89 goes back to early 2004. Thursday’s low also tested a rising trend line from May 2011 – so far successfully. This could prove to be an important test.
VIX: Currently net short 90.2k, up 8k.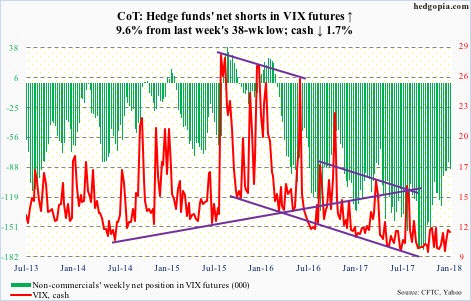
Volatility bulls managed to defend the 200-day on the cash (11.08) – now above that average for nine sessions. The daily chart is itching to go lower, so next week will be another test.
Be that as it may, VIX has held up better the past couple of weeks, even as the S&P 500 rallied 3.1 percent.
It seems longs are buying protection.
This is taking place even as equity calls are in heavy demand. The 21-day moving average of the CBOE equity put-to-call ratio Friday dropped to .543 – matching the low on July 17, 2014. Equity bears will have a feast when – not if – unwinding begins.
Thanks for reading!
