
Following futures positions of non-commercials are as of May 8, 2018.
10-year note: Currently net short 408.6k, down 37k.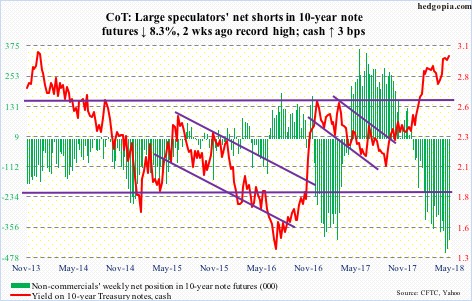
The 10-year Treasury rate (2.97 percent) once again is hammering on three percent. On April 25, yields retreated after rising intraday to 3.04 percent, essentially matching the prior high from December 2013. The subsequent drop stopped a week ago Friday when the 10-year found support at the 20-day. Kudos to the bears (price) for stepping up at the right time.
Medium- to long-term, yields are in the midst of interesting dynamics. They were 2.31 percent as early as last September. These notes are not yielding more because the economy is accelerating. If anything, it is decelerating.
The ISM manufacturing index dropped two points month-over-month in April to 57.3. February’s 60.8 was the highest since May 2004. Activity is dropping from a very high level, so odds favor continued unwinding in the months ahead. This factor should favor bond bulls, not the bears.
In all probability, the long end of the curve is being sold for another reason – potential mismatch between supply and demand. In the 12 months to March, the federal budget deficit totaled $738.7 billion. Add in tax cuts of last December and subsequent fiscal stimulus, it is all but certain the deficit is headed higher in the quarters/years to come. Treasury issuance should follow. This should favor higher rates.
Thus the bull-bear duel. Non-commercials, with net shorts up to the gills, belong to the bearish camp. This very factor in due course can end up putting downward pressure on yields, as these traders unwind their holdings. The risk rises the longer the bulls defend three percent.
30-year bond: Currently net long 6.2k, up 12.9k.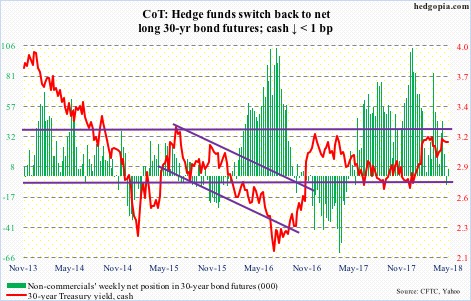
Major economic releases next week are as follows.
Tuesday brings retail sales (April), the NAHB housing market index (May), and Treasury International Capital data (March).
Retail sales rose 0.6 percent month-over-month in March to a seasonally adjusted annual rate of $494.6 billion. This was the first up month in four. Sales increased 4.5 percent year-over-year.
Home builder sentiment in April fell a point m/m to 69. Last December’s 74 was the highest since July 1999.
Foreigners have been actively buying US equities, but less so versus just recently. The 12-month rolling total of $140 billion in January was the highest since May 2010, with February having declined to $117.4 billion.
Housing starts and industrial production – both for April – are due out Wednesday.
Starts jumped 1.9 percent m/m to 1.32 million units. January’s 1.34 million was the highest since 1.35 million in July 2007.
Capacity utilization rose 3.2 percent y/y in March to 78 percent. Utilization reached a cycle high 79.6 percent in November 2014, and has risen since bottoming at 75 percent in November 2016.
Crude oil: Currently net long 739.3k, down 4.2k.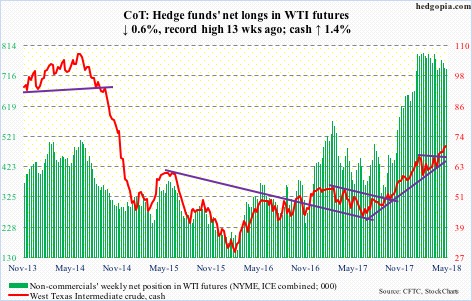
US crude production rose another 84,000 barrels/day to 10.7 million b/d.
The EIA report for the week ended May 4 also showed refinery utilization fell seven-tenths of a percentage point to 90.4 percent.
Stocks, however, fell across the board, with both crude and gasoline down 2.2 million barrels each to 433.8 million barrels and 235.8 million barrels respectively, and distillates down 3.8 million barrels to 115 million barrels.
Crude imports, too, dropped 1.2 mb/d to 7.3 mb/d.
This, combined with tensions in the Middle East, helped spot West Texas Intermediate crude ($70.70/barrel), which rallied another 1.4 percent this week.
The crude enjoyed a mini breakout as well. After breaking out of $66.50 a month ago, followed by a breakout retest, it went sideways at a slightly higher level for over two weeks before again breaking out.
It is extended, though. Thursday’s intraday high of $71.89 was the highest since November 2014. It also came in a spinning top session, just outside the daily upper Bollinger band. WTI at least needs a breather.
E-mini S&P 500: Currently net long 162.4k, down 66.9k.
Volume notwithstanding, price action saw improvement. The cash (2727.72) not only retook the 50-day moving average but also a falling trend line from January 26 when the S&P 500 peaked at 2872.87. It also rallied past the April 18 high, hence a pattern of higher lows and higher highs has been established.
In the aggregate, flows were in cooperation. In the week to Wednesday, $3.1 billion came out of SPY (SPDR S&P 500 ETF), even as VOO (Vanguard S&P 500 ETF) gained $388 million and IVV (iShares core S&P 500 ETF) $4.4 billion (courtesy of ETF.com).
In the same week, US-based equity funds (including ETFs) lost $231 million (courtesy of Lipper.com).
Several weekly momentum indicators have reached the median. This is an opportunity for the bears to put their foot down. The daily chart is in overbought territory.
Euro: Currently net long 120.5k, down 63.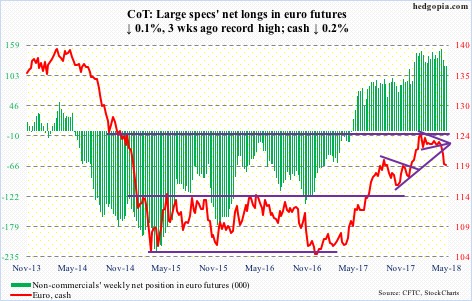
The cash ($119.47) continued lower this week but not before a spinning top showed up Tuesday (intraday low of $118.38). Relief rally is possible near term. Immediately ahead, there is moving-average resistance, including the 200-day ($120.11).
Could this form a durable bottom? Probably not, as things stand. The weekly chart has room to continue lower. Plus, the loss of support at $122-122.50 two weeks ago has damaged the technical picture.
Non-commercials are still heavily exposed on the long side. Serious unwinding has not yet begun.
Gold: Currently net long 107.4k, up 661.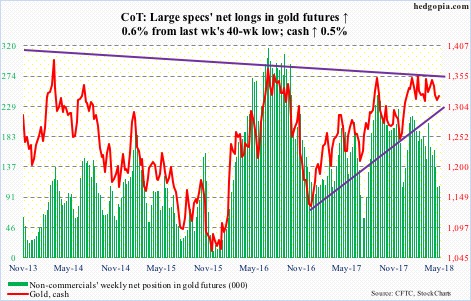
The 200-day ($1,307.10/ounce) on the cash ($1,320.70) was once again tested both Tuesday and Wednesday, and it held. This also approximates a rising trend line from December 2016. In the meantime, shorter-term averages are at least going flat, as is the 50-day ($1,329.35).
Gold bugs are not letting go of $1,300 support. For nearly two years now, the metal has remained trapped between this and $1,360-70 above. A journey to the top of the range is the path of least resistance near term.
The bulls hope flows improve. In the week through Wednesday, GLD (SPDR gold ETF) lost $149 million, while IAU (iShares gold trust) took in $41 million (courtesy of ETF.com).
Nasdaq 100 index (mini): Currently net short 6.6k, down 7.3k.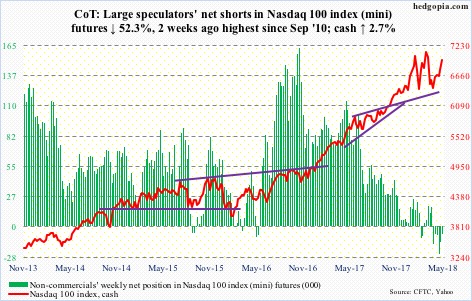
Two months ago, the cash (6952.56) suffered a false breakout, resulting in a daily island reversal. What transpires around 7000 thus will be a big tell. The bulls do not want to see the Nasdaq 100 retreat from this level, which is increasingly looking likely. In this scenario, the right side of a head-and-shoulders pattern can potentially form.
In the latest rally, as is the case with the S&P 500, volume has been anemic on the Nasdaq 100. Shorts likely helped. XLK (SPDR technology sector ETF) short interest is substantially off the mid-December high, but is still relatively high (more here).
Flows helped, too. In the week to Wednesday, QQQ (PowerShares QQQ ETF) attracted $1.3 billion (courtesy of ETF.com).
Russell 2000 mini-index: Currently net long 38.1k, up 14.7k.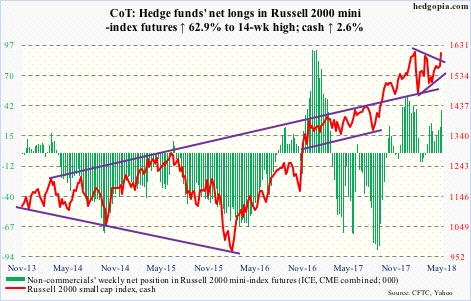
Since peaking at the all-time high of 1615.52 on January 24, the cash (1606.79) has traded within a symmetrical triangle, which it broke out of this week. Thursday, the Russell 2000 index rallied intraday to within 6.07 points of that high.
Of major US equity indices, the index is closest to attacking the late-January highs.
Flows cooperated. In the week to Wednesday, $284 million moved into IJR (iShares core S&P small-cap ETF), while IWM (iShares Russell 2000 ETF) gained $559 million (courtesy of ETF.com).
Non-commercials raised net longs to a 14-week high.
Near term, the daily chart is getting extended. Moving-average support lies at 1550s-60s, with the 50-day at 1557.57.
US Dollar Index: Currently net short 549, down 1.2k.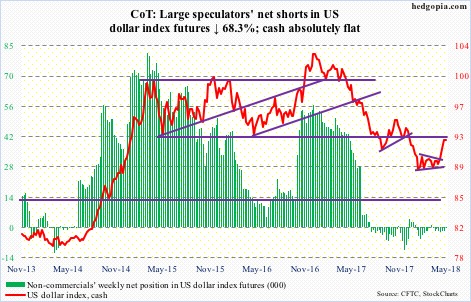
The cash (92.41) continued to attack 92-93 – an important price point going back to at least 1998 – but at the same time gave out further signs of fatigue. Wednesday produced a long-legged doji, followed by down Thursday and Friday. The 200-day (91.84) lies below.
The latest rally precedes a symmetrical triangle breakout three weeks ago. This was preceded by persistent defense of long-term support at 88-89.
Non-commercials pretty much sat out the entire rally.
Near term, besides 91, there is support at 90.30-ish.
VIX: Currently net long 17.6k, down 3.4k.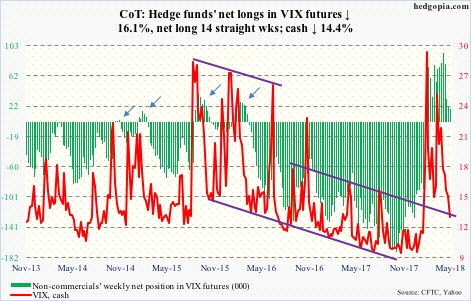
For the first time since the cash (12.65) began to retreat post-intraday surge to 50.30 on February 6, it closed below the 200-day this week.
In the right circumstances for volatility bears, VIX can continue lower, but, with the lower end of a long-term range not that far away, there is not much room to drop a whole lot.
Non-commercials cut back holdings a little more this week, but continue to maintain a long bias.
In the meantime, there has been a decided uptick in investor optimism. In four of the last six sessions, the CBOE equity put-to-call ratio was in the .50s.
Thanks for reading!
