
Following futures positions of non-commercials are as of May 15, 2018.
10-year note: Currently net short 381.9k, down 26.7k.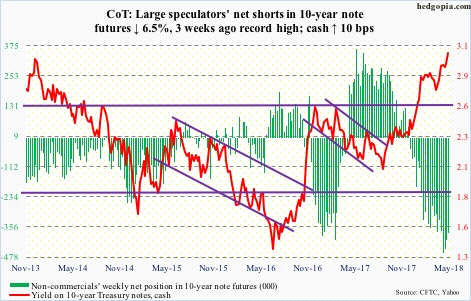
The Trump administration demands that China cut its trade gap with the US by $200 billion. Last year, China ran a $375-billion goods trade surplus with the US.
Amidst talks between the two parties came news Thursday that China agreed to that. Then came the rebuttal Friday, with the Asian nation disputing it made such an offer. Let us play a ‘what if’.
What if China indeed ends up cutting its surplus by a massive amount? Could this potentially have implications for the US sovereign bond market? China does recycle its trade surplus by buying Treasury securities.
Are bond vigilantes fearing such a scenario?
Ten-year Treasury yields (3.07 percent) rose to 3.12 percent intraday Thursday before backing off a tad. This was the highest since July 2011. This preceded a break out of three percent, and 2.62 percent before that. Bears now have carved out decent support at 2.94 to three percent.
As early as September 7 last year, the 10-year yielded 2.03 percent. Since then, TLT (iShares 20 + year Treasury bond ETF) shed 10-plus percent. Thus far, this has not much impacted foreigners’ Treasury holdings. In August last year, they held $6.25 trillion worth. In March, this rose to $6.29 trillion. China’s, however, went from $1.2 trillion to $1.19 trillion, and Japan’s from $1.1 trillion to $1.04 trillion. They are the two largest holders of these securities, respectively.
This is taking place at a time when the US government continues to run massive budget deficit, with the 12-month total of $738.7 billion in March. With tax cuts of last December and subsequent fiscal stimulus, even in good times the deficit is probably headed higher. Treasury issuance should follow. Add to this the fact that the Fed, which post-financial crisis has been a reliable buyer of Treasury securities, has been cutting back. If China buys less, who will replace that void?
30-year bond: Currently net long 11.9k, up 5.6k.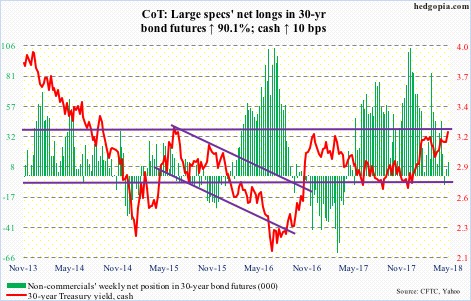
Major economic releases next week are as follows.
New home sales (April) and FOMC minutes for the May 1-2 meeting are due out Wednesday.
Sales increased four percent month-over-month to a seasonally adjusted annual rate of 694,000 units in March. Last November’s 711,000 was the highest since 727,000 in October 2007.
April’s existing home sales come out Thursday. March was up 1.1 percent to 5.6 million units (SAAR). A cycle high of 5.72 million units was reached last November, which was the highest since 5.79 million units in February 2007.
Friday brings durable goods orders (April) and University of Michigan’s consumer sentiment index (May, final).
March orders for non-defense capital goods ex-aircraft – proxy for business capex plans – rose 6.8 percent year-over-year to $67.1 billion (SAAR). Growth has been decelerating since 9.9 percent last October.
May’s preliminary reading showed consumer sentiment was unchanged from April’s 98.8. March’s 101.4 was the highest since 103.8 in January 2004.
Crude oil: Currently net long 727.5k, down 11.8k.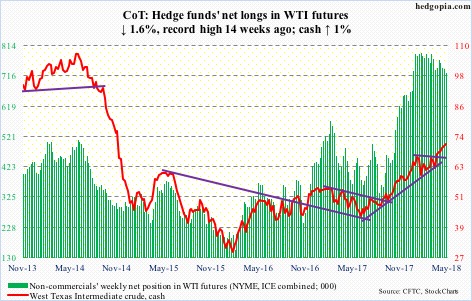
In the aggregate, the EIA report for the week ended May 11 continued to favor the bulls.
US stocks of crude, gasoline and distillates respectively fell 1.4 million barrels to 432.4 million barrels, 3.8 million barrels to 232 million barrels, and 92,000 barrels to 114.9 million barrels.
Refinery utilization rose seven-tenths of a percentage point to 91.1 percent.
Crude production, however, rose another 20,000 barrels/day to 10.7 million b/d. As did crude imports, up 278,000 b/d to 7.6 mb/d.
Spot West Texas Intermediate crude ($71.37/barrel) trudged higher this week along the daily upper Bollinger band and the 10-day moving average. Momentum is intact, but signs of hesitation are appearing. In the last seven sessions, three long-legged dojis/spinning tops showed up. The daily chart is itching to go lower.
Immediately ahead, there is support at $69.50, and after that breakout retest takes place at $66.50.
E-mini S&P 500: Currently net long 198.8k, up 36.5k.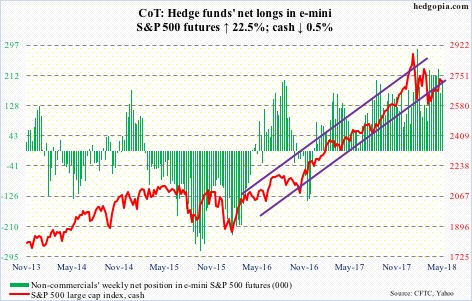
Flows improved.
In the week to Wednesday, US-based equity funds (including ETFs) gained $10.1 billion (courtesy of Lipper.com).
In the same week, $5.1 billion moved into SPY (SPDR S&P 500 ETF) and $308 million into VOO (Vanguard S&P 500 ETF), while IVV (iShares core S&P 500 ETF) lost $15 million (courtesy of ETF.com).
This was not enough for the bulls to build on last week’s trend-line breakout. On Tuesday, bids did show up near that breakout, but action since has been tentative. The daily chart is extended. Unwinding is likely near term.
Euro: Currently net long 115.1k, down 5.4k.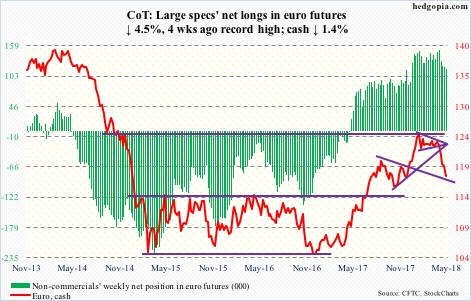
The cash ($117.83) started the week by just about testing – unsuccessfully – the 200-day on Monday, followed by more downward pressure. Tuesday’s release of 1Q18 Eurozone GDP did not help. The economy expanded 0.4 percent quarter-over-quarter, slower than 0.7 percent in 4Q17.
This was the fifth consecutive weekly drop for the euro, which preceded failure at $125, further exacerbated by the bulls’ inability to save $122-122.50.
The daily chart is grossly oversold, but needs to stabilize first. Friday produced a hammer candle. Nearest resistance lies at $118.20.
Gold: Currently net long 92.4k, down 15k.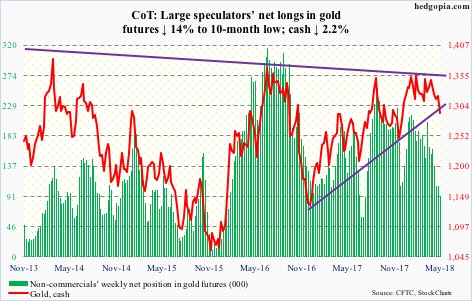
Tuesday’s 2.1-percent decline cost the cash ($1,291.30/ounce) not only the 200-day but also $1,300. Support at the latter goes back to September 2010.
Gold bugs can still salvage the situation by defending $1,280-ish, which represents a rising trend line from December 2016. Trend-line support from December 2015 when gold bottomed at $1,045.40 is not tested until $1,240. This is an absolute must-save.
Thus far, bids have showed up at $1,280s, which in back-to-back spinning top sessions on Wednesday and Thursday was successfully tested. Friday produced a hammer.
The only thing lacking is flows. In the week through Wednesday, GLD (SPDR gold ETF) lost $288 million, while IAU (iShares gold trust) took in $49 million (courtesy of ETF.com).
Even better if non-commercials stop cutting back net longs.
Nasdaq 100 index (mini): Currently net short 38, down 6.6k.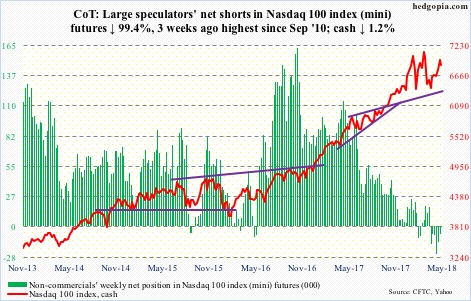
Monday, the cash (6866.25) retreated from just north of 7000. This can potentially mark the right side of a head-and-shoulders pattern. Even if it evolves as such, the neckline does not break until 6500, which is a long way to go.
For now, the fact that sellers showed up near 7000 probably does not encourage the bulls much. Two months ago, the Nasdaq 100 suffered a false breakout at that level, resulting in a daily island reversal.
QQQ (PowerShares QQQ ETF) in the week to Wednesday did attract $498 million (courtesy of ETF.com), but that did not help much.
At least near term, it increasingly feels like it is the bears’ ball to lose.
Russell 2000 mini-index: Currently net long 53.3k, up 15.1k.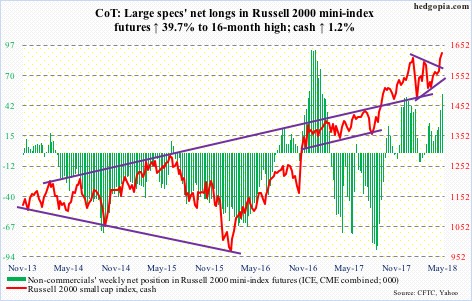
Small-caps continue to outrun their mid- and large-cap peers. This week, the cash (1626.63) broke out to a new high. Of major US equity indices, it is the only one to do so after peaking late January.
Non-commercials were right to aggressively add to net longs last week. This week, they added more.
In the ETF land, flows were mixed, with IWM (iShares Russell 2000 ETF) losing $126 million in the week to Wednesday and IJR (iShares core S&P small-cap ETF) gaining $271 million (courtesy of ETF.com).
If the breakout is genuine, technicians would expect the Russell 2000 to rally another 11 percent in due course. For now, breakout retest is the path of least resistance.
US Dollar Index: Currently net long 18, up 567.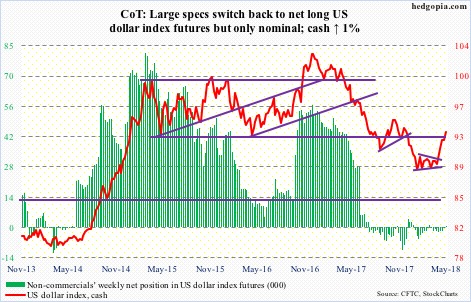
Between early last year and February this year, the cash (93.54) went from 103.82 to 88.15. A 38.2-percent retracement of that decline lies at 94.14. This level also approximates horizontal resistance, and can act like a magnet near term.
Regardless if dollar bulls can pull this off or not, momentum is with them.
The latest rally that began in earnest mid-April preceded a symmetrical triangle breakout a month ago. This was preceded by persistent defense of long-term support at 88-89.
The daily chart is way extended. In the event the US dollar index proceeds to unwind at least some of this, support lies at 92.40, and 91 and 90.30-ish after that.
VIX: Currently net short 3.7k, down 21.3k.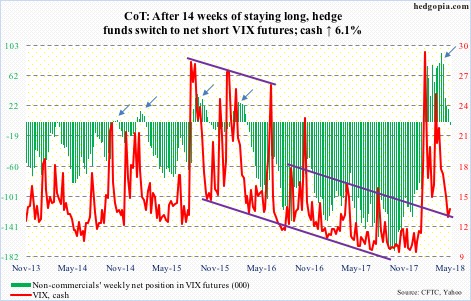
The cash (13.42) pretty much traded around the 200-day, and has room to rally.
Interestingly, non-commercials ended their 14-week stretch of staying net long, during which spot VIX dropped intraday from just north of 50 to sub-11.
Elsewhere in the options market, the CBOE equity-only put-to-call ratio is beginning to reflect elevated optimism. In six of the last 11 sessions, the ratio came in at 0.50s. Wednesday’s 0.5 was the lowest since 0.49 on January 26, which was when the S&P 500 peaked. The difference between then and now is that back then the 0.49 reading was preceded by persistent readings of 0.40s-0.50s. Not the case now. The 21-day moving average was 0.543 back then versus 0.616 now, and the 10-day 0.524 back then versus 0.58 now. That said, the 10-day in particular is low enough to begin to unwind (dipped to 0.57 Thursday).
Thanks for reading!
