
Following futures positions of non-commercials are as of June 5, 2018.
10-year note: Currently net short 397.5k, down 73.5k.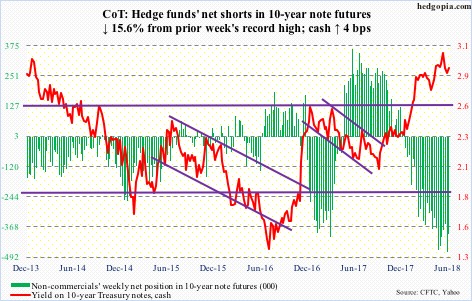
The FOMC meets next week. It is this year’s fourth meeting, and four more remain after this. The fed funds rate was raised by 25 basis points in the March meeting. Another 25-basis-point hike next week is priced in. With this, rates would have risen by 175 basis points from near zero in December 2015 – to a range of 175 to 200 basis points.
The odds in the futures market of another hike in the September meeting currently stand at 63 percent. A hike in that meeting puts rates between 200 and 225 basis points – still accommodative given the US economy is less than a month from completing nine years of recovery. Rather subdued growth in inflation and wages has given the Fed leeway to maintain the current tightening posture.
In March, the FOMC dot plot expected three hikes this year. Markets are fine with this. Any language – or a wink and a nod – next week suggesting a potential four-hike scenario can disrupt the calm waters, equities in particular. As things stand, the economy may not be able to tolerate a tighter posture.
30-year bond: Currently net short 18.2k, down 15.5k.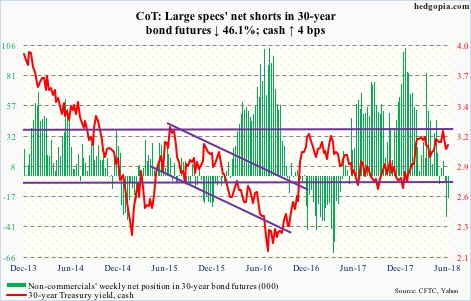
Major economic releases next week are as follows.
Tuesday, the FOMC meets, and ends the next day.
Also Tuesday, the NFIB small business optimism index and the consumer price index – both for May – are published.
Small-business optimism rose one-tenth of a point month-over-month in April to 104.8. February’s 107.6 was the second highest level in its history (monthly surveys go back to 1986).
Consumer inflation increased 0.2 percent m/m in April and 2.5 percent in the 12 months to April. Core CPI grew 0.1 percent and 2.1 percent over the same time period, respectively.
May’s PPI-FD is due out Wednesday. Producer prices in April inched up 0.1 percent m/m. They rose 2.6 percent in the 12 months to April. Core PPI rose 0.1 percent and 2.5 percent over the same time period, respectively.
Retail sales for May come out Thursday. April was up 4.7 percent y/y to a seasonally adjusted annual rate of $497.6 billion.
Friday brings industrial production (May), University of Michigan’s consumer sentiment (June) and Treasury International Capital data (April).
Capacity utilization rose 2.3 percent y/y in April to 78 percent. Utilization has risen from 75 percent in November 2016, but is still lower than the cycle high 79.6 percent reached in November 2014.
Consumer sentiment fell eight-tenths of a point m/m to 98 in May. March’s 101.4 was the highest since 103.8 in January 2004.
Foreigners are still buying US equities but increasingly less so. On a 12-month rolling total basis, they bought $90 billion worth in March, which was lower than $140 billion in January.
Crude oil: Currently net long 675k, down 7.8k.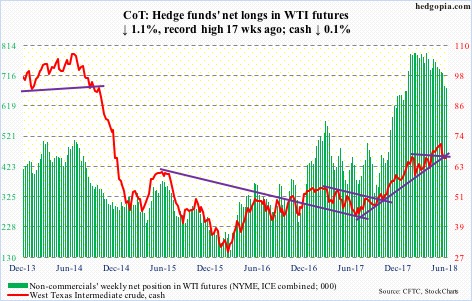
The EIA report for the week of June 1 did not favor oil bulls much.
US stocks rose across the board, with crude rising 2.1 million barrels to 436.6 million barrels, gasoline 4.6 million barrels to 239 million barrels, and distillate 2.2 million barrels to 116.8 million barrels.
Crude production rose another 31,000 barrels/day to 10.8 million b/d. Ditto with crude imports, up 715,000 b/d to 8.35 mb/d.
Refinery utilization, however, rose 1.5 percentage points to 95.4 percent – a 22-week high.
By the time this report was out – on Wednesday – spot West Texas Intermediate crude ($65.74/barrel) was already down a decent amount. It peaked at $72.90 on May 22. Tuesday, it fell to $64.22. Intraday, the trend line from last June was breached but saved by close.
The weekly chart has room to continue lower. But near term as long as the trend-line support above remains intact, the crude can at least begin to stabilize. Resistance lies at $66.60, followed by the 50-day ($67.80).
E-mini S&P 500: Currently net long 162.1k, up 38.1k.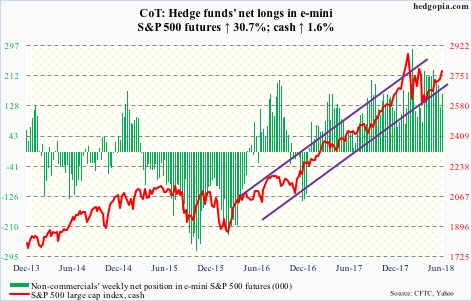
The cash (2779.03) this week broke out of a three-week rectangle. There was also a nearly three-month ascending channel in play, which it broke out of. On the surface, this looks like a bullish development, which it is, but, unlike small-caps, momentum lacks in large-caps.
This week’s intraday high of 2779.90 is lower than the March 13 high of 2801.90, which itself is lower than the all-time high of 2872.87 from January 26. The daily chart is extended. The S&P 500 broke out of the aforementioned channel, but barely. Resistance can develop here. Flows were weak.
In the week to Wednesday, $1 billion was redeemed from SPY (SPDR S&P 500 ETF) and $261 million from IVV (iShares core S&P 500 ETF), while VOO (Vanguard S&P 500 ETF) gained $564 million (courtesy of ETF.com).
In the same week, US-based equity funds (including ETFs) lost $4.3 billion. This followed inflows of $18.7 billion in the prior three (courtesy of Lipper.com).
Euro: Currently net long 89.2k, down 3.8k.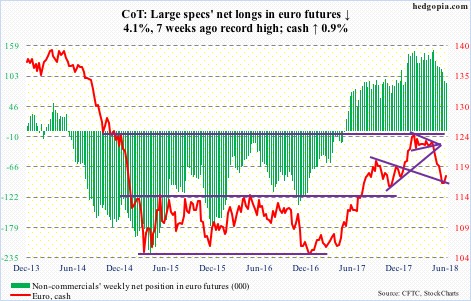
Peter Praet, ECB chief economist, said next week’s governing council (14th) meeting will be pivotal for reaching a decision on when to end their QE. It seems the bank is close to deciding the fate of its asset-purchase program, under which it currently purchases €30 billion/month in Eurozone debt. The program runs through this September.
The cash ($117.78) used this piece of news to try to rally further.
Last week, after dropping 8.1 percent between an intraday high of $125.37 on January 25 and $115.19 on May 29, bulls defended support at $114-115, which the euro broke out of last July.
Immediately ahead, short-term resistance lies at $118.40, which repelled rally attempts Thursday.
Gold: Currently net long 111.4k, down 3.7k.
Gold-focused ETFs continue to bleed. In the week through Wednesday, GLD (SPDR gold ETF) lost $777 million and IAU (iShares gold trust) $184 million (courtesy of ETF.com). In the last four, the two lost a combined $1.6 billion.
These outflows likely robbed the bulls of an opportunity of retaking the 200-day ($1,309.09/ounce) as well as broken-support-turned-resistance at $1,300-plus.
After losing the average on May 15, the cash ($1,302.70) is sideways to slightly up. From this perspective, gold digested the outflows well. Three weeks ago, gold bugs also defended support at $1,280s, which represents a rising trend line from December 2016. As long as this support holds, they deserve the benefit of the doubt.
Nasdaq 100 index (mini): Currently net long 11.1k, up 4.7k.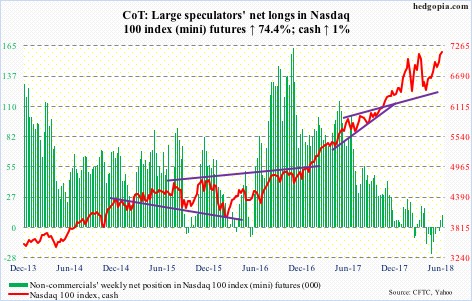
The cash (7152.62) this week further built on last Friday’s rectangle breakout, proceeding to a new all-time high of 7212.45. The chink in tech’s armor is that leadership is narrow.
Friday, 73 percent of Nasdaq 100 stocks were above their 50-day. Back on January 26 when the index peaked at 7022.97, the share of stocks above that average consistently remained in high-80s for several sessions. Later on March 13, the index rose to a new high; a day before that, only 71 percent of stocks were above their 50-day. Once again, the soldiers are falling behind the generals.
Amidst this, Thursday’s 0.8-percent drop preceded a hanging man and a doji before that. The daily chart is extremely extended. Unwinding is the likely course of action near term. There is short-term support at 7000.
In the week through Wednesday, QQQ (PowerShares QQQ ETF) lost $752 million. This followed five straight weeks of inflows totaling $3.4 billion (courtesy of ETF.com).
Russell 2000 mini-index: Currently net long 71k, down 3.3k.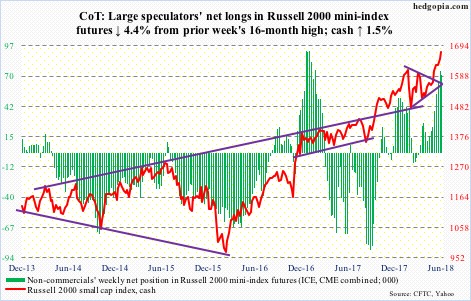
After peaking at 1615.52 on January 24, the cash quickly fell to 1436.43 on February 9. Subsequently on May 16, it broke out, followed by several successful retests. Thus far, bulls have successfully latched on to every positive fundamental data point to build momentum.
In ideal circumstances, a measured-move target would suggest the Russell 2000 (1672.49) can rally 11-plus percent from the breakout point. Through Thursday’s high of 1679.99, it was up four percent.
Flows are cooperating. In the week ended Wednesday, IWM (iShares Russell 2000 ETF) took in $1.2 billion, and IJR (iShares core S&P small-cap ETF) $565 million (courtesy of ETF.com).
Regardless if the aforementioned technical formation completes or not, another retest is likely in the days and weeks ahead.
US Dollar Index: Currently net long 4.4k, up 490.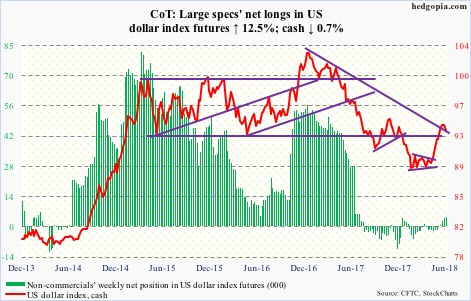
In the wake of six straight positive weeks, last week – a flat week – produced a spinning top. This week, the cash (93.54) experienced more offers, down 0.7 percent.
Short-term support is at 93.20, which was defended Thursday, and after that the 50- and 200-day (91.88). Merely 0.02 separate the two averages. A golden cross is just a matter of time.
VIX: Currently net short 36.2k, down 8.2k.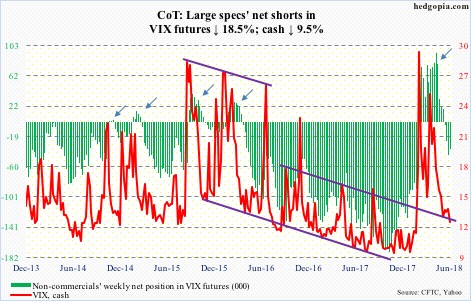
The cash (12.18) just about tested the daily lower Bollinger band Wednesday before drawing bids. Both the 50- and 200-day lie above, with the latter (13.83) in particular set to provide resistance as volatility rises. Near-term, a rally past that average is the path of least resistance. The daily chart is oversold.
Separately, the VIX-to-VXV ratio Wednesday was down to 0.82 – the first time it dropped into the low-.80s since stocks peaked late January.
In the meantime, in five of the last six sessions, the CBOE equity-only put-to-call ratio was in .50s, with Tuesday at .48. The 21-day moving average Thursday fell to .581 – way oversold. Investor optimism is elevated.
Thanks for reading!
