
Following futures positions of non-commercials are as of July 10, 2018.
10-year note: Currently net short 439.1k, down 60.9k.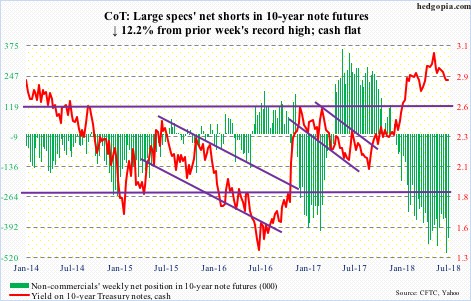
News this week that the Trump administration planned to impose tariffs on another $200 billion worth of imports from China resulted in increased bidding for risk-off assets, but only fleetingly. Thursday, the 10-year Treasury rate (2.83 percent) fell three basis points to 2.84 percent. For the week, yields were flat. The new tariffs followed 25 percent duties on $34 billion in Chinese imports; China immediately retaliated with duties on the same value of American goods.
This rather sanguine reaction is not only limited to fixed income. Be it the Japanese yen, gold or VIX, the alarm bell has not gone off. None of these assets – and others – expect what currently looks like a trade spat to turn into a war. Time will tell if they are whistling past the graveyard or onto something. Chances are, the longer it takes to solve the trade issue, the deeper the roots go and, and uprooting the problem will be increasingly difficult.
This is not a scenario currently foreseen by non-commercials. In fact, quite the opposite. They are neck-deep in net shorts in 10-year note futures. They expect higher yields, a position which will be difficult to defend should a genuine trade war ensue and the economy goes down with it. This in due course might cause a short squeeze, which in and of itself will put yields under pressure.
30-year bond: Currently net long 8.4k, up 24.2k.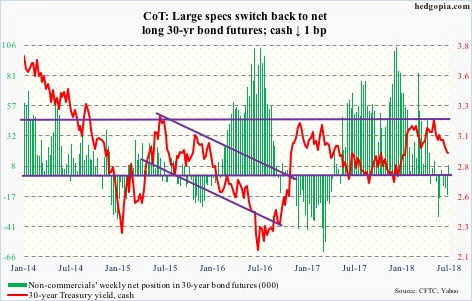
Major economic releases next week are as follows.
Retail sales for June are on deck Monday. May sales expanded 5.9 percent on an annual basis to a seasonally adjusted annual rate of $502 billion. This was the fastest growth rate in six months.
Tuesday brings industrial production (June) and the NAHB housing market index (July).
May US capacity utilization fell 0.3 percent month-over-month to 77.9 percent. April’s 78.1 percent was the highest since March 2015.
Builder sentiment dropped two points m/m in June to 68. Last December’s 74 was the highest since July 1999.
Also on Tuesday – and Wednesday – Jerome Powell, Fed chair, will deliver his Humphrey-Hawkins testimony to Congress.
Housing starts for June are scheduled for Wednesday. Starts in May rose five percent m/m to 1.35 million (SAAR). This was the highest since July 2007.
Crude oil: Currently net long 709k, up 4.5k.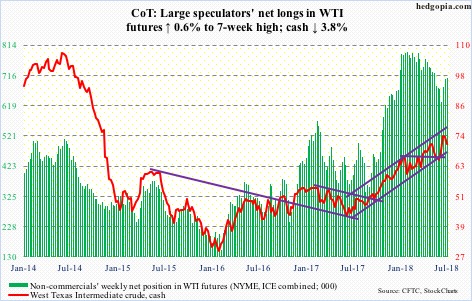
Spot West Texas Intermediate crude ($71.01/barrel) dropped five percent Wednesday. Thursday, the 50-day moving average was tagged. There was no specific news behind the sudden weakness. It is just that the crude got way extended technically.
This week’s 3.8–percent drop was preceded by a weekly spinning top last week. Earlier on July 3, it had rallied to $75.27 before retreating. Around $76 lied the upper bound of a one-year ascending channel. Immediately ahead, there is support at $69-69.50, which was tested Thursday. After that lies support at $66-67, and $64 after that.
The EIA report for the week of July 6 – out Wednesday – contained quite a few positives but was not enough to stop the wave of selling. Crude stocks fell 12.6 million barrels to 405.2 million barrels. This was the lowest since February 2015. Gasoline stocks fell 694,000 barrels to 239 million barrels. Crude imports were down 1.6 million barrels/day to 7.43 mb/d – a nine-week low. In the meantime, for the fifth straight week crude production remained unchanged at 10.9 mb/d.
Distillate stocks, on the other hand, rose 4.1 million barrels to 121.7 million barrels. Refinery utilization nudged lower four-tenths of a percentage point to 96.7 percent.
E-mini S&P 500: Currently net long 172k, up 4k.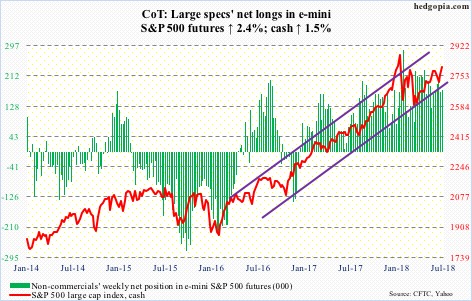
For the sixth straight week through Wednesday, money came out of US-based equity funds (including ETFs), with the latest week losing $1.8 billion. In the prior five, $43.6 billion was withdrawn (courtesy of Lipper.com).
In the same week, SPY (SPDR S&P 500 ETF) lost $558 million and IVV (iShares core S&P 500 ETF) $218 million. VOO (Vanguard S&P 500 ETF) gained $72 million (courtesy of ETF.com).
Despite these outflows, the cash (2801.31) continued to attract bids in a low-volume push higher. It is currently sitting right on resistance at 2800. The daily chart is overbought; 2Q earnings can dictate action near term.
Euro: Currently net long 24.4k, down 12.4k.
The cash ($116.93) opened the week with a rally past the 50-day intraday but closed slightly lower. There is resistance just north of 118, and that has held. The latest mini-rally preceded a couple of back-to-back weekly hammers. In both those weeks, $114-115 drew bids. After going sideways in a rectangle for nearly two and a half years, the euro broke out of this level last July. This is a must-hold.
Gold: Currently net long 81.4k, up 3.1k.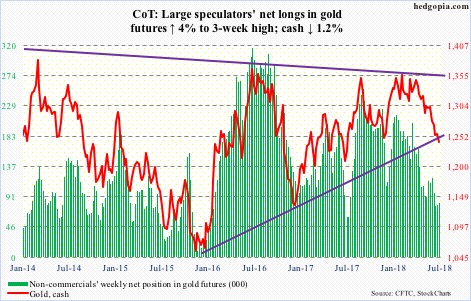
Money continued to leave GLD (SPDR gold ETF) and IAU (iShares gold trust). In the week to Wednesday, they respectively lost $167 million and $79 million (courtesy of ETF.com). Gold bugs can find solace in the fact that a trend line from December 2015 is still not convincingly lost on the cash ($1,241.20/ounce). Last week, when gold dropped to $1,238.80 that trend line was tested. This week, the metal is literally sitting on it. This is crucial support in that the metal bottomed at $1,045.40 in December 2015. Earlier, it peaked at $1,923.70 in September 2011. Gold deserves the benefit of the doubt as long as the trend line is not breached.
Nasdaq 100 index (mini): Currently net long 21.6k, up 5.5k.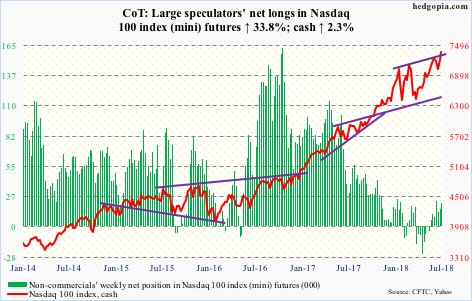
Price continues to diverge from the internals. The cash (7375.82) in a doji session Friday rallied to yet another new high (7387.74). Generals are driving all the action. Soldiers are falling behind. On June 14, 85 percent of Nasdaq 100 stocks were above their 50-day. Now, it is merely 76 percent.
Concurrently, QQQ (PowerShares QQQ ETF) in the week ended Wednesday lost another $29 million (courtesy of ETF.com). This was the third straight week of outflows (five in last six).
Be that as it may, price is telling us otherwise. Once again, the Nasdaq 100 is approaching the upper bound of an ascending channel from January. When a similar test took place on June 20, the index retreated before finding support at the 50-day.
Russell 2000 mini-index: Currently net long 44.8k, down 6k.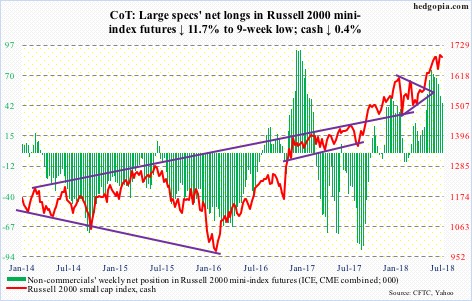
For a change, there was no breakout on the cash (1687.08). Tuesday’s intraday high of 1708.56 slightly exceeded the prior high of 1708.10 from June 20 before coming under slight pressure. Not much damage was done as buyers showed up at the 20-day. But small-caps massively lagged this week, down 0.4 percent.
In the week to Wednesday, IWM (iShares Russell 2000 ETF) lost $262 million, while IJR (iShares core S&P small-cap ETF) took in $257 million (courtesy of ETF.com).
The relative underperformance by small-caps, should it continue, can be a tell considering they were a favorite go-to sector for weeks until they seemingly hit the wall four weeks ago.
US Dollar Index: Currently net long 18.7k, up 13.
The daily lower Bollinger band on the cash (94.50) was defended Monday. As was the 50-day for a few sessions. The upper BB lies at 95.11. The weekly chart is way overbought, but the daily chart has room to once again go attack resistance at 95. The US dollar index faced resistance at that level for a whole month before retreating from an intraday high of 95.25 on June 28. This approximates crucial resistance.
The index reached an intraday high of 103.82 on January 3. Between that high and an intraday low of 88.15 on February 16, it fell 15.1 percent. A 38.2-percent retracement of this decline lies at 94.14.
VIX: Currently net short 52.8k, up 19.6k.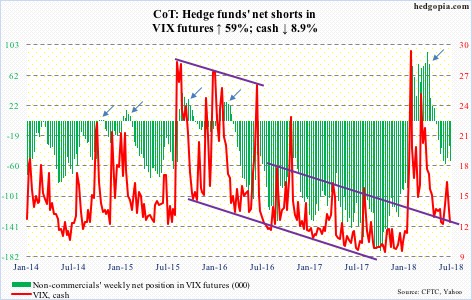
After losing the 50- and 200-day last Friday, the cash (12.18) unsuccessfully tested the averages Wednesday. Tuesday, VIX went sub-12 intraday. Ditto Friday. Both those sessions were also spinning top sessions. In all probability, VIX is getting ready to rally.
The daily lower Bollinger band lies at 10.67, which volatility bears would love to test. In ideal circumstances for them, the VIX-to-VXV ratio – at 0.838 Friday – can still nudge lower. In the past, the ratio has shown a tendency to bottom at low-0.80s/high-0.70s.
Medium term, there is a lot of optimism built into the 21-day moving average of the CBOE equity-only put-to-call ratio. It closed the week at 0.596, having earlier dropped to 0.56 on June 26. This needs to unwind. While that occurs, the ratio can rise to high-0.60s/low-0.70s, and when that unfolds equities tend to come under pressure.
Thanks for reading!
