
Following futures positions of non-commercials are as of September 4, 2018.
10-year note: Currently net short 682.8k, up 152.9k.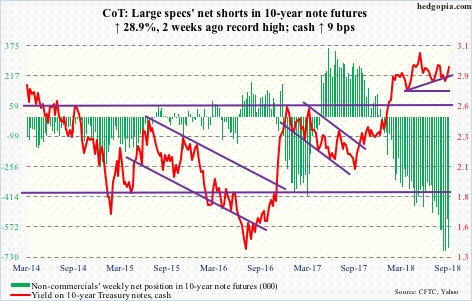
Bulls and bears went back and forth this week around the 50-day moving average until Friday when the 10-year rate (2.94 percent) rallied six basis points on the back of August’s jobs report. That said, risks of a potentially bearish head-and-shoulders formation continue to linger on, with the neckline around 2.75-2.8 percent, which was tested and defended last month. In the midst of all this, daily Bollinger bands are narrowing. At some point, they begin to widen, releasing suppressed energy. Rates in this event can go either way – up or down. Non-commercials, who are neck-deep in net shorts in 10-year note futures, better hope it is not to the downside. Risks of a short squeeze are real.
30-year bond: Currently net short 40.4k, up 34.7k.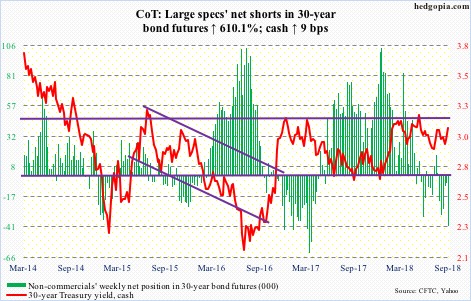
Major economic releases next week are as follows.
The NFIB small business optimism index (August) and JOLTS (July) will be reported Tuesday.
Small-business job openings rose a point month-over-month in July to 37, a new record.
Non-farm job openings in June increased 3,000 m/m to 6.66 million. A record high 6.84 million was recorded in April.
August’s PPI is scheduled for Wednesday. Producer prices were unchanged in July m/m and advanced 3.3 percent in the 12 months to July. Over the same time period, core PPI rose 0.3 percent and 2.8 percent, respectively.
Thursday has August’s CPI on tap. In July, both headline consumer prices and core CPI rose 0.2 percent m/m. In the 12 months through July, they increased 2.9 percent and 2.4 percent, in that order.
Retail sales (August), industrial production (August), and University of Michigan’s consumer price index (September) are on the docket Friday.
Retail sales in July grew 6.4 percent year-over-year to a seasonally adjusted annual rate of $507.5 billion. This was the fastest growth rate since February 2012.
Capacity utilization inched down 0.1 percent m/m in July to 78.1 percent. April’s 78.3 percent was the highest since February 2015.
Consumer sentiment declined 1.7 points m/m in August to 96.2. Sentiment has shifted lower since peaking at 101.4 in March, which was the highest since January 2004.
Crude oil: Currently net long 623.4k, up 15.5k.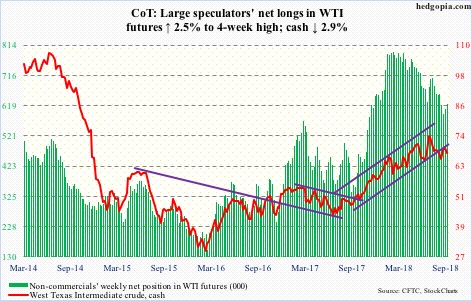
Tuesday, fears of Hurricane Gordon disrupting oil and gas operations in the Gulf caused spot West Texas Intermediate crude ($67.75/barrel) to rally 2.3 percent intraday but only closed up 0.1 percent, resulting in a huge long-legged doji. The intraday high of $71.40 in that session can potentially form the right shoulder of a head-and-shoulders pattern. The neckline lies around $64, which was defended mid-August.
The EIA report for the week of August 31 showed US crude production remained unchanged at 11 million barrels/day. Refinery utilization inched up three tenths of a percentage point to 96.6 percent. Crude stocks fell 4.3 million barrels to 401.5 million barrels. There is 22.6 days of supply of crude oil – the lowest since January 2015. The report was published Thursday due to holiday, and the crude could not rally on this news, dropping 1.4 percent in that session. The report also showed stocks of both gasoline and distillates increased – up 1.8 million barrels and 3.1 million barrels to 234.6 million barrels and 133.1 million barrels, respectively. Crude imports rose 229,000 b/d to 7.71 mb/d.
E-mini S&P 500: Currently net long 162.2k, up 17.8k.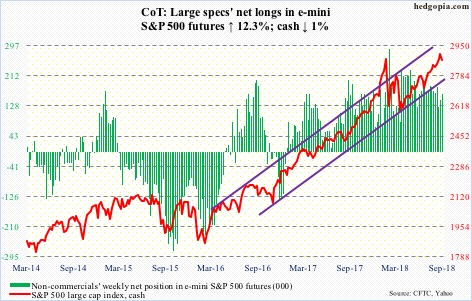
Two weeks ago, the cash (2871.68) surpassed the prior high of 2872.87 reached on January 26. It then proceeded to rally to 2916.50 seven sessions ago to test seven-month channel resistance, where sellers showed up. Thursday and Friday, the 20-day was tested, loss of which can accelerate selling. On August 15, bulls defended breakout retest at 2800. A trend line drawn from early April also extends there. The 50-day lies at 2827. This range is a must-save for the bulls.
Investors Intelligence bulls this week rose four-tenths of a percentage point week-over-week to 60 percent – the highest level in 31 weeks. Nonetheless, the last time the bulls-to-bears ratio printed four or higher was late January when the S&P 500 large cap index was about to retreat for a quick double-digit decline. Leading up to that, bulls:bears remained at four or above for 17 consecutive weeks (including two readings of 3.95 and 3.99). Now, despite new highs in the index, it is nowhere near what it was back then. Bears view this as longs having spent up all their energy. Bulls on the other hand argue there is more left in the tank. Ultimately, flows will decide, despite what surveys say.
In the week to Wednesday, as per ETF.com, IVV (iShares core S&P 500 ETF) and VOO (Vanguard S&P 500 ETF) respectively gained $3.3 billion and $3.9 billion, but this was more than offset by outflows of $9.1 billion from SPY (SPDR S&P 500 ETF). In the same week, US-based equity funds (including ETF’s) lost $7.2 billion (courtesy of Lipper.com). Year-to-date, these funds are now down $1.3 billion.
Euro: Currently net long 8k, up 15.2k.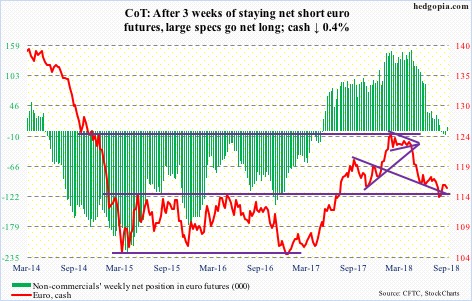
Support at $115-plus on the cash ($115.71) was once again tested Tuesday, and held. This has proven to be an important level for nearly four years now. The 50-day is flattish, and this is where euro bulls and bears are currently fighting a tug of war. The former will have increased their odds if they could take out a falling trend line from June around $116.75. There is room for oversold weekly indicators to continue to unwind.
Gold: Currently net short 13.5k, up 10.4k.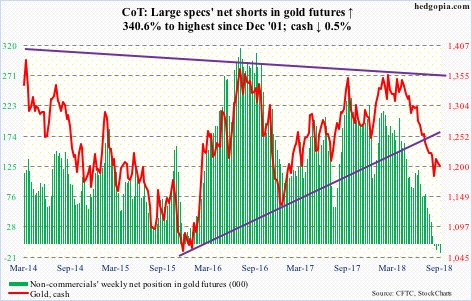
Gold bugs Thursday were once again denied at support-turned-resistance of $1,213-ish. But at the same time, since dropping intraday to $1,167.10 on August 16, the cash ($1,200.40/ounce) has made higher lows, with more or less sideways action since. Recapturing the aforementioned level will go a long way in improving longs’ prospects, who are holding their ground despite non-commercials’ continued selling. Plus, flows have not improved.
In the week through Wednesday, GLD (SPDR gold ETF) lost another $500 million. In the last 19, the ETF had one positive week, for a cumulative loss of $5 billion (courtesy of ETF.com). IAU (iShares gold trust) in the same week gained $58 million – its second consecutive positive week in 16.
Nasdaq 100 index (mini): Currently net long 44.6k, up 7.2k.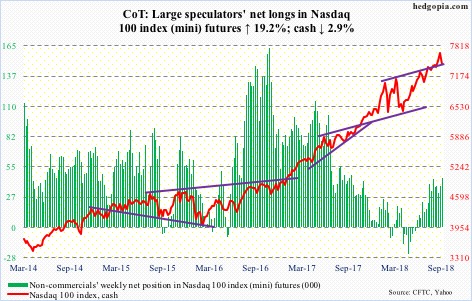
On August 30, the cash (7430.26) rose to a new all-time high of 7691.10 before retreating. The rejection came at seven-month channel resistance (attached chart does not portray this well as it uses closing prices). Nearest support at 7500 is gone. Both Thursday and Friday, the Nasdaq 100 dropped intraday to just north of 7400 to test a rising trend line from early April. After this, there is horizontal support at 7300. By the time this support is tested – let alone lost – shorter-term averages would have decidedly turned lower, which will raise the odds of overbought weekly indicators continuing to unwind.
Longs currently do not envision this scenario. QQQ (Invesco QQQ Trust) gained $822 million in the week ended Wednesday. This was the third consecutive week of inflows totaling $2 billion (courtesy of ETF.com).
Russell 2000 mini-index: Currently net long 8.4k, up 2.6k.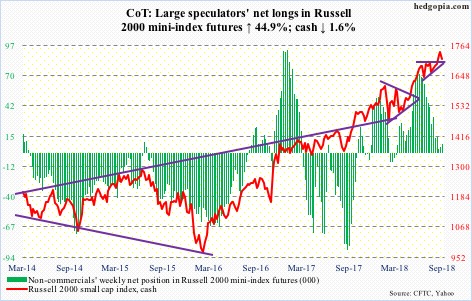
After three weeks of inflows, IWM (iShares Russell 2000 ETF) and IJR (iShares core S&P small-cap ETF) in the week ended Wednesday both saw outflows, respectively down $104 million and $78 million (courtesy of ETF.com).
The cash (1713.18) has been under pressure since rising to 1742.09 intraday last Friday. This followed a breakout 13 sessions ago. Retest took place Friday, a long-legged doji session. A rising trend line from early February extends there as well. Bulls cannot afford to lose this. Weekly conditions are way overbought.
US Dollar Index: Currently net long 33.5k, down 1.1k.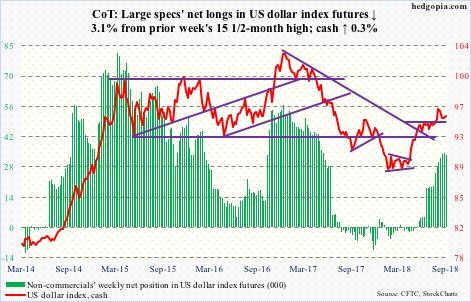
Rallies struggle to hold. Both Tuesday and Wednesday in particular, the cash (95.33) produced candles with long upper shadows, right above the 50-day (94.91), which approximates support at 95-plus. Bulls’ inability to hold this level can in due course mean overbought weekly conditions will continue to unwind.
VIX: Currently net short 127.1k, up 13.7k.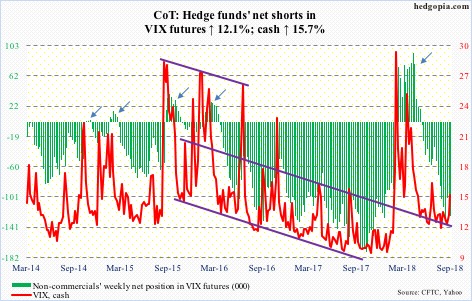
On the weekly chart, the cash (14.88) just developed a potentially bullish crossover. The last time there was one such crossover was in January. This week, VIX rose 15.7 percent. There is plenty of room for it to continue to rally, should weekly conditions begin to dictate action.
In the meantime, the 21-day moving average of the CBOE equity-only put-to-call ratio (0.617) has been under upward pressure since bottoming at 0.605 on August 30. If past is prologue, the ratio can rise to high-0.60s/low-0.70s before oversold conditions are taken care of.
Thanks for reading!
