
Following futures positions of non-commercials are as of October 16, 2018.
10-year note: Currently net short 616k, down 6.5k.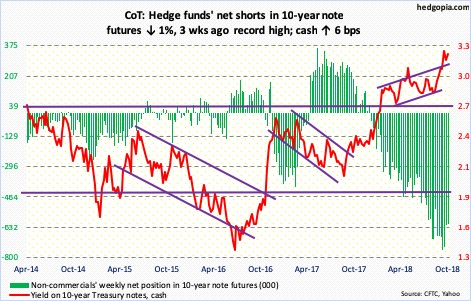
Three weeks ago, non-commercials were net short 756,316 contracts in 10-year Treasury note futures – a record. They have since reduced their holdings by north of 140,000 contracts. This did have an impact on the 10-year rate (3.2 percent), which dropped intraday from 3.25 percent on the 5th to 3.13 percent on the 11th. But bond bears are not giving up easy. Last week’s low defended the October 3rd breakout past the mid-May high of 3.12 percent. This level goes back to at least June 2003. Thus far, the bears should be heartened by defense of this resistance-turned-support. But they have to increasingly grapple with the overbought conditions rates find themselves in, the weekly in particular. Bulls would have significantly increased their odds if they can push rates under the aforementioned 3.12 percent. This can potentially tempt non-commercials to continue to cover their shorts.
30-year bond: Currently net short 103.9k, down 34.4k.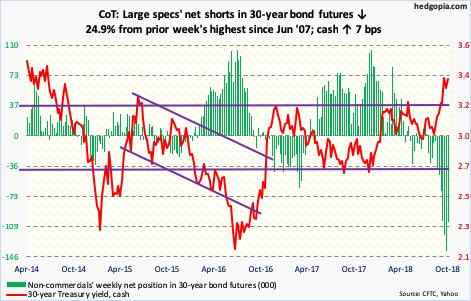
Major economic releases next week are as follows.
New home sales for September are due out Wednesday. Sales increased 3.5 percent month-over-month to a seasonally adjusted annual rate of 629,000 units. Last November’s 712,000 was the highest since 727,000 in October 2007.
Durable goods orders for September are due out Thursday. In August, orders for non-defense capital goods ex-aircraft – proxy for business plans for capex – jumped 7.1 percent year-over-year to $69.2 billion (SAAR), but fell 0.9 percent m/m.
Friday brings GDP (3Q18, 1st estimate) and University of Michigan’s consumer sentiment index (October, final).
Real GDP expanded 4.2 percent in 2Q. This was the fastest pace in 15 quarters. As of Wednesday, the Atlanta Fed’s GDPNow model forecasts 3.9-percent growth in 3Q.
Preliminarily in October, consumer sentiment fell 1.1 percentage points m/m to 99. March’s 101.4 was the highest since January 2004.
Crude oil: Currently net long 543.5k, down 29.8k.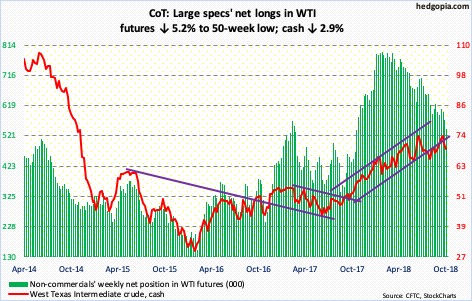
The EIA report for the week of October 12 was a mixed bag. US crude production fell 300,000 barrels per day to 10.9 million b/d. Stocks of gasoline and distillates respectively dropped two million barrels and 827,000 barrels to 234.2 million barrels and 132.6 million barrels. Crude stocks, however, increased 6.5 million barrels to 416.4 million barrels. Crude imports rose 218,000 b/d to 7.6 mb/d. Refinery utilization was unchanged at 88.8 percent. Oil traders focused on the negatives. For the week, spot West Texas Intermediate crude ($69.28/barrel) lost 2.9 percent.
The crude was already in a downward momentum, having peaked on the 3rd at $76.90. With the drop the past couple of weeks, daily conditions are getting oversold. The 200-day moving average lies at $67.28. Further, around $68 lies trend-line support from last June. Thursday’s low was $68.53.
E-mini S&P 500: Currently net long 226.8k, down 29k.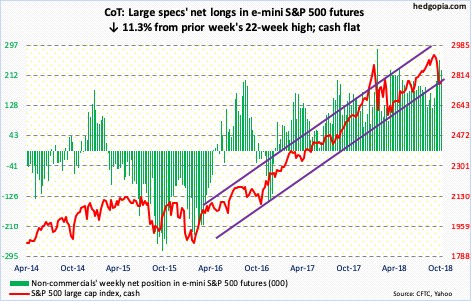
The cash (2767.78) sustained quite a bit of damage in the prior two weeks. Shorter-term averages are still dropping. Bulls put their foot down last week, followed by a strong showing Tuesday this week, but sellers showed up at the 10-day Wednesday through Friday. Plus, resistance at 2800 held. This area also represents the underside of a broken February 2016 rising trend line. Hence its significance.
As far as flows were concerned, bulls struggled to make their presence felt. In the week to Wednesday, US-based equity funds (including ETF’s) lost $17.5 billion (courtesy of Lipper.com). In the same week, $12.3 billion was withdrawn from SPY (SPDR S&P 500 ETF), even as IVV (iShares core S&P 500 ETF) pulled in $325 million and VOO (Vanguard S&P 500 ETF) $335 million (courtesy of ETF.com).
Euro: Currently net short 29.3k, up 13.2k.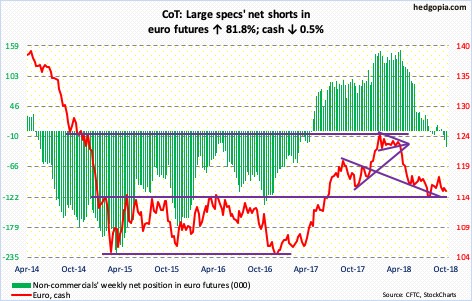
Four weeks ago, the cash ($115.21) was rejected at just north of $118. That is about where the underside of a broken trend line from early 2017 lied. Since that rejection, the currency has struggled.
This week, euro bulls recaptured the 50-day both Monday and Tuesday intraday, only to finish lower by close. In the following sessions, support at $115-plus was lost. If the weekly takes over, the euro can continue lower. In this scenario, the mid-August low of $113.01 will have gained significance. In fact, the currency dropped to $113.42 intraday Friday before buyers showed up to finish with a hammer.
Gold: Currently net long 17.7k, up 55.8k.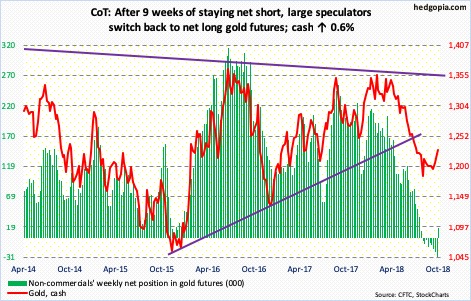
Since the 2.9-percent jump Thursday last week, the cash ($1,228.70/ounce) has pretty much gone sideways, with resistance at $1,240-ish. Three of the five daily candles this week were long-legged doji’s – at or just under the upper Bollinger band. The daily is beginning to get overbought. Should the metal come under pressure, what happens around $1,213-ish will be a big tell. This broken-support-turned-resistance was recaptured last week.
Encouragingly for gold bugs, for a second week running, flows into GLD (SPDR gold ETF) were positive. In the week through Wednesday, the ETF gained $390 million. In the same week, IAU (iShares gold trust) took in $61 million (courtesy of ETF.com).
Nasdaq 100 index (mini): Currently net long 372, down 10.9k.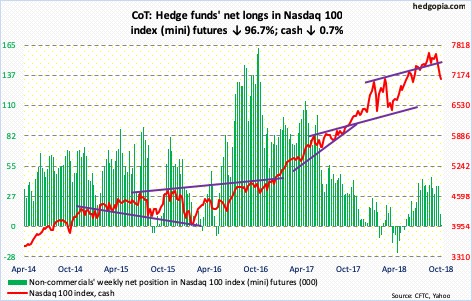
The rally Tuesday and Wednesday off of the 200-day drew sellers right where they were expected to show up. For the past four months, 7300 has proven to be an important level, which was broken during the recent selloff. Wednesday, the cash rallied to 7311.85 intraday before sellers dominated action.
In the week ended Wednesday, QQQ (Invesco QQQ Trust) attracted $582 million (courtesy of ETF.com). But this obviously was not enough. Concurrently, non-commercials massively cut net longs to a bare minimum.
Bulls got their relief rally early in the week, and it looks like more work is needed before the daily in particular proceeds to unwind oversold conditions. The 200-day (7058.20) is a stone’s throw away. In a worse-case scenario, last week’s intraday low of 6892.89 needs to hold.
Russell 2000 mini-index: Currently net short 78.3k, up 30.3k.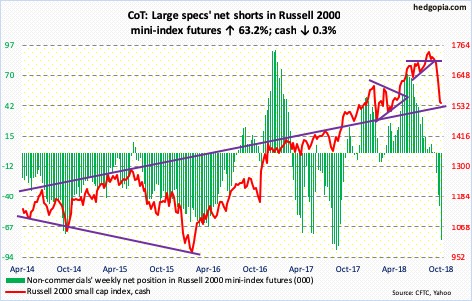
Non-commercials aggressively added to net shorts. In the week to Wednesday, IWM (iShares Russell 2000 ETF) lost $1.6 billion and IJR (iShares core S&P small-cap ETF) $38 million (courtesy of ETF.com). Shorts/sellers were probably encouraged by last week’s 5.2-percent decline. This week, the cash (1542.04) shed 0.3 percent. As was the case with other major US indices, the Russell 2000 was unable to hang on to Tuesday’s gains. Selling accelerated just under 1600. Last week, it sliced through a rising trend line from February 2016, lost major horizontal support at 1610-ish and lost both 50- and 200-day. Small-cap bulls cannot afford to lose support at 1515-1530. Friday last week, the index fell to 1530.98 intraday before bids showed up for a long-legged doji session.
US Dollar Index: Currently net long 37.9k, up 167.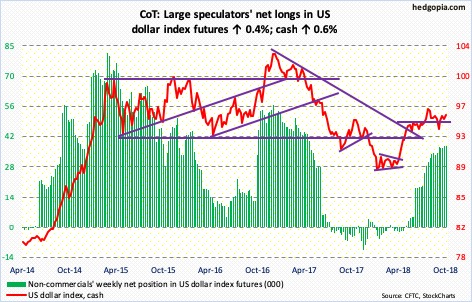
A bull-bear duel around 95-plus on the cash (95.44) continues. The 50-day (95.04) lies right there. Month-to-date, rally attempts were denied several times at 95.80-ish, including Friday. A breakout opens the door for a test of the mid-August high of 96.87.
VIX: Currently net short 33k, down 80.6k.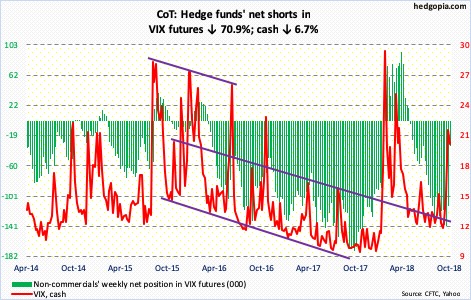
Last week’s potentially spike reversal was followed by more downward pressure on the cash (19.89), but at the same time volatility bulls showed willingness to buy the dips. VIX dropped to 17.06 Wednesday. So far, they have defended support at 16-17.
In the very near term, there is room for VIX to push higher. Seven sessions ago, it reversed after reaching an intraday high of 28.84. Amidst all this, both the 50- and 200-day are rising, although ever so slightly. This could be an important development medium- to long-term.
Thanks for reading!
