
Following futures positions of non-commercials are as of November 6, 2018.
10-year note: Currently net short 539.2k, up 36.3k.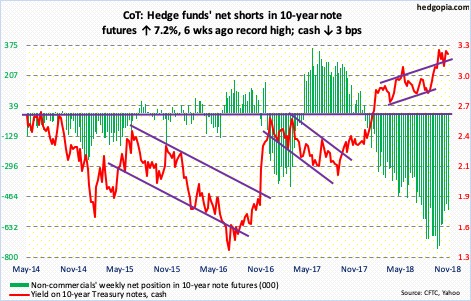
In January, the 10-year Treasury rate broke out of 2.62 percent. Then in September, it took out 2.95 percent, followed by a break out of 3.11 percent early October. Things could not evolve any better for bond bears – breakout, sideways/digestion, and breakout again. Once again, yields are attempting another breakout.
On October 5, the 10-year (3.19 percent) began retreating after touching 3.25 percent – the highest since May 2011. This Thursday, it rallied to 3.24 percent, before coming under slight pressure. Near term, yields are likely to come under pressure, and that likely sets up a bond bull-bear duel. On the 26th last month, the 10-year found support just under the daily lower Bollinger band, which now lies at 3.08 percent. The 50-day (3.1 percent) is right above. This area also amounts to breakout retest of 3.11 percent.
30-year bond: Currently net short 71.2k, down 10.8k.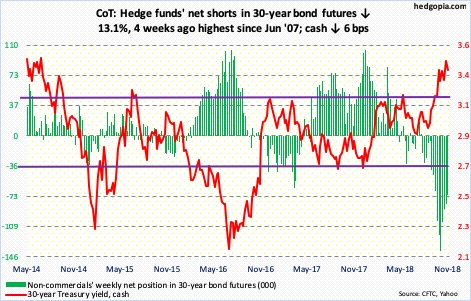
Major economic releases next week are as follows.
The NFIB optimism index for October comes out Tuesday. Small-business optimism fell nine-tenths of a point in September from August’s record 108.8.
The consumer price index for October is due out Wednesday. In September, both headline CPI and core CPI inched up 0.1 percent m/m. In the 12 months to September, they respectively rose 2.3 percent and 2.2 percent.
October’s retail sales are on tap Thursday. Sales grew 4.7 percent year-over-over in September to a seasonally adjusted annual rate of $509 billion.
Friday brings industrial production (October) and the Treasury International Capital data (September).
Capacity utilization in September increased 3.2 percent y/y to 78.1 percent. In the current cycle, utilization is yet to break 80 percent. In November 2014, it reached as high as 79.6 percent.
On a 12-month rolling total basis, foreigners in August purchased $16.4 billion in US equities, much weaker than $135.7 billion in January.
Crude oil: Currently net long 458.8k, down 45.4k.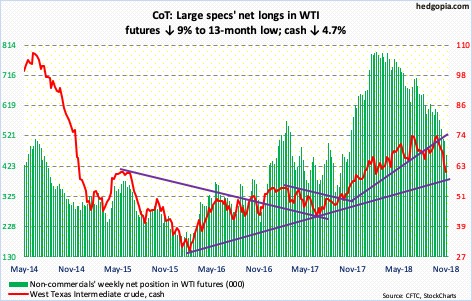
Spot West Texas Intermediate crude ($60.19/barrel) fell in every single session this week. That was also the case last week. From October 3, it fell from $76.90 in nearly a straight fashion, losing one after another support. Friday, as it dropped to $59.26 intraday, it just about tested a rising trend line from February 2016. Back then, the crude bottomed at $26.05, before beginning a multi-year rally until the high of early last month. This is a make-or-break support for oil bulls. Daily momentum indicators are extremely oversold. In the event of a rally, broken-support-turned resistance rests at $64-plus.
Trader sentiment is getting hit amidst concerns of oversupply. Non-commercials’ net longs are at a 13-month low. The US, Russia and Saudi Arabia are pumping at/near record levels. US sanctions on Iran are now in place, but at the same the Trump administration has temporarily granted exemptions to eight countries.
For the week of November 2, US crude production rose 400,000 barrels per day to 11.6 million b/d. Crude imports increased 195,000 b/d to 7.5 mb/d. Crude stocks continued to rise, up 5.8 million barrels to 431.8 million barrels. Since mid-September, crude stocks have gone up 37.7 million barrels. Gasoline stocks grew as well, up 1.9 million barrels to 228 million barrels. Distillate stocks, however, dropped 3.5 million barrels to 122.9 million barrels. Refinery utilization increased six-tenths of a percentage point to 90 percent.
E-mini S&P 500: Currently net long 198k, down 65k.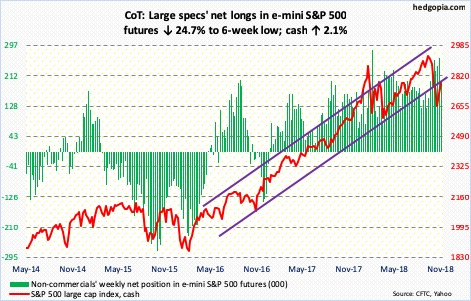
For the second time since mid-October, the cash (2781.01) was denied at just north of 2800. Wednesday’s post-election gap-up rallied the S&P 500 to 2815.15, and that was it. By Friday, it was testing the 200-day moving average, which is now ever so slightly dropping.
Inability to take out broken-support-turned-resistance at 2800, which also approximates the underside of a broken rising trend line from February 2016, is a sign bears are beginning to gain conviction. Right here also lies Fibonacci 0.618-retracement resistance of the drop between September 21 and October 29.
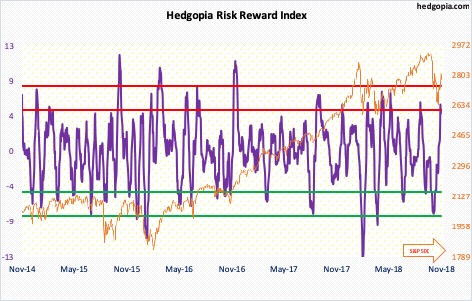
For now, the consolation for bulls is that the 200-day was defended during Friday’s 0.9-percent down session. But the daily chart seems to be itching to go lower. Our own Hedgopia Risk Reward Index just entered the red zone. Bulls have their work cut out – at least near term.
In the week to Wednesday, US-based equity funds (including ETF’s) lost $8.5 billion (courtesy of Lipper.com). SPY (SPDR S&P 500 ETF) lost $2.3 billion, even as IVV (iShares core S&P 500 ETF) took in $276 million and VOO (Vanguard S&P 500 ETF) $481 million (courtesy of ETF.com).
Euro: Currently net short 46.8k, up 14.2k.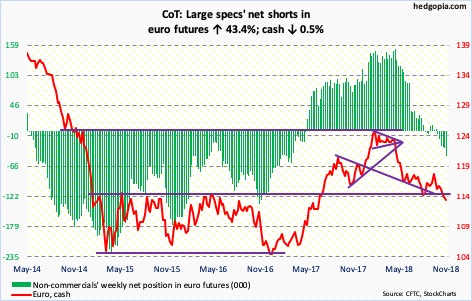
Major resistance at $115-plus was just about tested Wednesday as the cash ($113.38) rallied to $114.93 intraday but only for sellers to use that as an opportunity to lighten up/exit. As a result, the mid-August low of $113.01, which was successfully tested on October 31, has once again gained significance.
Gold: Currently net long 19k, up 5.8k.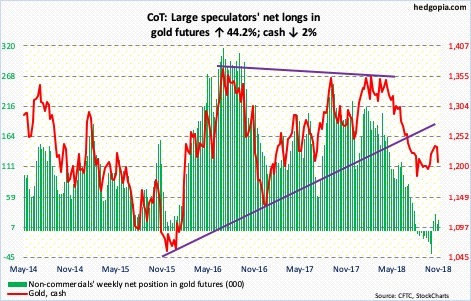
Gold bugs were unable to blast through $1,240-ish. They hammered on it starting mid-October, including the first three sessions this week, but unsuccessfully. The cash ($1,208.60/ounce) fell 1.4 percent Friday to lose the 50-day as well as $1,213-ish. The latter has proven to be an important level for nearly four months now.
Worse near term, there is support at $1,180-ish.
In the week ended Wednesday, GLD (SPDR gold ETF) attracted $43 million, but that was due to one good session, with Thursday last week gaining $264 million and the remaining four sessions all in the red. IAU (iShares gold trust ETF) has seen no activity for 10 straight sessions (courtesy of ETF.com).
Nasdaq 100 index (mini): Currently net short 592, down 10.8k.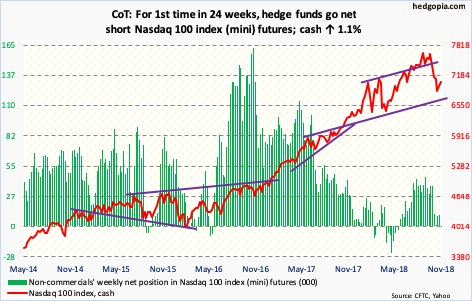
On October 17, rally attempts were rejected just north of 7300 on the cash (7039.15). The subsequent selloff bottomed at 6574.75 on the 29th, leading to a rally which culminated Wednesday just north of 7200, for a lower high.
Friday, the Nasdaq 100 sliced through the 200-day to drop 1.7 percent; it could have been worse had bulls not defended the 10-day. On the daily chart, there is room for the index to continue lower.
For the first time in 24 weeks, non-commercials went net short. In the week through Wednesday, QQQ (Invesco QQQ Trust) lost $1.9 billion (courtesy of ETF.com).
Russell 2000 mini-index: Currently net short 46.9k, up 13.9k.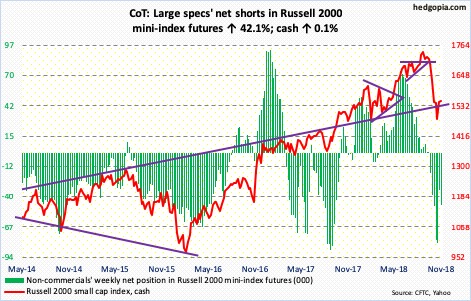
The cash (1549.49) essentially marked time this week, up only 0.1 percent. Bulls were unable to hold on to the gains, as the Russell 2000 at one point was up 2.5 percent for the week. This followed last week’s 4.3-percent jump. So either the index this week was digesting last week’s gains or this is a sign major horizontal support at 1610-ish is not going to give way easy. Perhaps it is the latter.
Thursday this week, the Russell 2000 managed to rally to 1586.17. This followed an earlier rally last month which stopped at 1598.01 on the 16th. Friday, small-cap bulls showed up at the 10- and 20-day, which are now converging. But they face an uphill task until the above resistance gets taken out. The 200-day (1616.20) lies around there as well.
In the week ended Wednesday, IWM (iShares Russell 2000 ETF) lost $1.5 billion, while IJR (iShares core S&P small-cap ETF) lost $357 million (courtesy of ETF.com). Non-commercials added to net shorts.
US Dollar Index: Currently net long 40.3k, up 759.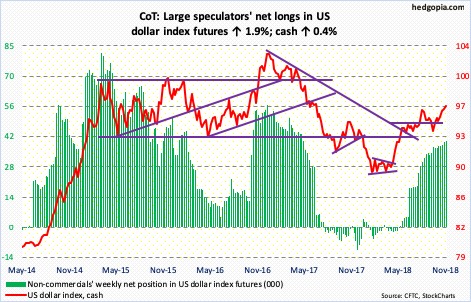
Once again Friday, dollar bulls had difficulty busting through resistance just south of 97, but are hanging in there. Mid-August, the cash (96.73) rose to an intraday high of 96.86 before reversing lower. Last week, the US dollar index rallied intraday to 96.98. This Friday, it rallied to 96.85 intraday. A breakout would add to momentum that has been in place since bottoming at 88-plus early this year.
VIX: Currently net long 13k, up 11k.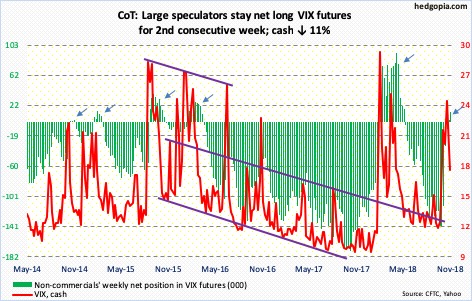
Like clockwork, the cash (17.36) began dropping as soon as non-commercials switched to net long last week. This week, they added more. Concurrently, there is room for both the VIX-to-VXV ratio and the 21-day moving average of the COBE equity-only put-to-call ratio to continue to unwind the overbought condition they are in, in which case volatility comes under more pressure. Several momentum indicators have already turned lower. The only problem is, the daily seems to want to rally. VIX is slightly above both the 50- and 200-day. Thus far, support at 15-16 has held. Thus, it is possible volatility rises in the very near term before the weekly takes over.
Thanks for reading!
