
With high-single-digit losses in major US stock indices since mid- to late-July, bulls made it clear last week they are putting their foot down. A reflex rally is probable. The 3Q earnings season begins in earnest later this week, and the bar is low. Plus, the 10-year T-yield looks tired of rallying incessantly.
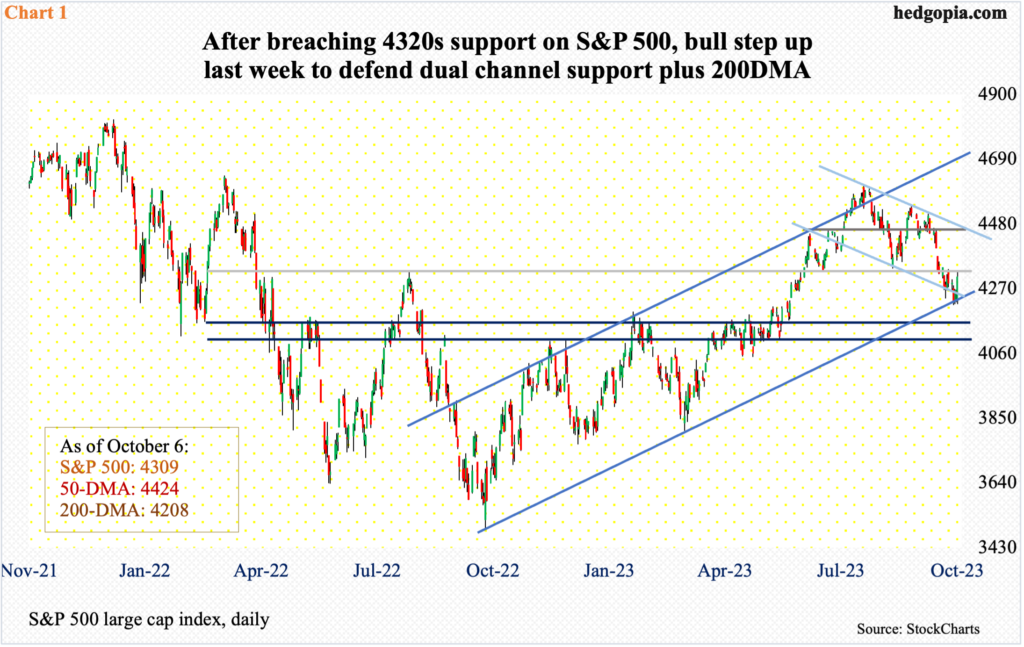
From the July 27th high (4607) through last Tuesday’s low (4216), the S&P 500 dropped 8.5 percent. Along the way, several support levels gave way, including straight-line support at 4320s. In the wake of that breakdown, the large cap index quickly lost 100-plus points.
Before things could get worse, equity bulls had an opportunity to step up, and they have. Bids showed up last week at dual channel support. Plus, the index hovered just above the 200-day moving average (4208) Tuesday through Friday before lifting off it on Friday, with the session reversing from down 0.9 percent intraday to finish up 1.2 percent. A hammer formed on the weekly.
Last October, after tumbling 27.5 percent from its all-time high from January last year, the S&P 500 bottomed. It then traded within an ascending channel, the lower bound of which was defended last week. This support also lines up with the lower bound of a descending channel from the late-July high (Chart 1).
Immediately ahead, a gap from September 21st gets filled at 4400, with descending channel resistance at 4450s. The 50-day is at 4424, which coincides with lateral resistance at 4440s. The index closed last week at 4309.
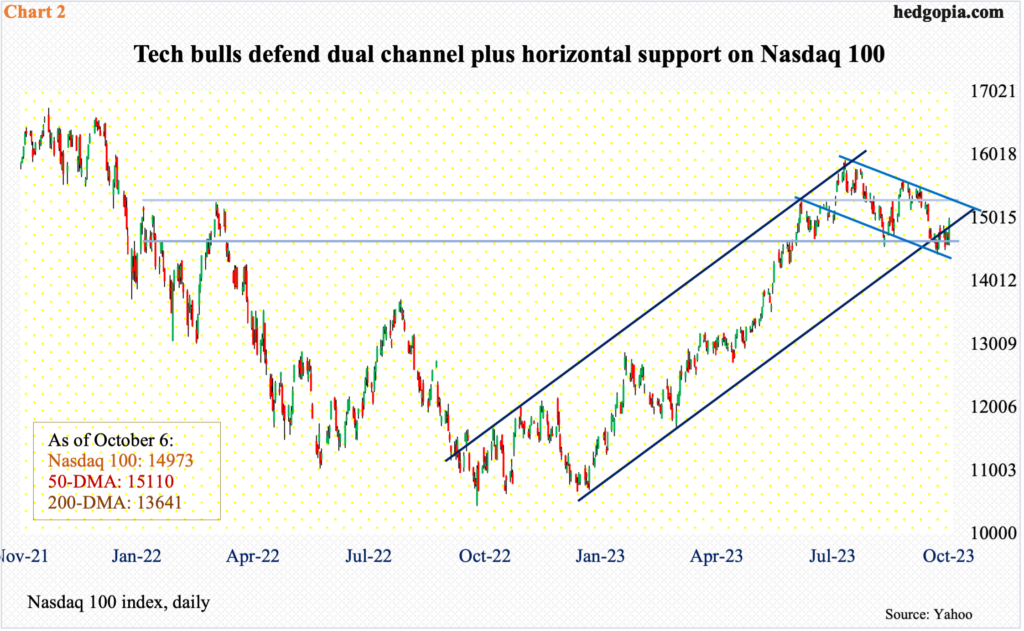
The Nasdaq 100, too, was at dual channel support, combined with a horizontal one.
In July, the tech-heavy index peaked a little earlier than the S&P 500 – on the 19th – and dropped 9.4 percent through its low on September 27th, before going sideways at the lower end of a descending channel from that high. This lines up with support at an ascending channel from last October when the index bottomed after plunging 37.7 percent from its November 2021 peak. Right around there lies horizontal support at 14700s (Chart 2).
Last Friday’s 1.7-percent jump pushed the index past shorter-term moving averages, ending the week at 14973. The 50-day lies at 15110. This is followed by trendline resistance at 15300s from the July 19th high.
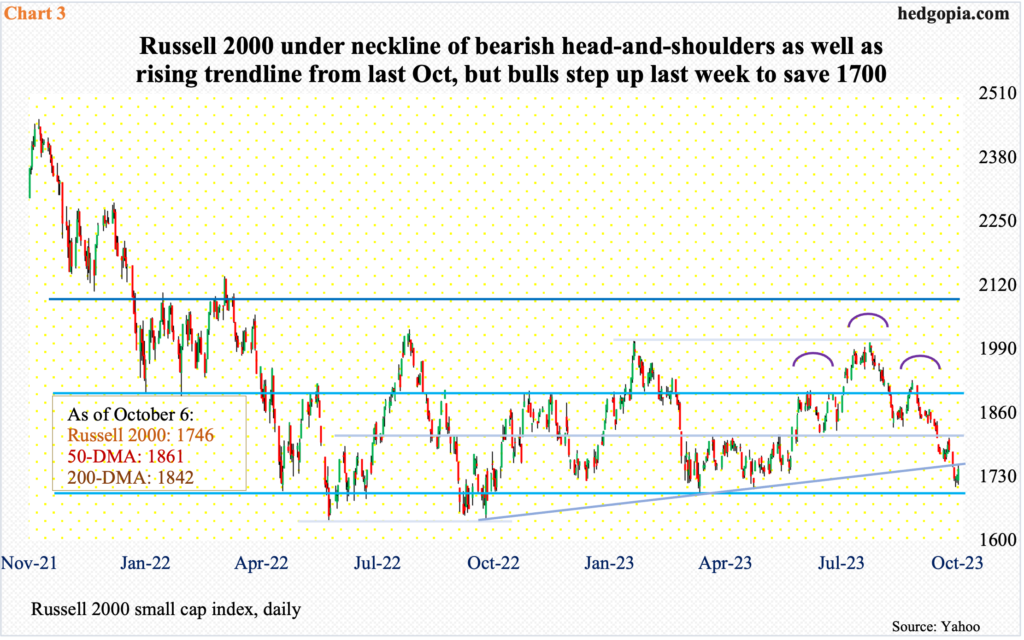
On the Russell 2000 (1746), small-cap bulls seem to have averted – at least for now – a scenario in which it drops all the way to 1600. On September 21st, the index lost 1800, which makes up the neckline of a bearish head-and-shoulders pattern. If the pattern completed, the downside risk was 1600.
But before that happened, 1700 was another level that the bears needed to recapture. This represented the bottom of a 200-point range that the Russell 2000 has been in since January last year (Chart 3). Last week, bids appeared in the last three sessions just north of 1700.
At 1750s lies resistance from a broken trendline from last October’s low. Once bulls reclaim this, the next stop is at least 1800.
In the meantime, VIX is giving out signs that volatility is ready to take a breather.
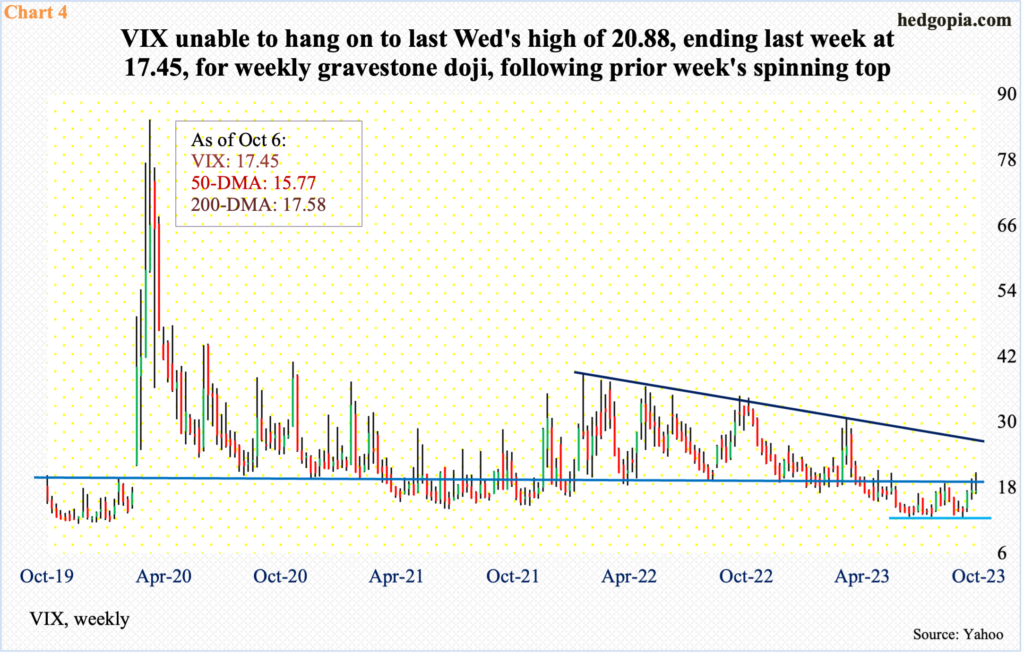
Last Tuesday, the volatility index rallied as high as 20.88 – a five-month high – but volatility bulls were unable to hang on to this; VIX closed out the week at 17.45, ending with a weekly gravestone doji, which was followed by the prior week’s spinning top (Chart 4). Horizontal resistance at 20 held.
VIX has trendline resistance from January 2022 at 27. It peaked at 38.94 back then and has consistently made lower highs since. In fact, it has made lower highs since March 2020 when VIX spiked to 85.47 and reversed. Its all-time high was recorded in October 2008 when it peaked at 89.53.
Last week’s candle looks like a spike reversal.
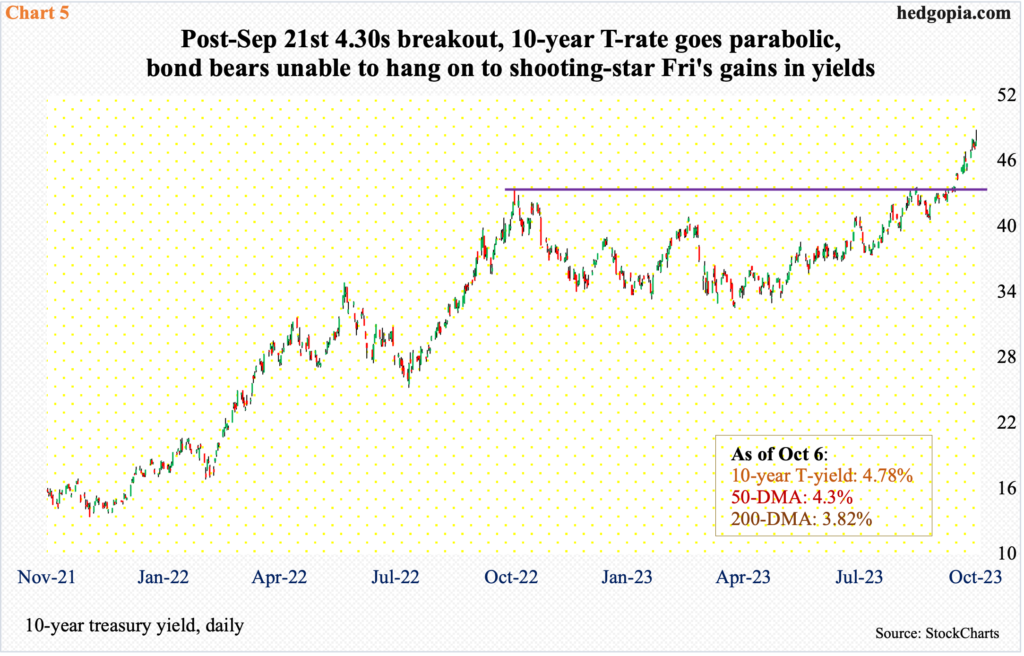
The S&P 500 gapped down 1.6 percent on September 21st. That was the session the 10-year treasury yield gapped up 13 basis points to 4.48 percent. This was an important breakout. In the next three sessions, the S&P 500 breached 4320s.
Last October, the 10-year came under pressure after reaching 4.33 percent. Early August before that, these notes were yielding 2.53 percent, and 1.13 percent in August 2021. After the October high, the 10-year came under pressure to eventually bottom at 3.25 percent early April this year.
In the second half of this August, bond bears (on price) went after the October high at least three times – all unsuccessfully. In September, there were again several attempts. The resistance held firm – until the 21st. The breakout came on the heels of a hawkish message from the Fed post-conclusion of FOMC meeting that Wednesday.
After that breakout, the 10-year continued to rally, tagging 4.89 percent intraday Friday. This was the highest yield since August 2007; back then, the 10-year was on its way down from June’s high of 5.32 percent.
Rates have clearly come a long way, rallying to multi-year highs. Bond bears, who are sitting on boatloads of paper profit, can get tempted to lock in their gains. In fact, they failed to hold on to all of Friday’s gains in yields, closing at 4.78 percent, leaving behind – in a sign of fatigue – a shooting star.
If the 10-year experienced a genuine breakout on the 21st, the next time mid-4.30s get tested, which looks imminent, bond bears should be willing to add to positions. Else, the latest move higher post-4.30s breakout will simply qualify as having resulted from stop orders getting taken out.
Given where things are, equities in general should like lower yields.
Then there is the 3Q earnings season, which begins in earnest later this week when financials report their results.
As has been customary, the bar is low.
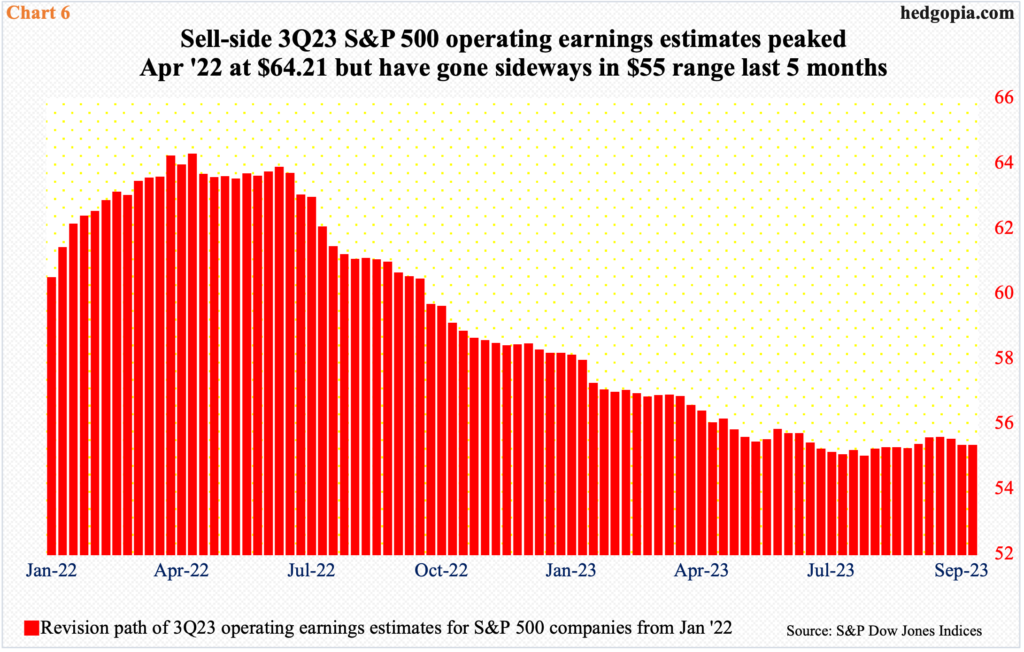
In the week to April 27th last year, the sell-side expected S&P 500 companies to ring up $64.21 in operating earnings in the September quarter. As 2022 progressed, these analysts continued to lower their numbers. The downward-revision trend continued in the early months of this year, before going sideways in the $55 range from early May (Chart 6). At the end of September, the consensus was $55.27.
The sideways revision is probably a sign that the sell-side has high conviction in their estimates but are shying away from revising upward just so the companies have a lower hurdle to jump over. This raises the odds of a favorable post-earnings reaction, particularly considering the downward pressure equities have endured the last several weeks.
Thanks for reading!
