The following are futures positions of non-commercials as of May 19, 2015. Change is week-over-week.
10-year note: The April FOMC minutes for all intents and purposes put a nail in the coffin of June rate-hike odds. At the March meeting, “several” Fed officials thought they should begin to lift off the fed funds rate in June. Fast forward six weeks to the April meeting and this had shrunk to just a “few”, with “many” thinking it unlikely.
There you have it!
Lots of economists and strategists still think September is open. If the Fed moves in September – or this year, for that matter – growth is not what will force its hand, rather inflation. True, the U.S. economy is not going gangbusters, but it is operating at a 5.4 percent unemployment rate (though the drop in unemployment is not for all the right reasons). And last November, capacity utilization stood at just under 80 percent. Yet we have zero interest-rate policy. This is a Fed focused on the wealth effect.
As far as inflation is concerned, from the PPI to import prices to average hourly earnings to the CPI, it remains subdued. Core CPI did advance 0.3 percent month-over-month in April, with year-over-year growth at 1.8 percent. However, core PCE, which is what the Fed is focused on, only rose 1.3 percent in March (April numbers are not out yet). Put it all together, the odds of no hike this year still look solid.
For the week, yields nudged higher. Non-commercials are using this as an opportunity to cut back net shorts – down 53 percent in two weeks.
Currently net short 85.8k, down 46.6k.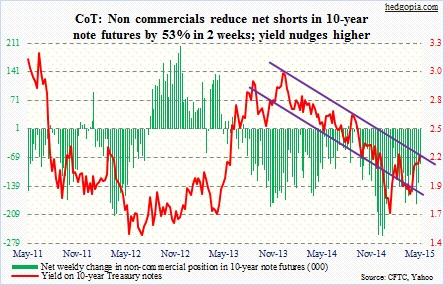
30-year bond: Next week’s economic calendar is heavy.
The advance report on durable goods for April comes out on Tuesday. Order momentum has been slipping in recent months. Orders for non-defense capital goods ex-aircraft (proxy for business capital expenditures) shrank 5.2 percent year-over-year in March, down from 11.9 percent increase as early as last September.
Also on Tuesday is new-home sales for April. March was week – sub-500,000. Existing-home sales Thursday were weaker-than-expected. The issue with both is the rapid rise in price. The median price of a new home made an all-time high of $302,700 last November (March was $277,400).
Again on Tuesday, we will get the March reading of the S&P/Cash Shiller home price index. Nationally, prices rose 4.2 percent year-over-year in February, but the rate of growth has been decelerating. The pending home sales index for April is on Thursday; this series tends to correlate with existing-home sales.
Friday is important – the second estimate of 1Q15 GDP as well as corporate profits. The latter has done very well this cycle. In 4Q14, corporate profits with inventory valuation and capital consumption adjustments were down 1.4 percent from an all-time high of $2.17 trillion in the prior quarter.
Six Fed officials are on tap, with Stanley Fischer, vice-chair, speaking twice.
If durable goods and new-home sales in particular perk up, watch out. The 30-year yield nudged higher this week, moving further past the dual resistance it faced. With that said, things look stretched on a daily chart.
Currently net long 24.8k, down 2k.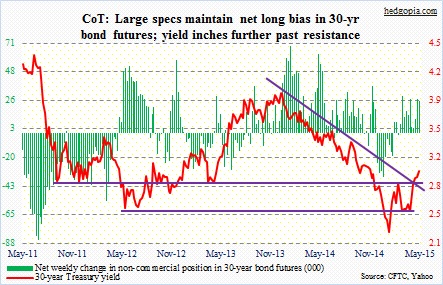
Crude oil: The duel continues. Both bulls and bears could claim victory this week. Sort of. The former was unable to take out 62, even as they successfully defended 58. For now, the WTI is range-bound – stuck between just under 62 and 58.
The news that ISIS retook Ramadi put upward pressure on the crude on Monday, but closed out the session substantially off the highs. Buyers did show up to defend 58 on both Tuesday and Wednesday. For the week, the crude was flat. Bulls’ tenacity should be commended considering the dollar rallied three-plus percent in the week.
Despite this, the probable path of least resistance remains down. A weekly shooting star two weeks ago has been followed by two back-to-back dojis.
Here is an interesting tidbit. After looking at the top 420 oil projects from around the world, Goldman finds that U.S. shale gas producers are now able to break even at an average $60/barrel, a drop of $20 over the last year. Separately, Goldman is also calling for the WTI to drop to $45 by October, so the broker may be talking its book. Nevertheless a lower breakeven is supply-friendly.
Non-commercials are not worried a bit. They raised net longs to a nine-month high.
Currently net long 366.8k, up 29k.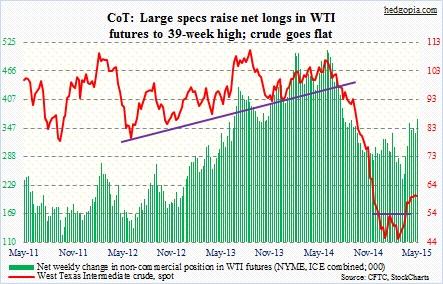
E-mini S&P 500: So we have a breakout, not one with a lot of vigor but a breakout nonetheless. Non-commercials for sure helped. In the past couple of weeks, their net shorts have gone down by 61 percent, to an 11-week low.
With this, the S&P 500 has now retraced 161.8-percent Fibonacci extension of the October 2007-March 2009 decline – always a good spot where momentum can stop/pause. When volume is light, it does not take long to get markets moving.
Some investors are taking advantage of these all-time highs. Year-to-date, U.S. stock funds have suffered $100 billion in redemptions. For the 12th week in a row, AAII bulls’ share has come in lower than 40; neutrals have been in the 40s for seven straight sessions.
A recent Bank of America Merrill Lynch survey of global fund managers showed they only held 4.5 percent of assets in cash. This is low. Typically, funds tend to hold between three and five percent in cash to meet redemptions. The data point is in line with the weekly NAAIM survey, which this week dropped to 68, versus 91 three weeks ago and a 10-week average of 78.
So who is buying? How about corporate buybacks, for one?
QCOM this week said it plans to accelerate its stock buyback program. It has a goal of buying back $10 billion shares by March next year, and recently did a $10-billion debt offering. QCOM is just an example. Going by January-April numbers, U.S. corporate bond issuance is on track for $1.7 trillion this year, which, if comes to pass, will be yet another record. During 2009-2014, U.S. corporations cumulatively issued $7.2 trillion.
Currently net short 31k, down 41.8.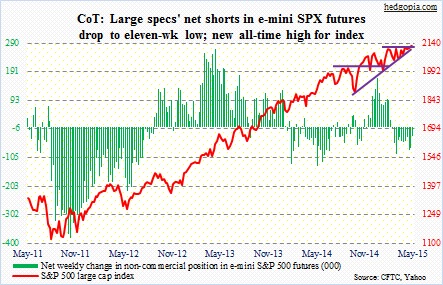
Euro: Benoit Coeure, ECB executive board member, said the ECB may expand its bond buying program this month and next because it fears low liquidity during the summer months. It seems they are not happy to see 10-year German bunds shoot from 0.05 percent to 0.8 percent in no time (currently 0.6 percent).
He spoke Monday. The euro fell four out of the five sessions, and has lost support at 110.3, though ever so slightly. The 50-day moving average is less than a percent away, and in all probability will be tested.
Non-commercials’ net shorts are 26 percent below end-March all-time highs, but remain sizable.
Currently net short 168.3k, down 10.6k.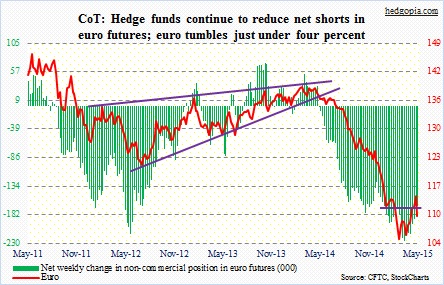
Gold: Investors took advantage of the recent uptick in the price of gold. In the seven trading sessions to Monday, outflows from GLD, the SPDR gold ETF, totaled 21 tonnes; the ETF’s holdings got cut to 718 tonnes (courtesy of Reuters).
Non-commercials continue to maintain a positive bias. In fact, they raised net longs to a 12-week high. The metal has lost its 200-day moving average, but remains above the 50-day, which is curling up.
Currently net long 122.6k, up 45.2k.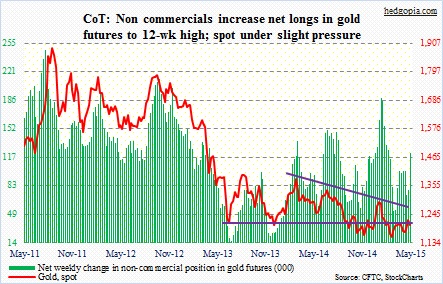
Nasdaq 100 index (mini): The 4480 level was tested once mid-week and held. For the week, the index rose 0.7 percent, with AAPL rising nearly three percent. The company has a 15 percent weight in the index. For the month, AAPL is up 6.4 percent, versus 2.6 percent for the index.
Simply put, as AAPL goes, so goes the Nasdaq 100.
Non-commercials added to their net longs, but remain 38 percent below end-April highs.
Currently net long 55.2k, up 8.9k.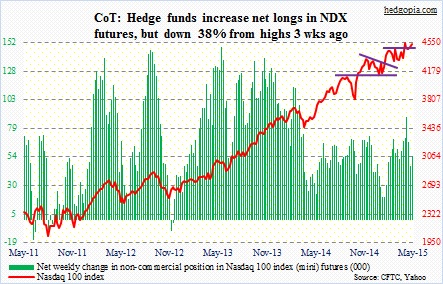
Russell 2000 mini-index: At first glance, the index did just fine this week – up 0.7 percent versus up 0.2 percent for the S&P 500. In fact, since late April the ratio of small caps (represented by the Russell 2000) to large-caps (represented by the S&P 500) has stopped going down.
Nonetheless, the Russell 2000 has already broken the October 2014 trendline. Rallies look tentative. The mid-April high is yet to be tested. Near-term, this thing is itching to go lower.
Last week, non-commercials raised net shorts to a nine-week high, and are staying with them after cutting back a little.
Currently net short 28.1k, down 3.8k.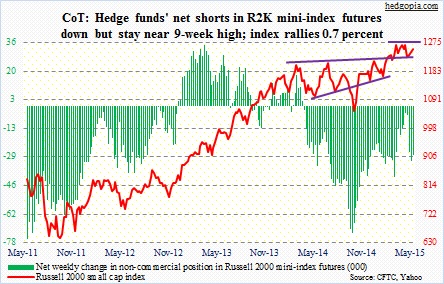
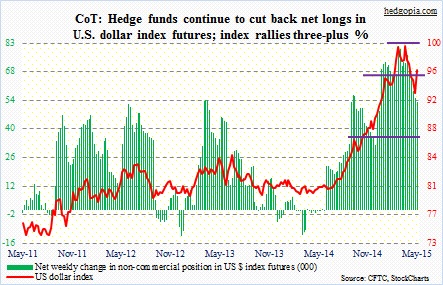
U.S. Dollar Index: Monday and Tuesday combined, the index rallied 2.3 percent, making up nearly three-fourths of the move for the week. The rally in the first two sessions was not enough to lure non-commercials into adding to net longs. Instead, they cut back, but just a tad. They have, however, reduced their holdings by 34 percent from the peak 11 weeks ago. Net longs peaked on March 10. The index peaked a weak later. So these traders’ long bias has acted like oxygen to the dollar rally. For it to continue, we need a U-Turn from these traders.
Currently net long 53.5k, down 1.9k.
VIX: For the first time this year, spot VIX got a taste of the 11 handle on Friday, but snapped back to close above 12. Non-commercials continue to maintain a rather large net short exposure, which in recent weeks has been a profitable trade. The so-called fear index has been stuck with the 12 handle for five consecutive weeks.
Elsewhere in the options pit, there has been a pickup in June call activity, although most of these are call spreads, not naked calls.
Currently net short 62.3k, down 0.621k.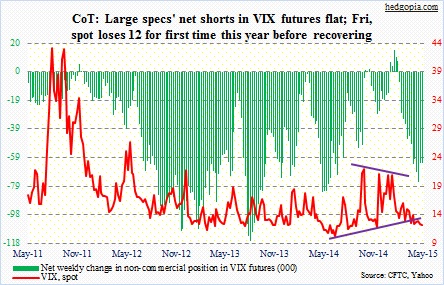
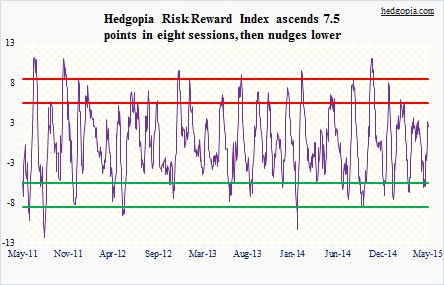
Hedgopia Risk Reward Index