
The last time spot VIX closed under 13 for three consecutive sessions was in early August last year. In fact, VIX back then stayed sub-13 for four straight sessions ended August 3rd, and registered three more sub-13 readings by August 14th. By the 17th, the S&P 500 peaked, dropping north of 11 percent in the next six sessions.
History seldom repeats itself, but it may rhyme.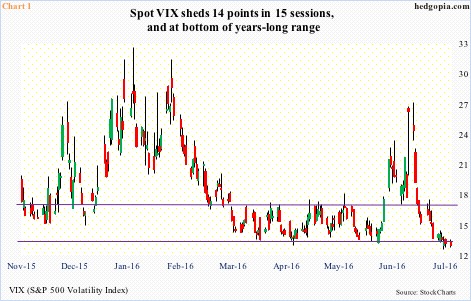
Since the June 27th intra-day high of 26.72, spot VIX has come a long way – on the downside. For the past three sessions, it has remained below 13 (Chart 1). The 10-day moving average is still dropping, but could begin to go flat if the current sideways pattern in VIX continues for several more sessions. This is a scenario that bodes well for volatility bulls.
For all that, here is a scenario that will be cherished by equity bulls. It may be a week or two before VIX begins to look oversold on a weekly basis. So at best, it goes sideways from here. At worst, it goes lower. Even in August last year, VIX did trade sub-11 in one session (on the 5th). Currently, the Bollinger bands are so wide one can drive a truck through them, with the lower end at 9.02. Several times in the past, after remaining suppressed, VIX has shown a tendency of finding support at the lower Bollinger band.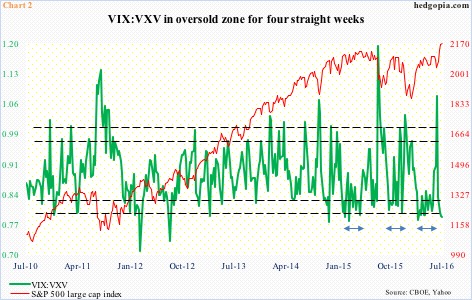
In the second scenario, the VIX-to-VXV ratio continues to remain suppressed for several more weeks. Since February last year, there have been three occasions in which the ratio has gone sideways for extended periods (bi-directional arrows in Chart 2). The latest one lasted 12 weeks, between the middle of March through the end of May this year. The current count is four, with last week as well as so far this week sub-0.80.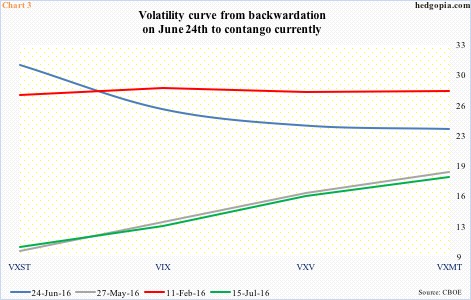
One possible knock against the second scenario is that shorter-term volatility is beginning to attract bids. On June 24th, VXST, which measures expectations for nine-day future volatility, shot up to 30.71 (31.34 intra-day), before coming under pressure. In Chart 3, the June 24th curve is denoted by the blue line, with VIX (30 days), VXV (three months), and VXMT (six months) progressively lower, resulting in steep backwardation. For reference, the red line shows how the curve looked on February 11th, when stocks bottomed.
Fast forward to Friday last week, the volatility curve looks a lot different – from steep backwardation to steep contango. The green line in Chart 3 is identical to the one on May 27th. In other words, the futures price is much higher than the spot price. When the steepness in contango gets unwound, the shorter end of the curve rallies faster than the long end, which tends to put stocks under pressure.
Too soon to say if we are beginning to see early signs of this, but yesterday, both RVX, the Russell 2000 volatility index, and VXN, the Nasdaq 100 volatility index, managed to attract bids even as their respective indices rallied.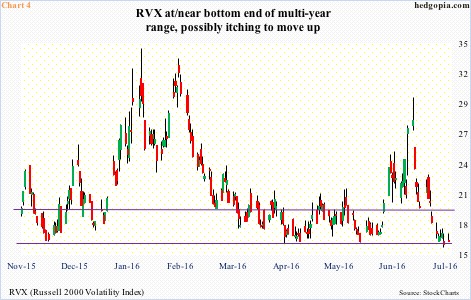
As is the case with VIX, RVX is at/near the bottom end of a multi-year range (Chart 4). In due course, the path of least resistance is up, but the question is of timing. On the daily chart, it seems as if it is itching to move up, and will have implications for the Russell 2000 should it come to pass. The latter is right at horizontal-line resistance drawn from March 2014, and, unlike the S&P 500 index and Dow industrials, which have rallied to new highs, is 7.3 percent from the all-time high reached in June last year.
Thanks for reading!
