The following are futures positions of non-commercials as of October 6, 2015. Change is week-over-week.
10-year note: Since the September 16-17 FOMC meeting, barring comments from hawks like John Williams, president of the San Francisco Fed, and Dennis Lockhart, president of the Atlanta Fed, most Fed officials’ message has leaned dovish.
Minutes from that meeting, released Thursday, were no exception. With one difference maybe. It seems they are now focused more on inflation than on employment. But who knows? The message keeps shifting, and will probably do so again. Honestly, it is not clear what exactly they are looking at. But if the emphasis really is on inflation going forward, we may not see a hike for a long time to come.
With the 10-year yield continuing to hover around two percent, history was made on the shorter end of the curve this week. On Monday, the U.S. Treasury sold three-month bills with a yield of zero – for the first time on record. In the secondary market, some bills have been yielding slightly below zero or around zero for weeks. For instance, on Tuesday morning, the yield on three-month bills turned negative briefly.
Rather fittingly, the IMF once again trimmed its global growth forecast to 3.1 percent for this year versus 3.3 percent in July.
Does Narayan Kocherlakota, president of the Minneapolis Fed, then have a point suggesting the Fed should resort to negative interest rates? Probably not. Why would negative rates help the economy if rates at/near zero for seven years have not already? It will only look desperate, as if the Fed is grasping at straws.
Currently net short 2.5k, down 25 k.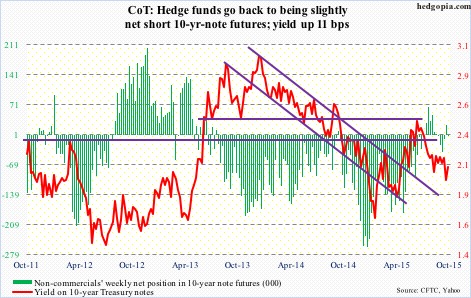
30-year bond: Next week’s major economic releases are as follows.
On Tuesday, we get the NFIB small business optimism index, which in August rose 0.5 to 95.9. The December (2014) reading of 100.4 was the highest since 100.6 in October 2006. Comp and capex plans in particular remain subdued.
September’s retail sales come out on Wednesday. They rose 0.2 percent in August, but momentum has been slipping – down four of the last nine months.
Also on Wednesday, September’s producer prices will be published. In July, they were flat. In the 12 months through August, the PPI fell 0.8 percent.
CPI is on Thursday. Consumer prices slipped 0.1 percent in August – the first decline since January. In the 12 months through August, they rose 0.2 percent. Core CPI rose 0.1 percent and 1.8 percent, respectively. This was the fifth time in six months that core CPI rose at a 1.8 percent clip. The CPI is not the Fed’s favorite measure of consumer inflation. The PCE price index is, which is not running as high as core CPI. Core PCE rose 1.3 percent in August.
Friday has four different releases: industrial production for September (capacity utilization of 77.6 in August, down from cycle high 79 last December); JOTLS for August (job openings of 5.75 million in July – an all-time high); the University of Michigan’s preliminary reading of consumer sentiment for October (87.2 in September, down from cycle high 98.1 in January); and the Treasury International Capital System for August (China held $1.24 trillion in Treasury securities in July, down from $1.27 trillion in June).
Six FOMC members are scheduled to speak during weekdays.
Currently net short 7.1k, down 1.9k.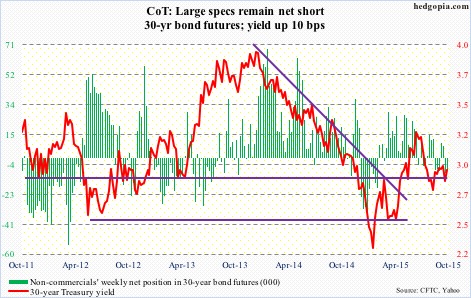
Crude oil: Over the weekend came the news that Saudi Arabia would cut the price of its light-crude deliveries to Asia by $1.7/barrel. It also cut its heavy-oil prices by $2/barrel to the Far East and by $0.30/barrel to the U.S. Come Monday, oil traded just fine. Are traders beginning to focus long-term?
OPEC secretary-general said global investment in oil will drop by $130 billion this year, which has to impact supply in due course.
Right here and now, inventory continues to rise. In the October 2nd week, U.S. crude inventory was up another 3.1 million barrels, to 461 million barrels – up seven million barrels in two weeks. Gasoline stocks rose 1.9 million barrels, to 223.9 million barrels – now up 11.1 million barrels in the past seven weeks. Gasoline was at a similar level in the middle of May – right before the summer driving season; days of supply currently stand at 24.8, vs. 22.2 in the August 14th week.
In the meantime, refinery utilization continues to fall – down 2.3 percentage points to 87.5 percent and down 8.6 percentage points in the past eight weeks. The only good news came from crude production, which fell 76,000 barrels a day, to 9.17 million bpd. Production is down over 400,000 bpd from the June 5th high of 9.61 mbpd.
In the end, oil bears got trampled over. Spot WTI rallied 8.4 percent for the week. Recall that the move preceded three back-to-back weekly dojis. Bears tried to push the crude below 43-44 for one whole month, but to no avail. Now there is good support around the 47 area. The 50-day moving average (44.69) continues to curl up.
Near-term, the 200-DMA is right above (51.03), which was unsuccessfully tested on Friday. The session was not able to hang on to gains, in the end producing a shooting star. Daily momentum indicators are grossly overbought.
The path of least resistance near-term is probably down. Bulls need to step up to save support.
Currently net long 285.8k, up 2.6k.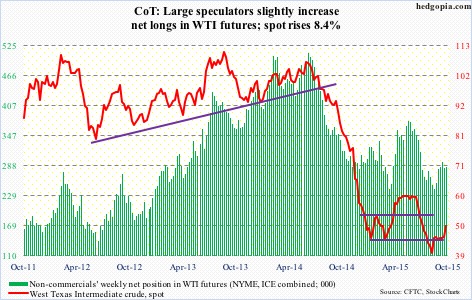
E-mini S&P 500: Back on September 17, stocks sold off after the FOMC statement was released. It was considered too dovish. On Thursday, minutes of that meeting were made public, and they were as dovish. Yet, stocks rallied. Confused yet? Technicals probably had something to do with it. Back then, daily technicals were getting a little too stretched. This time around, there was still room left before they got overbought.
In the process, the S&P 500 index has pushed above its 50-day moving average. And one can argue that with a move past 1995ish we now have a double bottom. Before we get too excited, right above lies resistance at 2021, followed by a major one at 2040-2060. The 2021 level already acted as resistance on Friday, with the session producing a doji.
Off the September 29th low, the index has already rallied 7.6 percent. That is in eight sessions. Too soon, too fast? Probably why non-commercials are not buying the rally. They added to net shorts, which are now the highest since December 2011.
And retail is using the rally as an opportunity to lighten up. Through Wednesday, domestic equity funds reported net outflows of $3.7 billion (courtesy of Lipper).
Currently net short 278.2k, up 50.6k.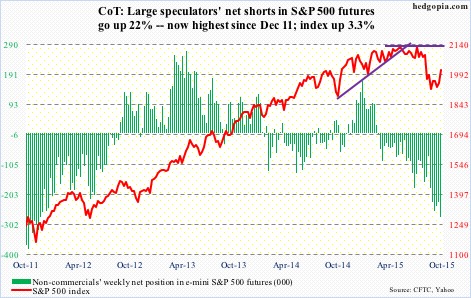
Euro: Mario Draghi, ECB president, once again said the bank was ready to adjust its asset-purchase program, if needed. Board member Sabine Lautenschlaeger, on the other hand, says it is premature to discuss more QE. The game of carrot and stick continues. Since March, the ECB has been purchasing €60 billion a month of mostly government bonds, and the program runs until September next year.
Non-commercials continue to lean bearish.
The euro went the other way, up 1.3 percent for the week, but also produced a daily doji right underneath the upper Bollinger band.
Currently net short 88.8k, up 1.2k.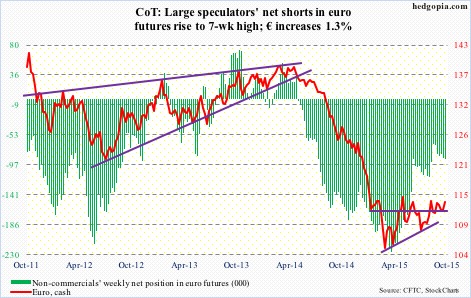
Gold: Minutes after the release of FOMC minutes on Thursday, gold popped to 1,150.9, before reversing hard. The FOMC’s dovish message was no help. Correspondingly, GLD, the SPDR Gold ETF, jumped to 110.27, but the 11-month resistance proved too tough to conquer; in the end, the session produced a shooting star. The prior two sessions had produced dojis. In normal circumstances, this would be bearish, unless negated. Did Friday’s trading do exactly that?
The metal went on to rally 1.5 percent on Friday, past 1,140ish resistance. Ditto with GLD. There is still room for it to move higher on a weekly chart.
Non-commercials have been vindicated, as they have been adding to net longs. The metal made a low on July 24. The following week, these traders’ net longs bottomed, and have risen 255 percent since. Gold has followed.
From a longer-term perspective, spot gold has retraced 50 percent of the April 2001 low of 255.8 and the September 2011 high of 1,923.7 – always a good spot for gold bugs to put their foot down. The price is holding above that retracement level, at 1090. So far, so good.
Currently net long 86.8k, up 10.2k.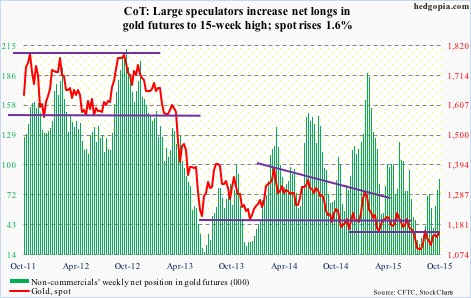
Nasdaq 100 index (mini): At 14 percent, healthcare is the third biggest sector in QQQ, the PowerShares Nasdaq 100 ETF. Bio-techs had a rough week. IBB, the iShares Nasdaq Biotech ETF, dropped 2.2 percent, although closed the week substantially off the lows. And then Apple (AAPL) – up only 1.6 percent for the week! The stock is given a 13 percent weighting in QQQ, so that played a role in the rather underwhelming 2.4-percent rise in the Nasdaq 100.
Just last week, the Nasdaq 100 had a daily death cross, and the index currently is trapped between 50- and 200-day moving averages. The gap is merely 44 points. Daily momentum indicators are now in overbought territory.
Currently net long 9.5k, up 7.5k.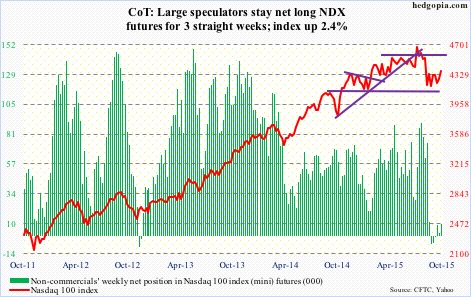
Russell 2000 mini-index: Risk-on? Looks that way, as far as small-caps are concerned. And some level of fear-of-missing-out (FOMO) in action as well. The Russell 2000 jumped 4.6 percent for the week, versus 3.3 percent for the S&P 500, 2.6 percent for the Nasdaq composite, and 3.7 percent for the Dow.
On the other hand, unlike the S&P 500 and the Dow, the Russell 2000 is struggling to convincingly get over its 50-day moving average, as is the Nasdaq composite. RVX, the Russell 2000 Volatility Index, gave back 13 percent for the week, but is trying to stabilize right above its 200-day moving average.
Non-commercials are taking the rally as an opportunity to add to their bearish bias.
Currently net short 43.1k, up 14.1k.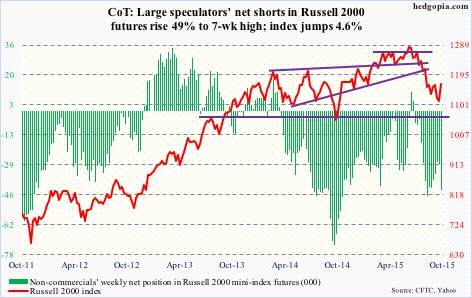
US Dollar Index: Dollar bulls are swimming upstream. A dovish message from the Fed, coupled with downward pressure on interest rates, is not helping their cause. Kudos to non-commercials who expected things to unfold this way. They had been cutting back since March 10 when net longs peaked at 81,270 contracts. The dollar index peaked a week later. Holdings have been nearly cut in half, and the index cannot get it going.
Several moving averages – particularly daily – converge in the 96 area, and the index is losing it. It is now below both 50- and 200-day moving averages. There is a potential death cross in the making, with merely 0.27 separating the two.
Currently net long 46k, up 290.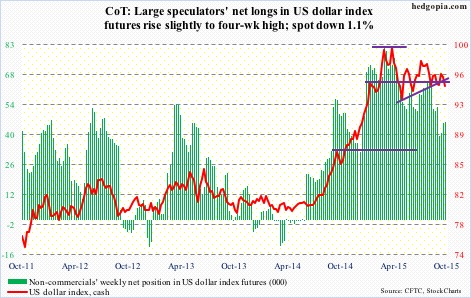
VIX: The run ended at 30 sessions – spot VIX over 20, that is. It ended on Monday, and VIX continued lower the next four sessions. Thursday, the spot tested the 200-day moving average, and it held – has not been below that average since August 18, right before the four-day spike to 53.29 on August 24. That was the week non-commercials went net long – for the first time since February this year. And they kept adding, peaking at 37,925 contracts by September 8. They have stayed net long for seven weeks now. In the meantime, spot VIX has gone the other way. They are still net long, but cut this week. Oddly enough, VIX could be on the verge of making a move higher near-term.
Currently net long 21.1k, down 9.2k.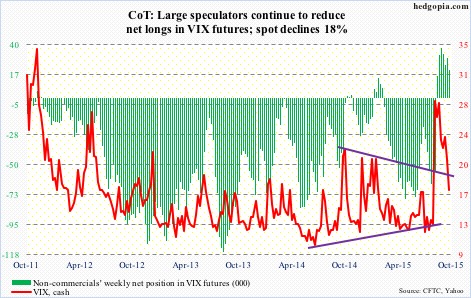
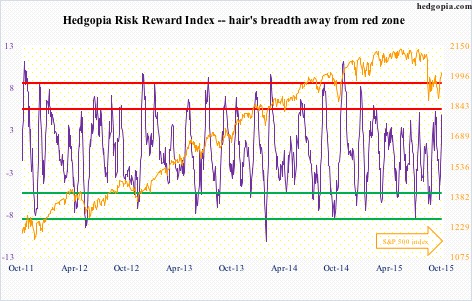
Hedgopia Risk Reward Index