
From the all-time high of 2490.87 on August 8 through last Friday’s intraday low of 2420.69, the S&P 500 large cap index shed 2.8 percent. Not much in a big scheme of things. It is still up 8.3 percent this year.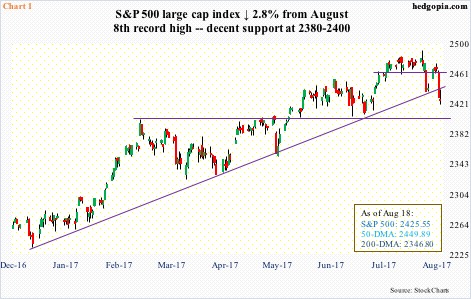
Nevertheless, at a time of pervasive ‘buy the dip’ (BTD) sentiment, the 2.8-percent drop deserves attention. Particularly when those who bought the dip in the prior week are sitting in the red. Last week, after three sessions of staying above, the index went on to once again lose the 50-day moving average.
More signs are likely this week as to if this represents a sentiment shift, or BTD works again.
After going sideways for three months, the S&P 500 broke out of 2400 in May this year (Chart 1). If this support gets tested – or even 2380 – the index would have dropped 3.6 percent to 4.5 percent. This should be enough of an incentive for shorts to cover or for dip-buyers to seriously step up to the plate – duration notwithstanding.
Assuming a relief rally occurs right here, or a little lower, more important perhaps is how shorts behave at/near resistance. Last week, they showed up at resistance. By Wednesday, the S&P 500 rallied to 2474.93 intraday – past resistance at 2463 – but the session ended in a long-legged doji, followed by a sell-off on Thursday and Friday.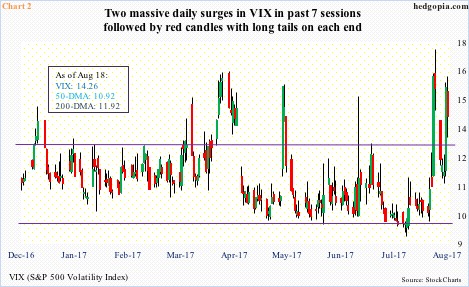
For now, VIX dynamics could very well be favoring dip-buyers.
In the past seven sessions, spot VIX has had two surges – 32.5 percent and 44.5 percent, respectively (Chart 2). The first one – on August 10 – was immediately followed by a spike reversal, which then led to a test of the 200-day. Intraday between August 11 and 16, VIX dropped from 17.28 to 11.25 in four sessions.
The difference this time, unlike in the past, was that there were also dip-buyers in VIX, leading to Thursday’s huge green candle. But once again volatility bulls were unable to build on it. Friday produced a red candle with long tails.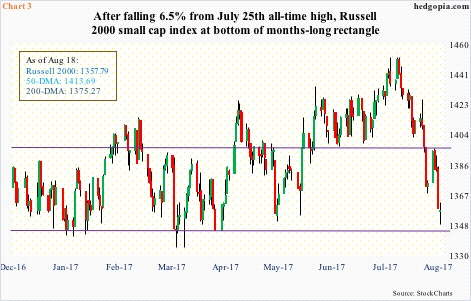
In a scenario in which VIX begins to unwind its daily overbought condition right away, a test of 2380-2400 on the S&P 500 probably does not occur.
A relief rally is also possible in small-caps. They have fared much worse than their large-cap brethren. For the year, the Russell 2000 small cap index is flat.
From the all-time high of 1452.09 on July 25, the index is down 6.5 percent. On its way here, it has suffered technical damage.
The Russell 2000 was caught in a rising wedge, the upper bound of which repelled rally attempts throughout this year. Two weeks ago, it lost a rising trend line from February last year, followed by a loss of both the 50- and 200-day.
With this, the index dropped back into a months-long range between 1340s and 1390s. On Friday, in a long-legged doji session, buyers showed up in defense of that support (Chart 3).
Nearest resistance lies at the 200-day (1375.27).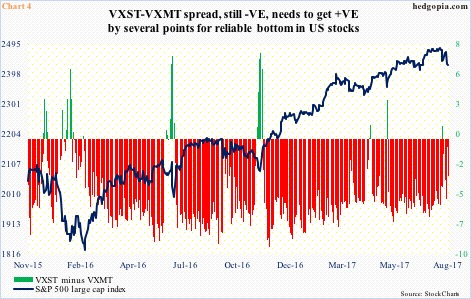
From the viewpoint of technical damage, the S&P 500 is not unscathed, but the damage is nowhere near comparable to the one suffered by the Russell 2000. The implication being the S&P 500 is in less need of heavy repair work. That said, even if things stabilize here, this alone does not ensure a reliable bottom.
The volatility curve – VXST (nine days), VIX (30 days), VXV (90 days) and VXMT (six months) – is still in contango, with the spread between VXST and VXMT -3.21 points last Friday.
Several times in the past, a tradable bottom in stocks came about only after the curve shifted into backwardation where VXST was wider than VXMT by several points, which is what the green bars in Chart 4 show. Not the case now.
Thanks for reading!
