
US stocks took it on the chin last week. Large-caps held up better, but risk aversion was seen elsewhere. The Dow Industrials was essentially unchanged, and the S&P 500 large cap index lost one percent. The tech-heavy Nasdaq 100 index was punished for a three-percent decline, while the Russell 2000 small cap index had a mini collapse of 3.8 percent. Off their recent respective highs, the Dow and the S&P 500 are each down 1.9 percent, while the Nasdaq 100 and the Russell 2000 respectively lost 3.9 percent and 6.3 percent.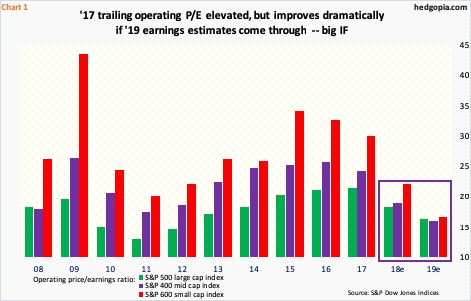
This was a week in which earnings estimates for this year continued lower, but 2019’s nudged higher. As a result, the price-to-earnings ratio on next year’s elevated estimates continue to drop, but at least judging by this week’s action, stocks are having trouble buying it.
Companies will begin to report 3Q18 in earnest this week. Leading up to it, estimates have gone down. In 3Q, operating earnings estimates for S&P 500 companies went down from $40.47 to $40.05, S&P 400 from $28.02 to $27.35, and S&P 600 from $13.41 to $12.31. The bar is lower for these companies to meet/beat. This also holds true with 2018.
Post-tax cuts, the sell-side aggressively raised numbers for both 2018 and 2019. The Tax Cuts and Jobs Act of 2017 was signed into law on December 22 last year. A day before that, 2018 estimates were $145.31 for S&P 500 companies, $97.60 for S&P 400 and $45.41 for S&P 600. They respectively peaked at $158.24 (July), $106.66 (May) and $50.66 (March); as of last Thursday, estimates were $157.35, $103.59 and $46.26, in that order. Notice that the post-tax cut surge in estimates for S&P 600 has been essentially revised away.
Next year’s estimates are holding up. This is typical of the sell-side. These analysts tend to start out optimistic and then progressively lower estimates as time progresses; 2018 is following this playbook. It is increasingly difficult to trust the P/E ratio based on 2019 estimates (Chart 1).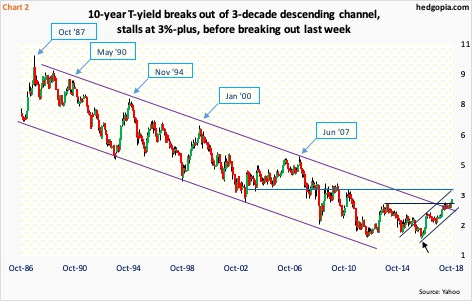
This week, the excuse cited for the selloff in stocks was the rise in the long end of the Treasury yield curve. The 10-year yield shot up 17 basis points to 3.23 percent. The question is, what may be causing this? Even more important, how sustainable is the recent backup in yields?
The 10-year has been rising since bottoming at an all-time low of 1.34 percent in July 2016. Most recently, it bottomed in September last year at 2.03 percent. For bond bears, this week’s action has significance. The 10-year had been caught in a three-decade descending channel, which it poked its head out of in April. But breaking out of three-plus percent proved difficult. Before this, the last time the 10-year unsuccessfully tried to take out this level was five years ago.
In a best-case scenario for the bears, nearest resistance lies at 3.5-3.6 percent. Since the July 2016 low (black arrow in Chart 2), the 10-year has made higher lows. A rising channel drawn thereof extends to that level as well. Other than that, it is hard to imagine rates continuing higher – if nothing else, just for the fact that leverage in the system has only grown post-financial crisis. Higher interest payments should act as natural brakes on the economy.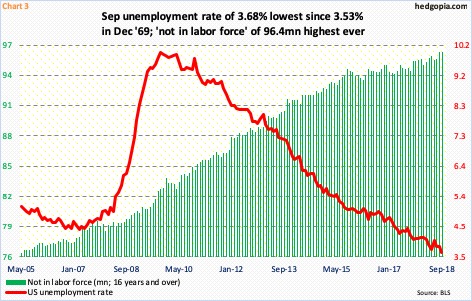
Investor focus right now is the current stream of positive data. The ISM manufacturing index fell 1.5 points month-over-month in September, with August’s 61.3 the highest since May 2004. Real GDP grew 4.2 percent in 2Q18. As of last Friday, the Atlanta Fed’s GDPNow model was forecasting growth of another 4.1 percent in 3Q18. In September, the US unemployment rate fell to a nearly 49-year low 3.68 percent. There are still millions of people out of the labor force who can reenter (Chart 3).
This probably gives more room for the Fed to maintain their hawkish bias. The FOMC dot plot is forecasting one more hike in the remaining two meetings this year. In futures, December odds for a 25-basis-point hike in the fed funds rate are at 80 percent currently. Next year, they expect three more hikes, markets expect one. Until recently, the yield curve (10s/2s) had narrowed to a mere 18 basis points (August 27). With the recent rise in the 10-year, the spread is now up to 35 basis points. Historically, it is still low, but the recent trend has been higher. Do bond vigilantes no longer fear rising rates? If so, stocks are sending a different message.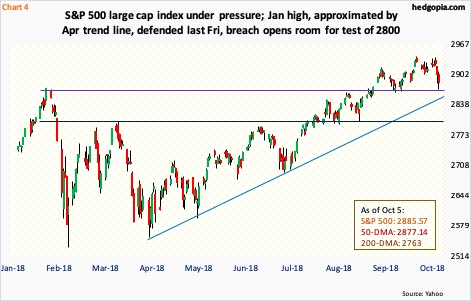
As explained in the opening paragraph, some cracks are beginning to show up in stocks.
On the S&P 500 (2885.57), prior to the 1.4-percent drop in the last two sessions last week, there were some subtle signs of distribution. For six sessions, the index tried to rally but was unable to hang on to all of the daily gains, resulting in long upper shadows (Chart 4). Monday last week was a spinning top and Tuesday a doji.
Further, for a while now, the rally has been led by the generals (more here), even as the soldiers kept weakening. Friday, only 49.2 percent of S&P 500 stocks were above their 50-day; although, this metric is getting oversold on the daily. Bulls also defended 2870s (January high) Friday. The 50-day moving average was breached intraday in that session, but saved by close.
Weekly indicators remain grossly overbought. If the 50-day is lost, 2850 is another level worth watching. A rising trend line from early April extends there. Then there is 2800.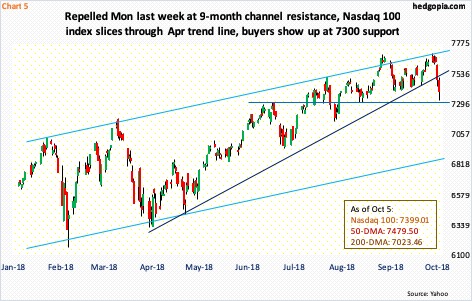
A similar trend line from April is lost on the Nasdaq 100 (7399.01). Last month, bulls expended a lot of energy in defending the 50-day over and over, but the index struggled to lift off of the average. Monday last week, the intraday record high of 7700.56 edged past the prior high from August 30, but only to stall. The weekly produced an engulfing candle. All this action preceded a persistent rally led by the generals, with the soldiers falling far behind.
The index is trapped within a nine-month descending channel, and the upper bound was just kissed. If the weekly chart takes over, there is a long way to go on the downside. The 50-day was lost Friday. Immediately ahead, there is support at 7300, which was successfully tested Friday.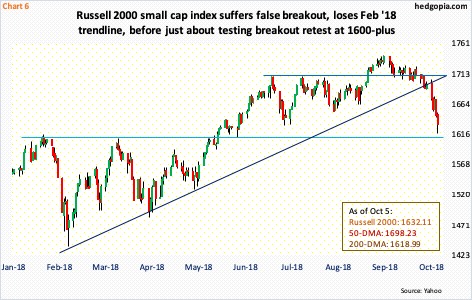
Small-caps are faring a lot worse. Monday last week, the Russell 2000 (1632.11) tried to recapture the 50-day, which was lost in the preceding week, but sellers/shorts quickly showed up. Importantly, a rising trend line from February is lost. Last Friday, the 200-day (1618.99) was tagged, and buyers showed up. This level also approximates retest of mid-May breakout at 1610-ish. Plus, this is where a rising trend line from February 2016 rests. This is a must-save for small-cap bulls. The daily is grossly oversold. Should a rally ensue, there is plenty of overhead resistance for shorts to reappear.
Nearest resistance on the Russell 2000 lies at 1650s. Similar levels on the S&P 500 rest at just north of 2900 and on the Nasdaq 100 7500/50-day (7479.50). Weekly charts remain overbought on all these indices. Bulls cannot afford to lose the aforementioned support. If a rally develops near term, they also cannot afford to let sellers show up at resistance and dominate action. As things stand, bulls are on the back foot.
Thanks for reading!
