The following are futures positions of non-commercials as of August 4, 2015. Change is week-over-week.
10-year note: Federal Reserve Governor Jerome Powell told CNBC on Wednesday that he has not made up his mind yet on whether interest rates should be raised next month. Dennis Lockhart, Atlanta Fed president, a voting member, on the other hand told the Wall Street Journal Tuesday that the economy is ready for an increase in short-term rates, saying there is a high bar for not raising rates in September.
Post-jobs report on Friday, yields on two-year Treasury bills rose to 0.73 percent – raising the odds of a September hike. Private sector average hourly earnings grew 2.1 percent in July year-over-year – still stuck in the two-percent range. Non-farm payroll grew 215,000 in July, versus 231,000 in June and 260,000 in May. Does this pace qualify for “…some further improvement in the labor market…” as stated in the July 29th FOMC statement?
The bigger question perhaps is how many FOMC voting members think like Mr. Lockhart? Or even would the Fed take its cue from the Bank of England, which this week voted eight to one to keep rates on hold at 0.5 percent, with the outlook for inflation “muted”.
The enthusiasm shown by two-year Treasuries was not shared by the long end. TLT, the iShares 20+ Year Treasury ETF, rose 1.7 percent for the week. The yield curve flattened – not an ideal mix.
Monday, Mr. Lockhart speaks again. So it will be interesting to hear his take post-July jobs. On Wednesday, William Dudley, FOMC vice-chair – a significant voice within the FOMC – is scheduled to speak as well.
Currently net long 32.5k, down 33.1k.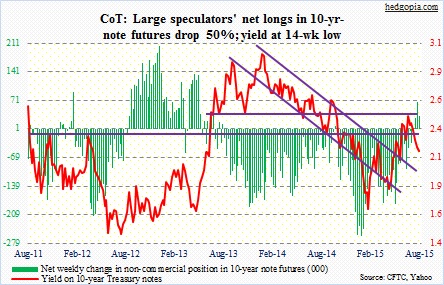
30-year bond: Here are the major economic releases next week.
The NFIB Small Business Optimism Index for July will be released on Tuesday. June’s 94.1 reading was the lowest since April last year. The index has been dropping since the December 2014 reading of 100.4, which was the highest since 100.7 in October 2006. Comp and capex plans have fallen from 17 and 29 last December to 11 and 23, respectively.
Also on Tuesday, preliminary productivity numbers for the second quarter will be published. To say that this metric is not going the right direction is an understatement. In 1Q15, non-farm output per hour grew a mere 0.3 percent year-over-year. Quarter-over-quarter, it has dropped the last two quarters.
June’s JOLTS report is scheduled for Wednesday. This metric tends to lead payroll. Non-farm job openings were 5.36 million in May – an all-time high – although April was revised down from 5.38 million to 5.33 million. Layoffs and discharges dropped from 1.89 million in March to 1.65 million in May. If someone were to nitpick, quits fell from 2.77 million in March to 2.7 million in May.
Retail sales for July come out on Thursday. Year-over-year growth has been decelerating since last August. Sales grew at five percent back then, and by June had decelerated to 1.4 percent. In the first half this year, month-over-month sales grew in three months and fell in the other three. June dropped 0.3 percent to $442 billion from May’s high of $443.2 billion. When June was reported, the prior three months were all revised lower.
Industrial production is on Friday. It has dropped two out of the last three months. Year-over-year growth decelerated to 1.5 percent in June from 5.1 percent in July last year. Capacity utilization made a high of 79.8 last November, and year-over-year has dropped for four consecutive months.
Also on Friday, July’s Producer Price Index – Final Demand is on tap. In June, it rose 0.4 percent, after increasing 0.5 percent in May. In the 12 months through June, producer prices have fallen 0.7 percent after dropping 1.1 percent in May. Core PPI rose 0.3 percent in June, and was up 0.7 percent in the 12 months through June. These are subdued readings.
Currently net long 14.2k, up 13.1k.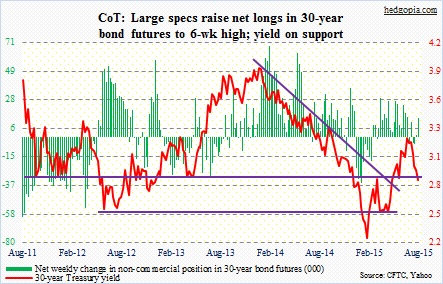
Crude oil: Not much relief in the oil pit. The West Texas Intermediate crude is now down eight consecutive weeks. News on the inventory front was good, but not good enough. Crude inventory fell 4.4 million barrels in the July 31st week, following a 4.2-million drop in the prior week. Nonetheless, stocks are still only seven percent below April’s record high. At 96.1 percent, refiners were already running at their highest rates since August 2005.
Spot WTI ($43.75) is now awfully close to January ($43.58) and March ($42.41) lows. In fact, on a weekly closing basis, the crude is trading at the lowest since January 2009. If it is any consolation, weekly indicators are now at overbought levels. But overbought can remain overbought for extended time periods. WTI remained in oversold territory from July last year to January this year.
As a side note, how might energy be impacting high-yield returns currently? Consider this. In July, high-yield bonds fell 0.62 percent, versus investment-grade that rose 0.55 percent. In high-yield, however, only four of 15 industries posted negative returns, with energy down 4.95 percent and metals & mining down 8.6 percent (courtesy of Lehman, Livian, Fridson Advisors).
Currently net long 278.1k, up 19k.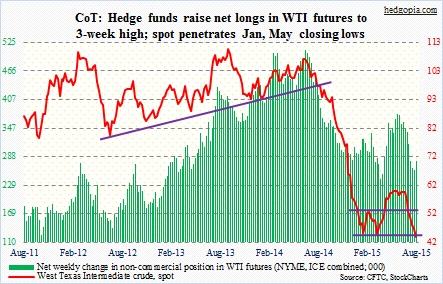
E-mini S&P 500: The distance between the 50- and 200-day moving averages is only 23 points on the S&P 500. The 200-day is still rising but the 50-day is dropping – fast. Pretty soon, we should begin to hear people talk about impending death cross. In fact, on the Dow Industrials, the two averages are less than 24 points apart. XLI, the SPDR Industrials ETF, already had a crossover late July, as did XLB, the SPDR Materials ETF.
The S&P 500 peaked in May, and has nothing but churned since. Of late, sentiment has taken a little hit. In a stealth manner, defensives have been winning out over offensives. Monthly momentum indicators on the S&P 500 have begun to turn lower from extremely overbought conditions. Bulls’ mettle is being tested. This at a time when U.S. stock funds are struggling to attract funds. In the week ended August 5, $5.3 billion left – third straight week of outflows (courtesy of Lipper).
A little off-topic, but some interesting tidbit from XTF: In July, 39 ETFs were introduced – the second highest after February 2012, when 48 new ones were launched.
Currently net short 116.6k, up 23.5k.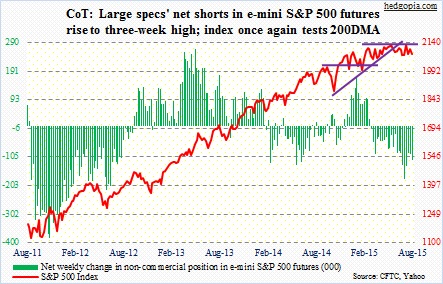
Euro: Markit’s euro zone final PMI reading came in at 53.9, better than an earlier estimate of 53.7, but still lower than June’s four-year high of 54.2. The index has now been above 50 since mid-2013. The euro was indifferent to the news – flat for the week. It is trying to rally from just above the lower daily Bollinger band.
Currently net short 113.4k, up 9.4k.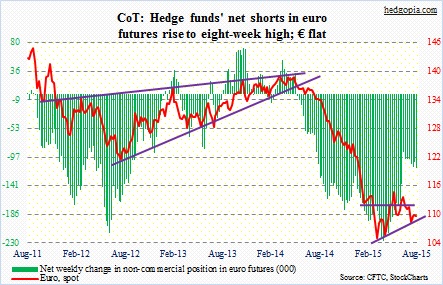
Gold: Is gold beginning to see light at the end of tunnel? For the second consecutive week, the metal has essentially gone flat, producing back-to-back doji/hammer. (GLD, the SPDR Gold ETF, has back-to-back weekly dojis.)
Besides, last week non-commercials reduced net longs to the lowest since December 2013. This week, they added. Gold bugs sure hope this is the beginning of a trend. There is plenty of room for oversold technical conditions to get unwound. In the past, non-commercials have done a good job of riding the gold wave, so they are worth watching.
In the meantime, analysts still forecast gold will reach $1,185/troy ounce at the end of 3Q and $1,198 at the end of 4Q (courtesy of FactSet). This either suggests gold is not likely to stabilize until these folks puke or shows the level of conviction they have in their call. Time will tell.
Currently net long 29.9k, up 5.4k.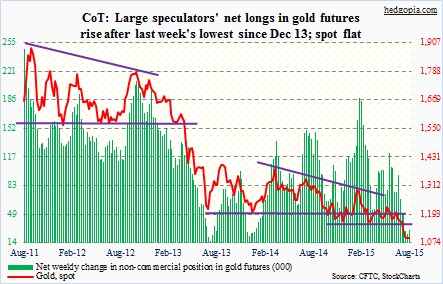
Nasdaq 100 index (mini): The distance between the 50- and 200-day moving averages is 148 points – not as bad as on the S&P 500 or the Dow Industrials. Nonetheless the 50-day is flattish to slightly lower. Next week can be crucial. Also because it closed the week below 4550 support – although only by 30 points. Not surprisingly, AAPL, with a 14-percent weight, will play a major role. The stock had a nice reversal on Wednesday, and has room to build on that action – at least near-term.
Incidentally, for whatever it is worth, SOX, the semiconductor index, is on the verge of a 50/200 crossover.
Currently net long 79k, down 11.2k.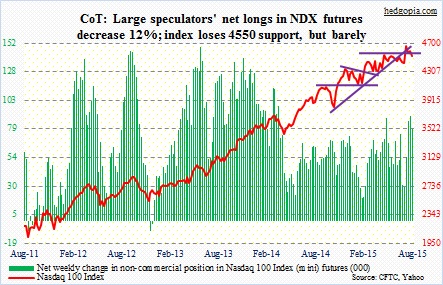
Russell 2000 mini-index: It has been acting poorly, and on Friday lost 1215. This support goes all the way back to March 2014.
From the perspective of small-cap bulls, RVX, the Russell 2000 Volatility Index, tried to take out the 200-day moving average both Thursday and Friday – unsuccessfully. Resistance at the 19 area has proven to be tough. If and when that level is conquered, small caps are in for more pain.
Non-commercials are beginning to prepare for that eventuality, raising net shorts to a nine-week high. They also raised last week and were rewarded. The Russell 2000 was down 2.6 percent for the week.
Currently net short 28.1k, up 10.7k.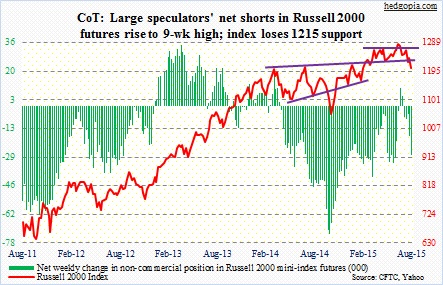
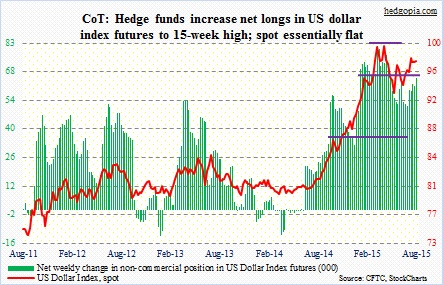
US Dollar Index: On Friday, the dollar was not able to piggyback on the resilient short end of the U.S. yield curve, and is giving out signs that it wants to go lower in the near-term.
During the week, the Dollar Index – essentially unchanged – was more or less indifferent to how manufacturing activity has remained suppressed among major exporters. July PMI was 47.6 in Korea, 47.1 in Taiwan, 47.8 in China (Caixin/Markit) and 50 (China official PMI).
Non-commercials have been adding to net longs the past five weeks, taking it to a 15-week high, but have not been rewarded yet.
Currently net long 65.2k, up 4k.
VIX: For the first time since July last year, spot VIX dropped below 11 on Wednesday, and that fear was immediately bought; in fact, the session closed at 12.51. So the game continues. VIX near 11-12 gets bought and gets sold when it gets to 15ish. On Friday, it unsuccessfully tried to rally past the 50-day moving average.
Weekly Bollinger bands are tightening. A big move is coming.
Non-commercials are betting that it will be to the downside. They raised net shorts to a seven-week high.
Currently net short 64.4k, up 10.5k.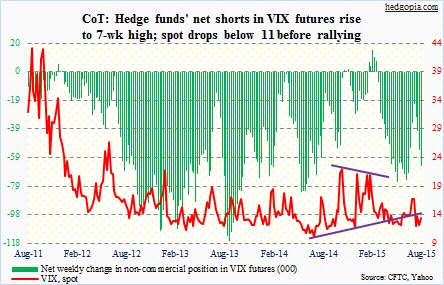
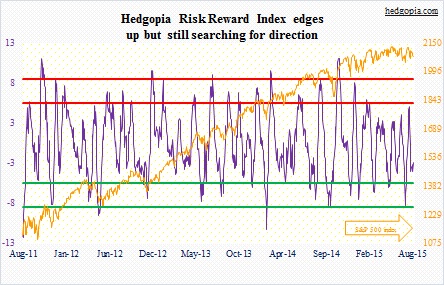
Hedgopia Risk Reward Index