The following are futures positions of non-commercials as of July 5, 2016. Change is week-over-week.
10-year note: One can make a cogent argument that U.S. sovereign bonds are in a blow-off phase. Since late May through the Friday high, TLT, the iShares 20+ year treasury bond ETF, rallied 11.8 percent. The ETF does have a parabolic look to it in particularly the past couple of weeks.
Accordingly, yields on both 30-year bonds and 10-year notes this week made new all-time lows. Post-Brexit, demand for long bonds from major countries, including Japan and Germany, has gone through the roof. The U.S. is no exception.
On Wednesday, 10-year Treasury yields fell to a record low 1.34 percent, and on Friday 30-year yields dropped to a record low 2.1 percent. But are they done going down?
Bill Gross, of Janus Capital, says, “I think the 10-year has the chance to go to 1.25 percent.”
Indeed, with rates as low as they are, it is anyone’s guess how low they can go when the next recession hits. And recessions are as certain as death and taxes. It is just a matter of when.
Currently net long 96.1k, up 12.2k.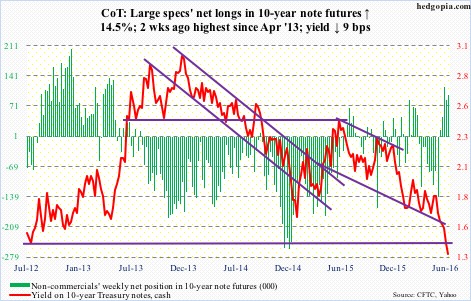
30-year bond: Major economic releases next week are as follows.
Tuesday brings the NFIB optimism index (June) and JOLTS (May).
In May, small-business optimism inched up two-tenths of a point to 93.8. The cycle peaked in December 2014 at 100.3 – the highest since October 2006. Their capex plans were 23 in May, down from the cycle high 29 in August 2014.
Job openings rose 118,000 month-over-month in April to 5.78 million, matching the high of July last year. Which also means openings have been flat for 10 months.
PPI-FD for June is published on Thursday. Producer prices rose 0.4 percent in May. In the 12 months through May, they fell 0.1 percent. Core prices dropped 0.1 percent in May, and were up 0.8 percent in the 12 months through May.
Friday brings CPI (June), retail sales (June), industrial production (June), and the University of Michigan’s consumer sentiment (July, preliminary).
Consumer prices rose 0.2 percent in May. In the 12 months through May, prices increased one percent. At the core level, prices advanced 0.2 percent, and 2.2 percent in the 12 months through May.
Industrial production was down 1.3 percent year-over-year in May, and has been down for nine consecutive months. Similarly, capacity utilization, at 74.9 percent in May, has declined y/y for 15 straight months. Utilization peaked in November 2014 at 78.9 percent.
Consumer sentiment fell 1.2 points in June to 93.5. Sentiment peaked in January last year at 98.1, which was an 11-year high.
Six FOMC members have scheduled appearances on weekdays.
Currently net long 90.1k, up 24.1k.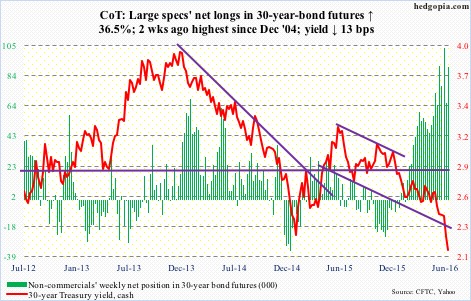
Crude oil: The seven weeks of sideways action after a nearly doubling of the price in four months was resolved this week – by breaking to the downside. Spot West Texas Intermediate crude lost 8.4 percent for the week, losing $46/barrel a support as well as the 50-day moving average.
Continuation of good news on the stocks front did not help. Technicals prevailed.
In the week ended July 1st, crude stocks fell by 2.2 million barrels to 524.4 million barrels. They are now down 19 million barrels from the April 29th high of 543.4 million barrels, which was the highest since the all-time high 545.2 million barrels in October 1929.
Gasoline stocks declined 122,000 barrels to 238.9 million barrels. And distillate stocks contracted 1.6 million barrels to 148.9 million barrels – the lowest in seven months.
U.S. production continues to drop, down another 194,000 barrels per day to 8.4 million b/d. Production peaked at 9.61 mb/d in the June 5th week last year.
Crude imports, however, rose 808,000 barrels to 8.4 mb/d. Plus, refinery utilization fell five-tenths a point to 92.5 percent; the prior week was a 29-week high.
On the weekly chart, there is plenty of downside risk still, with support at $42.50-$43, followed by the 200-day moving average ($41.11).
Currently net long 318.5k, down 752.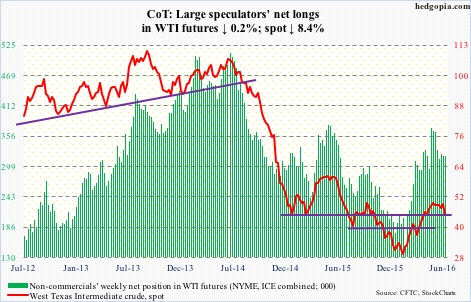
E-mini S&P 500: Post-Brexit two-session sell-off was risk-off, with the S&P 500 large cap index dropping 5.3 percent. The subsequent four-session, 5.1-percent surge through Friday last week was risk-on. But amidst this risk-on behavior, defensive sectors did very well, 10-year Treasury yields made new lows, and gold continued to shine.
This would normally make it hard to put solid odds on chances of sustained breakout on the index, which has gone sideways for the past 16 months. But it is tantalizingly close. Friday’s post-jobs 1.5-percent rally brings the index right underneath the May 2015 high. In fact, on a closing basis, it has broken out, albeit by only a few points.
We are in the midst of earnings season, with low hurdle to jump. Bulls have the ball.
A lot is going to depend on whether or not flows improve. SPY, the SPDR S&P 500 ETF, did indeed attract $4.6 billion in the week ended Wednesday. This followed outflows of $7.7 billion in the prior week (courtesy of ETF.com).
U.S.-based equity funds, however, continued to bleed. In the same week, another $1.4 billion left U.S.-based equity funds. In just the last 10 weeks, $45 billion has been redeemed.
Currently net long 39.9k, down 22.1k.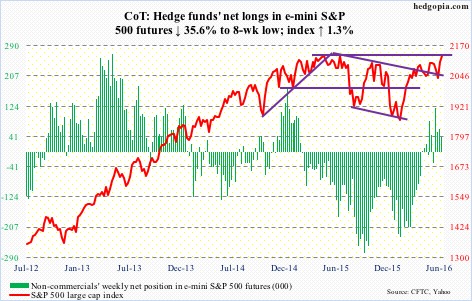
Euro: One would have thought the sudden rise in concern over the stability of Italian banks that hold billions of euros in bad loans would hammer the euro. It is holding up just fine, with the currency down 0.7 percent for the week. Post-Brexit, Italy’s bad loans have been thrown into the limelight as prospects for Eurozone growth dim. More stimulus from the ECB then? It next meets on July 21st.
Minutes for the last ECB meeting showed policymakers were worried that a U.K. decision to leave the EU could unleash significant negative repercussions for Eurozone growth. The ECB is already buying around €80 billion a month of private and public debt, and has cut the benchmark interest rate to a record low of minus 0.4 percent. The balance sheet has grown from €2.04 trillion in September 2014 to €3.08 trillion in May. Hawks will fight tooth and nail against further stimulus.
Currently net short 75.3k, up 13.4k.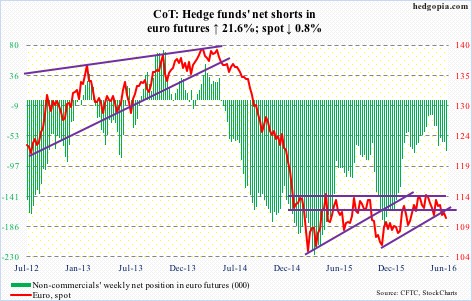
Gold: One more weekly gain for spot gold – its sixth consecutive. Rallied 1.7 percent this week. Flows continue to cooperate.
GLD, the SPDR gold ETF, attracted another $1.4 billion in the week ended Wednesday. This follows inflows by a like amount in the prior week.
In the five weeks to Wednesday’s intra-day high, spot gold rallied nearly 15 percent. GLD attracted $4.7 billion during that time.
The daily chart is beginning to look extended, with a spinning top on Thursday. It is a neutral candle, and signals indecision. Having come after such a nice rally, some unwinding is possible. Friday produced a long-legged doji.
That said, non-commercials continue to accumulate net longs – yet another record.
Currently net long 316k, up 14k.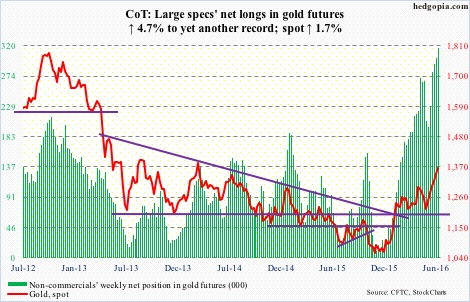
Nasdaq 100 index (mini): QQQ, the PowerShares Nasdaq 100 ETF, continues to struggle to attract funds. It lost $351 million in the week ended Wednesday. Last week, it lost $701 million (courtesy of ETF.com).
The Nasdaq 100 is past 4350, which has been an important price point going back to November 2014, and is literally sitting on the declining trend line from November 2015. A breakout would be a big win for the bulls.
Currently net long 44.6k, down 2.2k.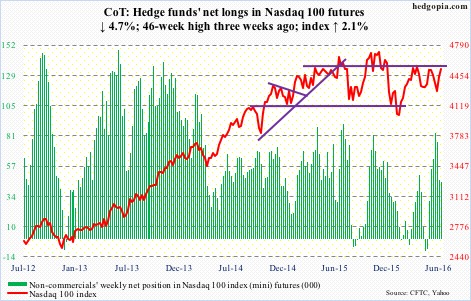
Russell 2000 mini-index: On Wednesday, the 50-day moving average was slightly breached intra-day but buyers showed up to end the session up 0.7 percent. The average is flattish to slightly declining.
Four weeks ago, its weekly chart produced a gravestone doji, which was quickly followed by a 3.1-percent decline over two weeks. Then there was last week’s hammer reversal, followed by another weekly hammer this week.
There is massive resistance at just north of 1200.
Currently net short 38.4k, up 4.2k.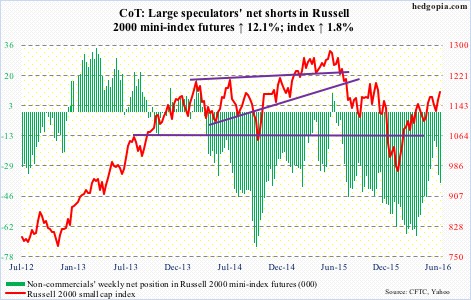
US Dollar Index: Reacting to Brexit on June 24th the dollar index rallied 2.7 percent but was rejected intra-day at its 200-day moving average. In the nine sessions since, the index continues to hover around that average, but the latter continues to stand tall. Friday produced a long-legged doji.
There is not much change in the bigger picture. The index is stuck in the middle of a 15-month range – 100-plus on the up and 93-plus on the down.
Ditto with non-commercials’ sentiment. They continue to act tentative.
Currently net long 12.3k, up 100.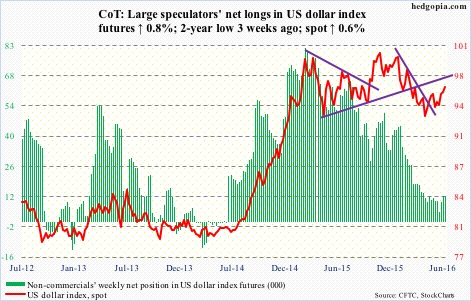
VIX: On both Tuesday and Wednesday, spot VIX sought to break out of a months-long range but was denied. Friday, it was pushed to the bottom end of that range. In the recent past, it has managed to rally from the 12 to 13 range.
The VIX-to-VXV ratio ended the week at 0.8 – now in oversold territory. Two weeks ago, it spiked to 1.08, and needed unwinding, which helped stocks.
Currently net short 46.9k, down 3.2k.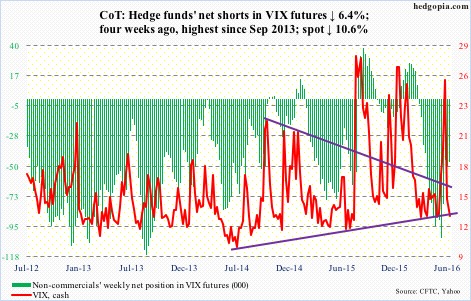
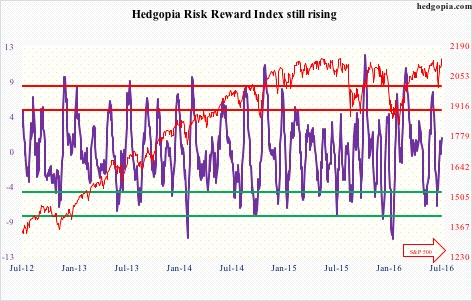
Hedgopia Risk Reward Index