The following are futures positions of non-commercials as of August 2, 2016. Change is week-over-week.
10-year note: Mixed messages from two major central banks!
On Friday last week, Haruhiko Kuroda, BoJ governor, decided not to live up to markets’ lofty expectations, modestly increasing ETF purchases but maintaining the status quo as relates to base money target of ¥80-trillion, 0.1-percent negative interest rate, and purchases of other assets. Instead, the baton seems to have been passed on to the fiscal side of things, with Prime Minister Shinzo Abe unveiling this week a ¥28-trillion, multi-year stimulus package.
It is as if the BoJ now realizes there are limits to monetary measures.
Come Thursday this week, the Bank of England went the other way, cutting its benchmark rate to 0.25 percent – a new low – reviving government bond buying, beginning to buy corporate bonds, and providing ultra-cheap loans to banks. Governor Mark Karney signaled rates could go lower if the economy worsens. Will it work? That is the key question.
Post-financial crisis, central banks have tried all sorts of measures, but it is also becoming increasingly clear that the problem lies with demand, not supply.
We will find out in due course if the BoJ is blazing a trail in this regard.
Currently net long 121.2k, down 64.3k.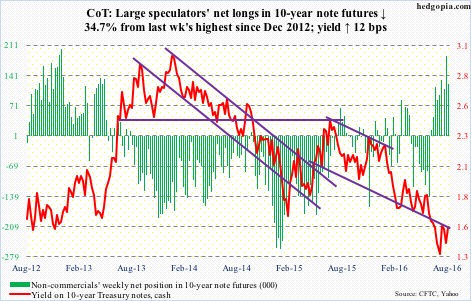
30-year bond: Major economic releases next week are as follows.
The NFIB small business optimism index for July is published on Tuesday. It rose 0.7 points month-over-month in June to 94.5. The cycle high of 100.3 was reached in December 2014, which was the highest since October 2006.
Also on Tuesday comes out productivity data for 2Q16. Non-farm business sector output per hour fell at 0.6-percent annual rate in 1Q16. In 4Q15, productivity decreased 1.7 percent. From 1Q15 to 1Q16, productivity rose 0.7 percent; this was the sixth straight sub-one percent quarter.
JOLTS for June is published on Wednesday. May was down 345,000 m/m to 5.5 million. Openings have essentially gone sideways since July last year – 5.79 million back then versus 5.85 million this April.
Friday brings retail sales (July), PPI-FD (July), and University of Michigan’s consumer sentiment (August).
Retail sales rose 0.6 percent m/m to a seasonally adjusted annual rate of $457 billion in June. This was the third straight monthly increase. Sales rose 2.7 percent year-over-year.
Producer prices jumped 0.5 percent in June – the largest increase since May 2015. In the 12 months through June, prices rose 0.3 percent – the first increase since December 2014. Core PPI rose 0.3 percent m/m and 0.9 percent in the 12 months through June.
Consumer sentiment dropped 3.5 points m/m in July to a three-month low 90. Sentiment peaked at 98.1 in January 2015 – an 11-year high.
Currently net long 70.9k, down 26.6k.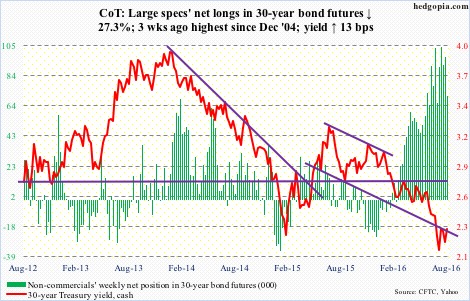
Crude oil: Forced to fight for market share, Saudi Arabia cut prices for Arab Light crude sold to Asia by the most in 10 months. Iran’s production has gone up 25 percent this year, and aims to reach four million barrels per day by year-end. Iraq last month exported a record amount of crude. Here in the U.S., rigs are going up. Markets are once again beginning to worry about oversupply.
Spot West Texas Intermediate crude lost 24 percent in a little less than two months through Wednesday before responding to weekly U.S. data with a 3.3-percent rally, followed by a 2.7-percent rise on Thursday.
The EIA data showed that in the week ended last Friday U.S. crude inventory continued to rise, by 1.4 million barrels to 522.5 million barrels. Stocks are now down 20.8 million barrels from the April 29th high of 543.4 million barrels, which was the highest since the all-time high 545.2 million barrels in October 1929.
Distillate stocks rose 1.2 million barrels to 153.2 million barrels – a 12-week high.
Crude imports rose 301,000 barrels per day to 8.7 million b/d – the highest since October 19, 2012.
On Wednesday, markets instead decided to focus on gasoline stocks, which dropped 3.3 million barrels to 238.2 million barrels – a six-week low.
Crude production dropped, too, by 55,000 b/d, to 8.5 mb/d. Production is down big since peaking at 9.61 mb/d in the June 5th week last year.
Refinery utilization rose nine-tenths of a point to 93.3 percent – a 35-week high.
Spot WTI remains oversold, particularly on the daily chart. If oil bulls put their foot down and push it higher, the area of interest remains $42.50-$43/barrel support, which was broken during the latest sell-off. Then comes the declining 50-day moving average ($46.56), which approximates a falling trend-line resistance from the June 9th high.
Currently net long 275.3k, up 706.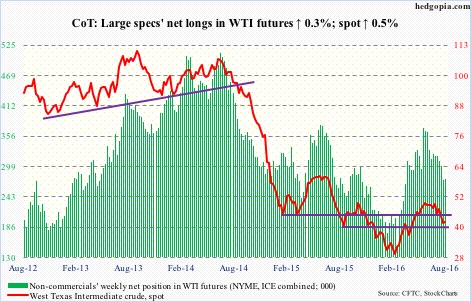
E-mini S&P 500: SPY, the SPDR S&P 500 ETF, in the week ended Wednesday lost $897 million (courtesy of ETF.com). This followed inflows of $2.1 billion in the prior week. Post-Brexit two-session sell-off ended on June 27th; since then, the ETF has attracted $4.1 billion.
No such luxury for U.S.-based equity funds. Nearly $11 billion has been withdrawn since the week ended June 29th. Through Wednesday this week, another $3.6 billion came out. The $7.8 billion in inflows in the week to July 13th has now been replaced by three weekly outflows totaling $10.5 billion.
Despite this, the S&P 500 hung in there. The drastically lowered earnings bar has helped.
Last week’s hanging man was negated, but in the process the week produced another. This is a candle that can suck in short sellers, becoming a source of squeeze. In this scenario, rather than becoming a bearish reversal signal, it becomes a continuation pattern. Hence the need to get confirmation if it is sending a bearish signal.
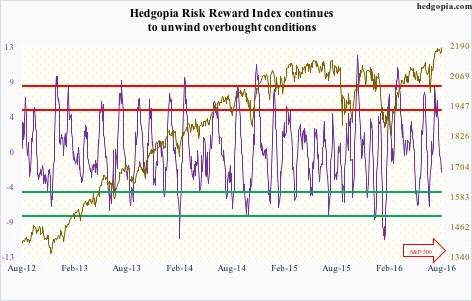
Conditions remain overbought. Daily Bollinger Bands have massively tightened.
Currently net long 111.3k, down 50.8k.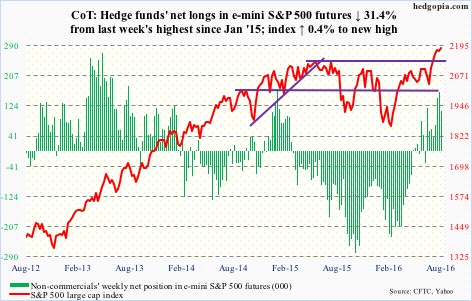
Euro: IHS Market Eurozone PMI rose to 53.2 in July from 53.1 in June. This was the first measure of full-month activity post-Brexit vote on June 23rd. No sign of contagion. At least not yet. So Mario Draghi, ECB president, would not need to provide additional stimulus measures then?
The euro’s five-session, 2.3-percent rally ended on Tuesday as the 100-day moving average proved tough to conquer. The daily chart is now overbought. It literally closed the week on the 200-day moving average.
Currently net short 104.1k, down 8.5k.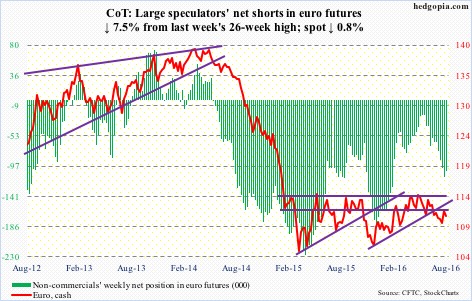
Gold: On Tuesday, spot gold managed to test the July 6th high of $1,377.5/ounce, but was rejected … near the daily upper Bollinger band. The daily chart has entered overbought territory, and can come under pressure in the right circumstances.
The week ended Wednesday reversed the recent trend of outflows from GLD, the SPDR gold ETF, attracting $680 million. This preceded outflows of $1.2 billion in the prior three (courtesy of ETF.com).
Currently net long 294.2k, up 15.2k.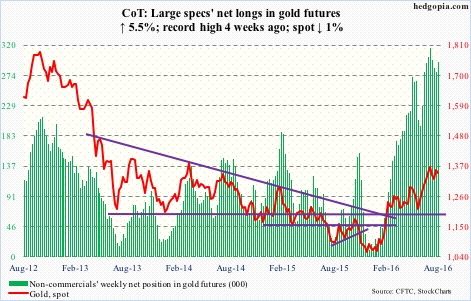
Nasdaq 100 index (mini): QQQ, the PowerShares Nasdaq 100 ETF, continued to attract funds, drawing $1.1 billion in the week ended Wednesday. In the prior week, $893 million came in (courtesy of ETF.com). They have been rewarded.
The index remains merely 0.5 percent away from the March 2000 all-time high of 4816.35, and has broken out of one-year resistance.
Currently net long 131.7k, up 11.4k.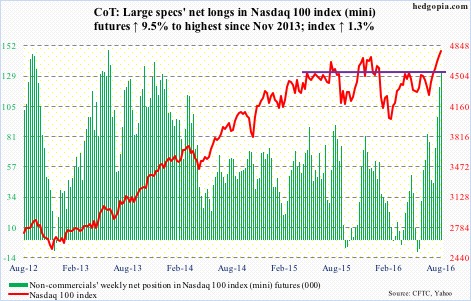
Russell 2000 mini-index: In the week ended Wednesday, another $680 million exited IWM, the iShares Russell 2000 ETF. This came on the heels of $1.1 billion in outflows in the prior week (courtesy of ETF.com).
This is not something small-cap bulls would have liked to see when they are trying to stage a breakout, as the Russell 2000 has been sideways since March 2014 within a wide range. But they have pulled one off.
Non-commercials have been a big help. They continue to get squeezed out of their net shorts.
Currently net short 2.1k, down 6k.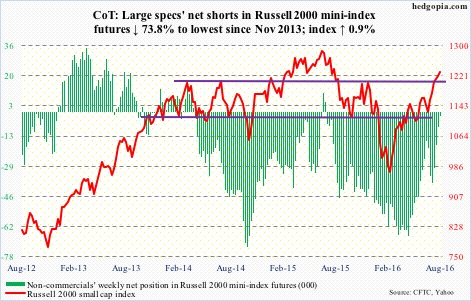
US Dollar Index: Can go both ways depending on if daily (oversold) or weekly (overbought) conditions prevail. Should it come under pressure, support lies at 94.50-95, which approximates a rising trend line drawn from the low in early May. The 200-day moving average should provide resistance on the upside.
Currently net long 17.7k, down 4.8k.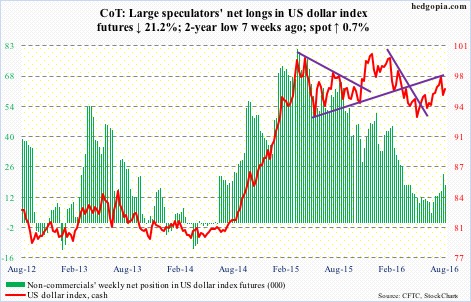
VIX: Spot VIX closed the week under 12 as well as slightly below the lower Bollinger band. This was the week’s third sub-12 reading. Bollinger bands have tightened; only a little over two points separate the two.
That said, on Monday through Wednesday, spot VIX continued to struggle to hang on to the gains, and continues to hover near the lower end of years-long range.
The VIX-to-VXV ratio has been in oversold territory the past six weeks, with the last four in the mid to high 0.70s and the first two in the low 0.80s. The rubber band is stretched!
Currently net short 114.6k, up 25.7k.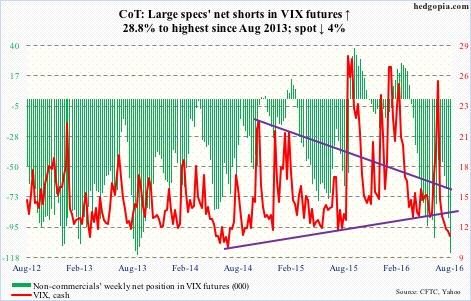
Hedgopia Risk Reward Index