Following futures positions of non-commercials are as of December 13, 2016.
10-year note: With the Fed this week having raised by 25 basis points the fed funds target rate to a range of 0.5 percent to 0.75 percent, its conventional monetary tool box is empty. In its eighth year of recovery, the U.S. economy is definitely not early- to mid-cycle. The next downturn is just a matter of when not if.
In an ideal world, the Fed would probably pounce on every opportunity it gets in filling its monetary quiver with arrows. Post-Great Recession, in markets versus the Fed, the latter has always acquiesced to the former’s craving for easy money. Think QE, taper tantrum, the Fed’s plans to hike four times this year (but hiked only once), and what not.
This time around, particularly post-Trump victory and markets’ focus toward fiscal policy, equities had baked in a rate hike this week but were still hovering near all-time highs. This was an opportunity for the Fed to go for a 50-basis-point raise, but went begging.
Currently net short 268.4k, up 39.8k.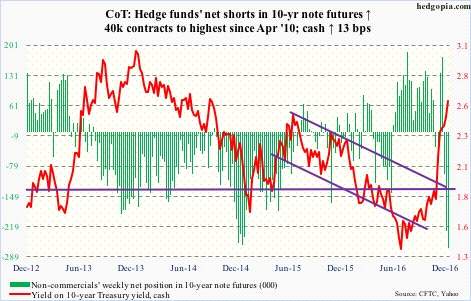
30-year bond: Major economic releases next week are as follows.
Existing home sales for November are published on Wednesday. October was up two percent month-over-month to a seasonally adjusted annual rate of 5.6 million units – the highest since February 2007.
Thursday brings durable goods orders (November, advance), GDP (3Q16; final), corporate profits (3Q16, revised), and personal income (November).
Orders for non-defense capital goods ex-aircraft – proxy for business capital expenditures – inched up 0.3 percent m/m in October to $62.9 billion (SAAR), but shrank 4.3 percent year-over-year. This was the 12th straight y/y contraction. Orders reached a cycle high $70.7 billion in September 2014.
The second estimate showed real GDP advanced at an annual rate of 3.2 percent in 3Q16 – much stronger than the 3Q09-3Q16 mean of 2.1 percent.
Corporate profits in 3Q16 increased 2.8 percent y/y to $2.15 trillion (SAAR). This was the first positive quarter after five consecutive negative quarters. Profits peaked at $2.22 trillion in 4Q14.
Core PCE (personal consumption expenditures) – the Fed’s favorite measure of consumer inflation – rose 1.74 percent y/y in October. Inflation has been inching up since it advanced 1.31 percent in July last year. That said, the last time it printed two percent or better was in April 2012.
New home sales (November) and the University of Michigan’s consumer sentiment index (December, final) come out on Friday.
New home sales dropped 1.9 percent m/m in October to 563,000 units (SAAR). Sales reached 622,000 this July – the highest since January 2008.
December consumer sentiment jumped 4.2 points m/m to 98, which is barely one-tenth of a point from the cycle high 98.1 in January 2015.
Currently net short 15.5k, down 28.1k.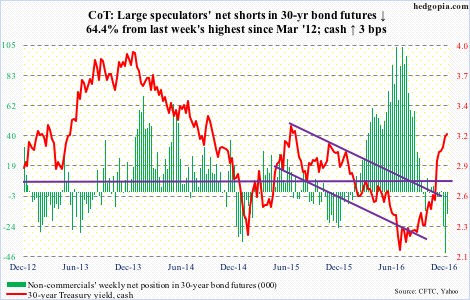
Crude oil: In the wake of the November 30th OPEC deal to cut output by 1.2 million barrels/day comes a non-OPEC agreement on December 11 to reduce by 558,000 b/d on their end. Now, markets will be nervously awaiting if the producers fully comply.
Plus, this probably gives a lifeline to struggling U.S. shale oil producers. U.S. oil rig counts, in fact, have gone up from 316 in May this year to 510. Strategically, it is not in OPEC’s interest to see a significant rise in oil price. On Monday, Nigeria’s petroleum minister said on Bloomberg TV that oil prices at $60/barrel would be “ideal” for OPEC. The Brent closed the week up 1.6 percent to $55.29.
From this respect, the potentially bullish inverse head-and-shoulders pattern on spot West Texas Intermediate crude likely does not complete. This week’s long-legged doji followed a doji last week. Although non-commercials’ net longs have risen to the highest since July 2014.
By Wednesday, bulls were unable to cash in on the EIA report.
In the week ended last Friday, U.S. crude stocks fell by 2.6 million barrels to 483.2 million barrels – a six-week low. Crude imports dropped by 943,000 b/d to 7.4 mb/d – a seven-week low. Distillate stocks declined by 762,000 barrels to 155.9 million barrels. And, refinery utilization inched up one-tenth of a point to 90.5 percent.
Gasoline stocks, however, rose by 497,000 barrels to 230 million barrels. This was a 15-week high. Crude production grew a tad, by 99,000 b/d to 8.8 mb/d. This was the highest since early May this year.
Currently net long 426.4k, up 60.2k.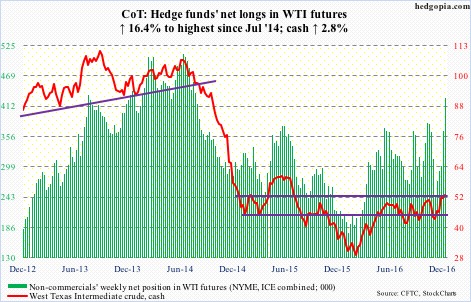
E-mini S&P 500: Is the public finally getting excited by the Trump rally? Possibly.
In the week ended Wednesday, $6.8 billion moved into U.S.-based equity funds (courtesy of Lipper). Since the week ended November 9, a little north of $28 billion has made its way into these funds.
In the ETF land, also in the week through Wednesday, SPY, the SPDR S&P 500 ETF, attracted $8.3 billion. This followed inflows of $4.5 billion in the prior week (courtesy of ETF.com).
In the same week, Investors Intelligence bulls were 59.6 percent, and bears 19.2 percent. This was the fifth straight week of bulls over 50 percent. Makes you wonder if there is anyone left out there to bull up in a seasonally favorable period.
In the meantime, the S&P 500 (cash) is beginning to show signs of fatigue, with a weekly doji. There were back-to-back inside days on Thursday and Friday. Bulls still have the ball, and it is theirs to lose.
Currently net short 118.7k, down 14.6k.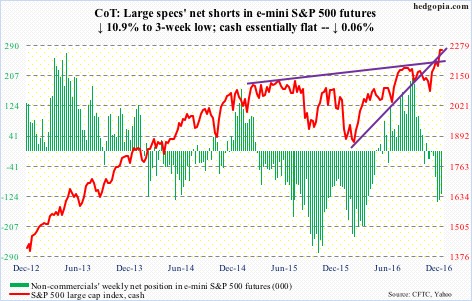
Euro: The November 23 (2016) low of 105.25 failed to hold. This support goes back nearly two years. As a result, the cash (104.51) suffered a 21-month box breakdown. Technicians could come up with a measured-move target of 94-95.
If there is any consolation, it is that the Thursday breakdown produced a long-legged doji, followed by a spinning top on Friday. If the currency manages to stabilize here, resistance at 105-plus is right above.
Currently net short 87.5k, down 27k.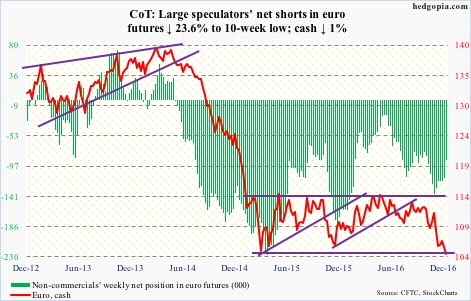
Gold: Gold bugs were unable to defend the .618 Fibonacci retracement of the November 30 (2015)-July 5 (2016) rally on the cash. That support lied at $1,172.3.
For more than a month, the cash ($1,137.4) has been trading along a declining 10-day moving average, even as flows have continued to disappoint.
In the week ended Wednesday, GLD, the SPDR gold ETF, lost another $533 million. This followed outflows of $3.6 billion in the prior four (courtesy of ETF.com).
Non-commercials continue to cut back net longs.
Currently net long 129.3k, down 7.1k.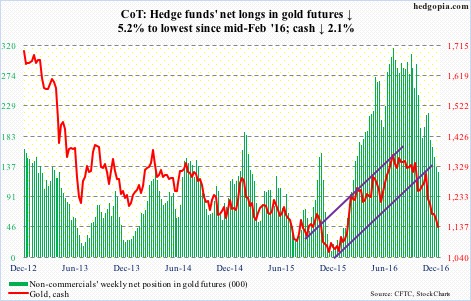
Nasdaq 100 index (mini): The cash finally joined the other major U.S. indices in scoring a fresh all-time high (4960.48), which it accomplished on Tuesday, but volume was nothing to write home about.
In the week ended Wednesday, QQQ, the PowerShares Nasdaq 100 ETF, attracted $2.1 billion, nearly offsetting $2.6 billion in outflows in the prior week (courtesy of ETF.com).
The tech-heavy ETF has otherwise struggled to attract funds since the U.S. election. From November 9 through December 14, $1.2 billion moved into QQQ, versus $19.9 billion into SPY and $5.4 billion into IWM, the iShares Russell 2000 ETF.
Remains to be seen if recent QQQ inflows are the beginning of a trend, and if breakout retest generates renewed buying interest. The Nasdaq 100 (4914.86) closed the week on that support. Next week is key.
Currently net long 77.1k, up 24.4k.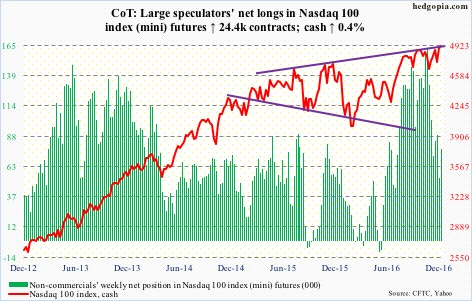
Russell 2000 mini-index: Last Friday’s daily doji just outside the upper Bollinger band was a sign that fatigue was setting in. From November 3 through December 9, the cash jumped north of 20 percent – and 16-plus percent post-Trump win.
Following last week’s 5.7-percent rally, IWM attracted $2.5 billion in the first three sessions this week (courtesy of ETF.com), but the ETF went on to lose 2.3 percent in those three sessions. Early signs of distribution? Possible. That said, momentum is yet to break. First line of support on the Russell 2000 (1364.19) lies at 1347.
Currently net long 55.9k, up 6.5k.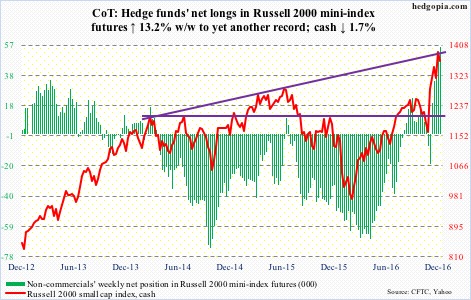
US Dollar Index: Dollar bulls could not have imagined this any better. Coming into the week, they had already defended the March 2015 high of 100.71 for three straight weeks. That resistance-turned-support was successfully tested this week in the first three sessions, laying the groundwork for Thursday’s 1.4-percent jump.
Wednesday’s FOMC statement/Chair Yellen’s press conference was interpreted as hawkish, with the 10-year T-note yielding as high as 2.62 percent on Thursday. Both the dollar and the long end of the Treasury yield curve are doing the Fed’s work, and will ultimately end up adversely impacting economic activity. The dollar index does not reflect this – not just yet.
Currently net long 56.7k, up 2.1k.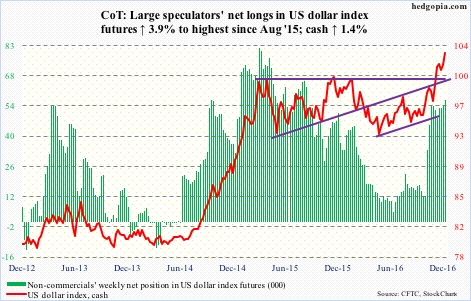
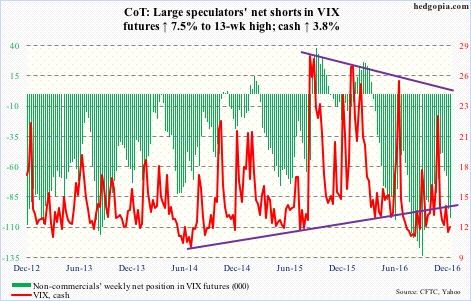
VIX: A mere 0.04 separates the 50- and 200-day moving averages on the cash. Both are flat to slightly dropping. A golden cross is probably just a matter of time. Similarly, 0.29 separates the 10-day from the 20-day, even as daily Bollinger bands are tightening.
Elsewhere, the VIX-to-VXV ratio has remained stuck in oversold zone for six straight weeks. And for eight consecutive sessions through Thursday the CBOE equity put-to-call ratio boasted readings of 0.50s (one of them in the 0.40s). Complacent enough?
One more.
It is quite rare for the S&P 500 put-to-call ratio to come in less than one. This is because institutions deploy these puts for hedging purposes. December so far has already produced three sub-one readings – 0.91 on the 7th, 0.89 on the 8th, and 0.81 on the 13th.
Currently net short 102.6k, up 7.2k.