The following are futures positions of non-commercials as of September 8, 2015. Change is week-over-week.
10-year note: More jawboning this week! Following in the footsteps of Christine Lagarde, IMF managing director, Kaushik Basu, World Bank chief economist, says the Fed risks triggering “panic and turmoil” in emerging markets if it decides to raise Fed funds rate next week.
Here at home, hawks within the FOMC got one more data to press their case. Non-farm job openings in July came in at 5.75 million (!), up 8.1 percent over June, which itself was upwardly revised. Will this JOLT the Fed into action? In normal circumstances, the answer would be yes, especially considering that they wanted to see “some” progress on the jobs front. They got “some,” and then some.
Two-year Treasury yields, having risen from 0.59 percent on August 24 to 0.75 percent Thursday, are probably betting that the Fed moves next week. On the other hand, commodities, equities, the long end of the Treasury yield curve, as well inflation expectations are essentially saying ‘not so fast’.
Needless to say, the Fed has talked itself into a corner, with strong voices in both yay and nay camps. Might as well flip a coin and decide.
Currently net short 23.9k, up 21.1k.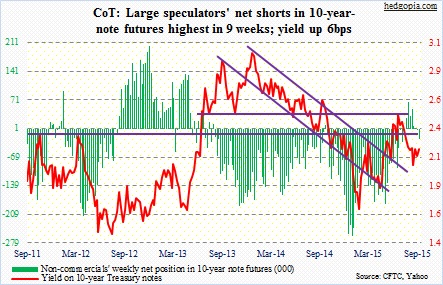
30-year bond: Next week is data-heavy.
Retail sales for August are reported on Tuesday. July was up 0.6 percent month-over-month; June was revised higher as well. Sequential growth has been positive the past five months, after negative readings in the three before that. Year-over-year, growth has been cut in half from five percent last August. Momentum is slowing.
Also on Tuesday, we get August’s industrial production. Capacity utilization has been under pressure since the 79 percent reading last November. July was a percentage point lower, and was up m/m. Let us see if this continues. For seven straight months through June, utilization contracted m/m. Annually, it has dropped for three consecutive months.
On Wednesday, the FOMC meeting begins, and ends on Thursday.
Wednesday has three other important releases scheduled – the consumer price index for August, the NAHB housing market index for September, and July’s treasury international capital data. The CPI rose 0.1 percent in July, and 0.2 percent annually. Core CPI ticked up 0.1 percent, and 1.8 percent over the last 12 months. Core CPI has been registering higher readings than core PCE – the Fed’s favorite gauge of inflation…Builder sentiment is elevated – August matched the November 2005 high of 61…When the TIC data comes out, it will be interesting to see China’s Treasury holdings. In June, they held $1.27 trillion worth, having peaked at $1.32 trillion in November 2013. Although August is the real one to watch. That was when the yuan was devalued, and Treasuries were probably sold to defend the currency.
On Thursday, housing starts for August are on tap. Of late, momentum is building. July was 1.2 million (SAAR) – highest since October 2007. The 12-month rolling average has stayed north of a million for eight straight months. Builders finally putting their money where their mouth is?
No FOMC member is scheduled to speak except for Chair Yellen’s post-meeting press conference on Thursday.
Currently net short 8.3k, up 1.7k.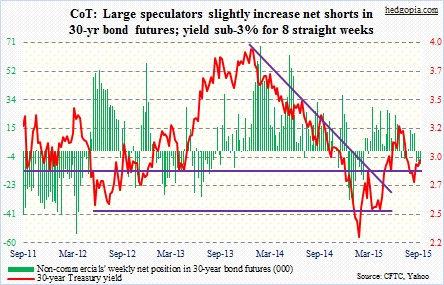
Crude oil: Crude inventory rose by 2.6 million barrels week-over-week, to 458 million barrels – a six-week high. Gasoline (up 384,000 barrels, to 214.5 million barrels) and distillate (up 952,000 barrels, to 150.9 million barrels) were up as well. Refinery utilization was down (from 92.8 to 90.9; peaked at 96.1 a month ago) – expected as the summer driving season comes to an end. Refinery shutdowns for maintenance lie ahead. These are all negatives.
Positives came from production and rig counts. Crude production declined 83,000 barrels a day, to 9.14 million barrels a day; it peaked at 9.61 million barrels a day in the June 5th week. Then, drillers cut 10 rigs in the latest week, to a total count of 652. Might this be impacting production going forward? The IEA thinks so, saying the price collapse is closing down high cost production from Eagle Ford (TX) to Russia to the North Sea, and that reductions in non-OPEC oil production may result in the loss of half a million barrels a day next year.
As far as the week went, the negatives won over. Spot West Texas Intermediate crude was down 2.2 percent. The path of least resistance – at least near-term – continues to be down. Bulls were unable to take out resistance at 49-50 two weeks ago, and need to defend 43.
Even though the three-week spike into the end of August failed to tempt non-commercials into adding to net longs, it seems to have worked belatedly. They increased net longs to a nine-week high.
Currently net long 281.3k, up 27.2k.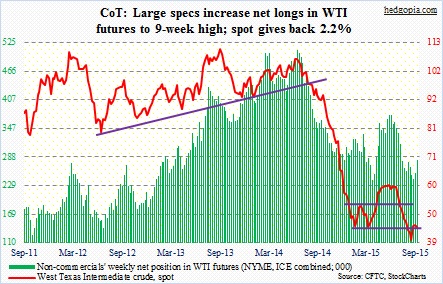
E-mini S&P 500: Sentiment is so bad it feels good. One could argue that way. At 25.7 percent, Investors Intelligence bulls are the lowest since late 2008, although the ranks of bears, at 27.9 percent, are yet to spike. And short interest continues to rise. On SPY, the SPDR S&P 500 ETF, it shot up 19.3 percent in the August 31st period to 373.1 million. Interestingly, this period includes the four-session, 6.8-percent jump since the August 24th low. That spike probably caused a squeeze, but not enough to scare away the bears.
The good thing is, markets have absorbed all that short-selling. Here is the bad. By doing so, a lot of buying power has been expended. This at a time when outflows are growing. In the August 9th week, U.S.-based stock funds saw outflows of $16.2 billion, following $3.9 billion inflows last week (courtesy of Lipper). Funds focused on U.S. shares saw outflows of $14.3 billion, while those specializing in international shares had $1.9 billion in outflows.
Non-commercials are not convinced that the current rally has the staying power. They further added to net shorts. During the week ended this Tuesday, the S&P 500 added 55 points, but that did not stop these traders from adding.
Currently net short 226.9k, up 46.4k.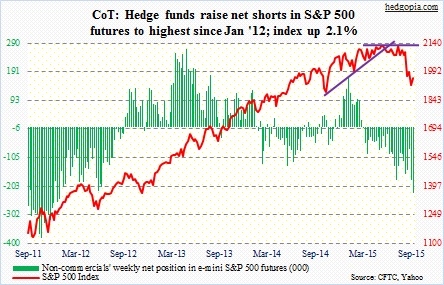
Euro: Benoit Coeure, ECB executive board member, said on Friday Eurozone growth is still too weak to create a sufficient number of jobs. “When inflation is weak, the best way to bring it up to the two percent objective is to support economic activity.” Just last week, Mario Draghi, ECB president, said there will be more stimulus, if the need be. They may be trying to jawbone the currency market, but traders are not listening. The euro rallied 1.7 percent for the week. In the end, Mr. Draghi and his team might just be forced to do more. Currently, the ECB spends €60 billion/month in asset purchases.
Currently net short 81.2k, up 13.4k.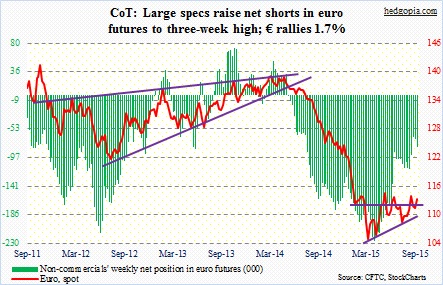
Gold: The spot continued lower. A weak dollar was no help. On a daily chart, the metal bounced off of its lower Bollinger Band on Friday, and momentum indicators are in oversold territory. If it cannot rally here, gold bugs need a prayer. With that said, it is hard to imagine a sustained move higher near-term. The 110 resistance on GLD is holding, with the 50-day moving average still pointing lower.
It is possible gold gets some help toward the end of the month. Current funding for the U.S. government expires on September 30. The borrowing limit needs to go up… but maybe not before some DC drama. It is possible the government shuts down – no matter how fleeting.
Having added to net longs for five weeks only to see gold head lower, non-commercials gave up this week. Net longs were cut by more than 18 percent.
Currently net long 59.3k, down 13.4k.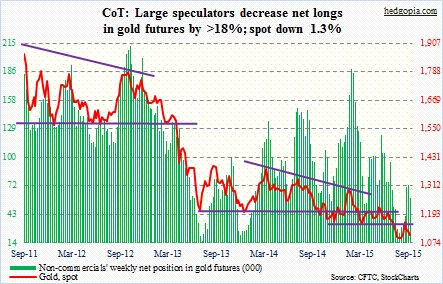
Nasdaq 100 index (mini): Investors returned from the holiday all bulled up, and they wanted to own tech. Apple (AAPL), of course, helped – up 4.5 percent for the week. Going forward, clues will probably come from semis.
Non-commercials are not that impressed. They continue to remain net short for the second consecutive week. Directionally, they are positioned the same way as are non-commercials in S&P 500, Russell 2000, and VIX futures. This is rare. Traders are heavily net short S&P 500 futures at the same time as they are heavily net long VIX futures. If they are right, bad news for equity bulls. If they are wrong, there is a massive squeeze coming. Probably time for long straddle/strangle?
Currently net short 5.8k, down 326.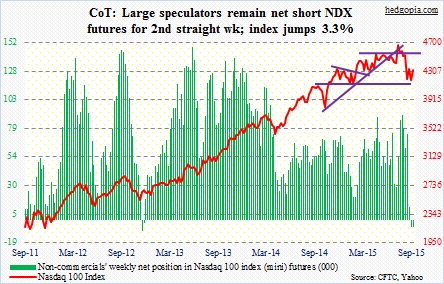
Russell 2000 mini-index: Is risk-on making a comeback? High-yield bond funds attracted $186 million of inflows in the August 9th week – first inflows in three weeks. This is too small an amount. Nonetheless, if risk-on is indeed making a comeback, it is not yet evident in small-caps. The Russell 2000 underperformed – up only 1.9 percent.
Non-commercials reduced net shorts by 10 percent, but still have sizable short exposure.
Currently net short 37.5k, down 4.3k.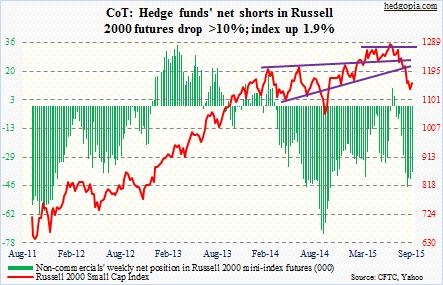
US Dollar Index: There were more signs of slowdown in China. Alibaba (BABA) expects 2Q gross merchandise volume to be lower than prior estimates due to weaker consumer spending. Torsten Mueller-Oetvoes, Rolls Royce chief, said on Bloomberg TV the Chinese market is currently seeing quite a contraction in the luxury goods business. General Motors (GM) said China sales in August fell 4.8 percent y/y to 249,000, and Ford’s (F) fell three percent y/y to 79,600. Last but not the least, on the heels of an 8.3-percent decline in July, China exports fell 5.5 percent in August. Potentially more yuan devaluation down the line?
The dollar index, by the way, does not have yuan in its basket. But it does have euro – a hefty 57.6 percent weight. In the wake of Mr. Draghi’s comments last week about possible expansion in the ECB’s stimulus program, non-commercials were indifferent.
Currently net long 53.4k, up 2.2k.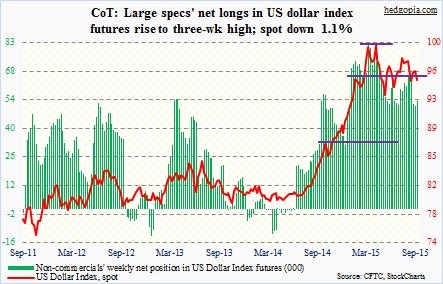
VIX: Yet another record! Non-commercials are piling on. In the week ended this Tuesday, spot VIX dropped nearly 21 percent, but this did not stop these traders from increasing net longs by another 18 percent. The spot has stayed north of 20 for the fourth consecutive week, and this probably has emboldened them.
Currently net long 37.9k, up 5.7k.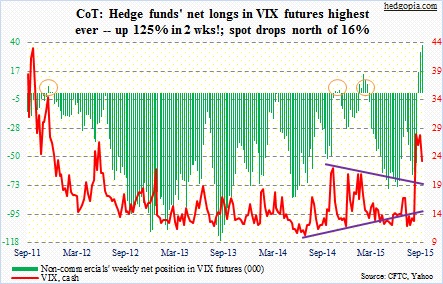
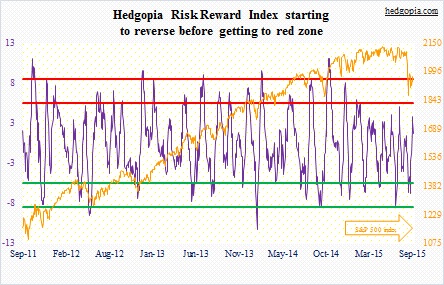
Hedgopia Risk Reward Index