
Following futures positions of non-commercials are as of June 25, 2019.
10-year note: Currently net short 281.1k, down 121.9k.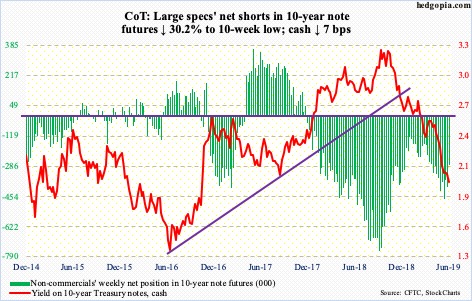
Since peaking at 3.25 percent last October through the intraday low seven sessions ago of 1.98 percent, the 10-year Treasury yield (two percent) has priced in a lot of things, including easier monetary policy. Fed funds futures currently expect a 25-basis-point cut in July to a range of 200 to 225 basis points, followed by another cut of the same magnitude in September, and maybe another in December. This is aggressive. The Fed has not quite shown its hand but has increasingly turned dovish.
The eight-month, 127-basis-point drop in the 10-year rate has pushed daily and weekly indicators into deep oversold territory. Medium- to longer-term, rates are probably still headed lower, but it is possible they are in the process of basing near term. Fed action could very well drive this near term. Here are a few scenarios.
If in July (30-31), the Fed pulls a surprise and cuts by 50 basis points, this could initially drive the 10-year rate lower, but this likely gets faded as this could also mean substantially reduced odds of continued aggressive easing. If the Fed continues its dovish posture but does not cut, this likely gets interpreted as policymakers’ conviction in the economy, resulting in higher yields. If the Fed cuts by 25, yields likely rally as the move is already priced in. If the Fed cuts by 25 and suggests that markets’ rate-cut expectations are too high, this probably is even more reason for rates to rally.
30-year bond: Currently net long 16.2k, down 2.1k.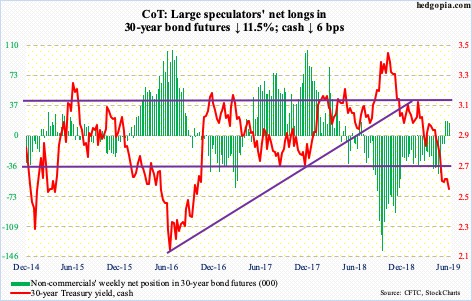
Major economic releases next week are as follows. Happy Independence Day!
June’s ISM manufacturing index comes outs Monday. In May, manufacturing activity fell seven-tenths of a point month-over-month to 52.1 – a 31-month low. The cycle high 60.8 – also the highest since May 2004 – was hit last August.
The ISM non-manufacturing index (June) and durable goods (May, revised) are scheduled for Wednesday.
Services activity in May rose 1.4 points m/m to 56.9. Last September’s 60.8 was the highest ever, with the data only going back to January 2008.
Preliminarily, orders for non-defense capital goods ex-aircraft – proxy for business capex plans – rose 1.3 percent year-over-year to a seasonally adjusted annual rate of $69 billion. Last July, orders peaked at $70 billion.
The employment report for June is on tap Friday. May shockingly only produced 75,000 non-farm jobs. This was the second month this year of sub-100,000 jobs, with February creating 56,000.
Crude oil: Currently net long 547.3k, up 34.4k.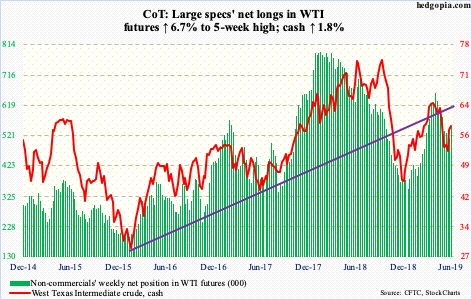
The cash ($58.47/barrel) Tuesday was rejected at the 200-day. Come Wednesday, the average was won over. The EIA report for the week of June 21 was the catalyst. The report showed US stocks of crude dropped 12.8 million barrels to 469.6 million barrels. Stocks of gasoline and distillates fell as well, down 996,000 barrels and 2.4 million barrels to 232.2 million barrels and 125.4 million barrels. As did crude production, down 100,000 barrels per day to 12.1 million bpd, and crude imports, down 811,000 bpd to 6.7 mbpd. Refinery utilization rose three-tenths of a percentage point to 94.2 percent.
It was an out-and-out good report, and bulls pounced on it. Wednesday, the crude jumped 2.7 percent and was up as much as 3.6 percent at session highs; the intraday high of $59.93 just about tested – unsuccessfully – a falling trend line from April 23 when the cash peaked at $66.60. WTI has come a long way from the first half this month when it based at $50-51. The daily is now in overbought territory. The now-converging 50- and 200-day were lost Friday.
E-mini S&P 500: Currently net long 86.5k, up 34.6k.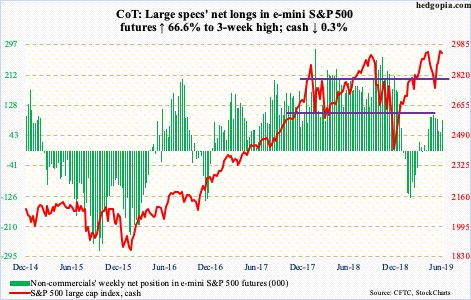
Last week’s record high in the cash (2941.76) elicited mixed reaction in flows. In the week to Wednesday, US-based equity funds lost $4.3 billion (courtesy of Lipper). In the same week, SPY (SPDR S&P 500 ETF), VOO (Vanguard S&P 500 ETF) and IVV (iShares core S&P 500 ETF) gained a combined $1.5 billion (courtesy of ETF.com).
After three consecutive positive weeks, the S&P 500 fell 0.3 percent this week, although it was up one percent from Wednesday’s low. Last week’s high of 2964.15 barely surpassed the prior high of 2954.13 from May 1, which itself squeaked by the September 2018 high of 2940.91. Back in January last year, the index retreated after hitting 2872.87. So, for over a year now the index has gone back and forth a lot without making a whole lot of progress.
Interestingly, this is also a period in which buybacks went through the roof. In 1Q18, S&P 500 companies spent $205.8 billion, for a four-quarter total of $823.2 billion – a new record. Buybacks have essentially filled the vacuum left primarily by foreigners and margin debt (more here). Medium- to long-term, the current buyback momentum is hard to sustain.
Euro: Currently net short 56.3k, up 4k.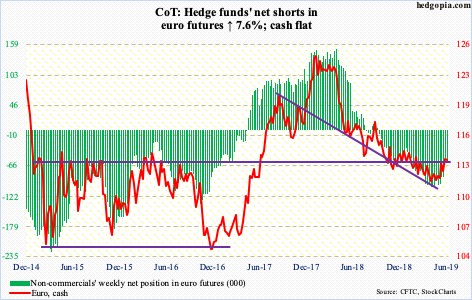
The cash ($113.78) opened the week with a 0.1-percent rally just outside the daily upper Bollinger band. On Friday last week, it had reclaimed the 200-day. In doing so, the euro already expended a lot of energy, having rallied from $111.82 on June 18 – nine sessions ago.
The currency is clinging on to the 200-day ($113.58), but with the daily extended, breach risks are rising. There is decent support at $113, and the 50-day ($112.32) after that.
Gold: Currently net long 236.6k, up 32.2k.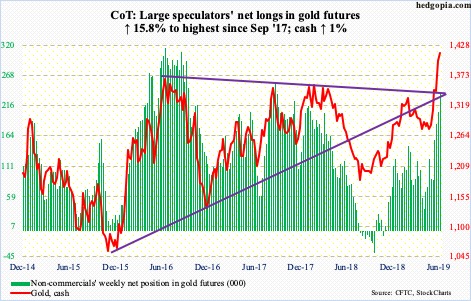
The cash ($1,413.70/ounce) continued to put up a good show this week – up for six straight – but not before charting out a weekly shooting star. Tuesday, gold bugs rallied the metal all the way to $1,442.90 but were unable to hang on to the gains. The daily in particular is way extended. Shorter-term moving averages are still rising – sharply at that. Having just staged a major breakout, bulls are not going to give those up that easy. They will face a bigger test when a retest of that breakout – $1,350s-1,360s – occurs.
When that happens, it will be interesting how flows behave. In the week to Wednesday, GLD (SPDR gold ETF) took in $1.5 billion and IAU (iShares gold trust) $199 million (courtesy of ETF.com). This was IAU’s second positive week in 11. In the prior five, GLD gained $1.3 billion.
Nasdaq 100 index (mini): Currently net long 22.6k, up 1.1k.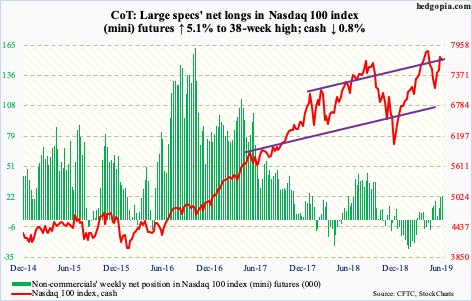
Thursday last week, the cash (7671.07) came within one percent of surpassing its record high of 7851.97 from April 25. A breakout had the potential to squeeze shorts. As of mid-June, Nasdaq short interest stood at a three-plus-year high (more here). At least until June 14, shorts were staying put. This may have changed in the current period because as soon as the second half began, both the Nasdaq composite and 100 reclaimed the 50-day. But then again, the indices failed to post a new high.
From June 3 to last week’s high, the Nasdaq 100 jumped 12 percent, pushing the daily into gross overbought territory. As things stand, odds favor these shorts, particularly so if the Nasdaq 100 loses the 50-day (7538.94). Another dynamic to consider is flows into QQQ (Invesco QQQ trust), which in the week to Wednesday attracted $2.8 billion (courtesy of ETF.com). This was the largest weekly haul since March this year. The Nasdaq 100 lost 0.8 percent this week. These investors’ patience is getting tested.
Russell 2000 mini-index: Currently net short 63.8k, up 14.7k.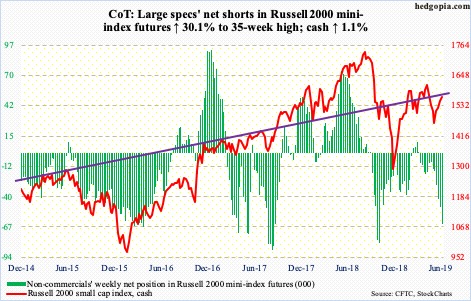
In the week to Wednesday, $849 million came out of IWM (iShares Russell 2000 ETF) while IJR (iShares core S&P small-cap ETF) took in $43 million (courtesy of ETF.com). Until Thursday’s 1.9-percent jump, the cash (1566.57) fell for four straight sessions. Both the 50- and 200-day were lost and then recaptured.
If small-cap bulls have indeed put their foot down Thursday, the intraday high of 1570.74 is the one to watch for now. Friday’s 1.3-percent rally brought the Russell 2000 closer to this resistance. Right around there also lies a falling trend line from last August when the index peaked at 1742.09. Reclaiming of 1570s opens the door to a test of major resistance just north of 1600.
US Dollar Index: Currently net long 22.4k, down 6.2k.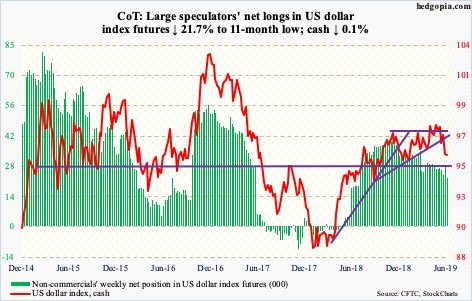
The cash (95.67) went on to post a three-month low of 95.37 Tuesday before bids showed up at the daily lower Bollinger band. Decent support also lies just north of 95. Thus far, this is holding. Before this, the US dollar index last week lost the 200-day as well as a rising trend line from last September. The two are converging, with the 200-day at 96.31and the trend-line resistance at 96.50. If the index gets there, shorts likely get active.
VIX: Currently net short 116.7k, up 8.1k.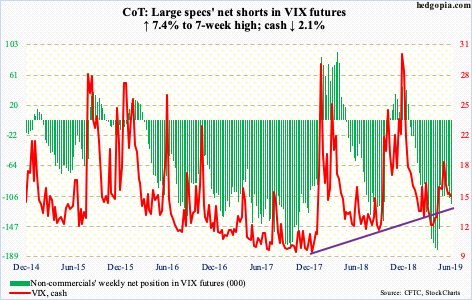
The cash (15.08) essentially traded between the 50- and 200-day, until Friday when the former was lost, albeit just slightly. The daily has rallied into overbought territory. This is an opportunity for volatility bears. Last week, VIX briefly dropped to 13.19 intraday before rebounding. The daily lower Bollinger band lies at 14.01.
Concurrently, the 21-day moving average of the CBOE equity-only put-to-call ratio, which reached 0.706 on June 5, ended the week at 0.628, down from last week’s 0.652. The ratio dropped even as the S&P 500 slightly fell this week. Unwinding can continue until the ratio drops to low-60s/high-50s.
Thanks for reading!
