
Following futures positions of non-commercials are as of Aug 1, 2017.
10-year note: Currently net long 210.9k, down 69.8k.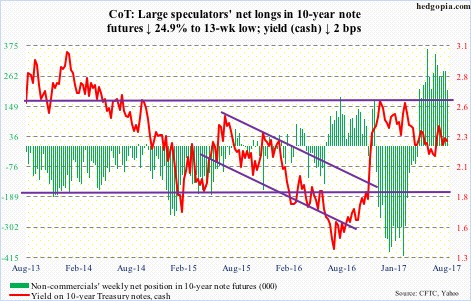
So far this year, there have been two rate hikes – and four altogether since the Fed started raising in December 2015. The fed funds rate currently stands at 1.16 percent, up 100 basis points since then.
The dot plot suggests the FOMC would like to move one more time this year. The futures market has its doubts.
There are three more meetings left this year – September 19-20, October/November 31-1, and December 12-13. The latter has the highest odds of a 25-basis-point increase, and it is only at 45 percent, up from 42 percent pre-jobs report Friday. July created 209,000 non-farm jobs, better than 183,000 expected.
That said, the U.S. economy is hardly accelerating.
Both ISM manufacturing and non-manufacturing fell in July – down 1.5 points and 3.5 points month-over-month to 56.3 and 53.9, respectively. In manufacturing, 57.8 in June was the highest since August 2014, and has room to continue lower.
Inflation is in deceleration for the past several months, with both core PCE and core CPI under the Fed’s target of two percent.
Will the Fed pause in December? Or would it still go ahead and hike in order to curb rising asset inflation? ‘Markets versus the Fed’ lies ahead.
30-year bond: Currently net long 48.8k, down 7.6k.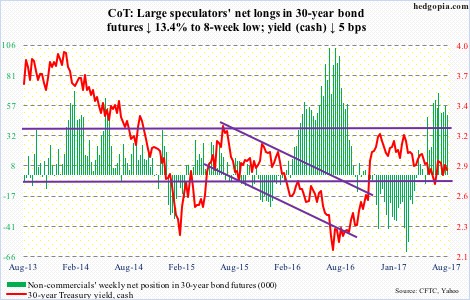
Major economic releases next week are as follows.
Tuesday brings the NFIB optimism index for July and JOLTS for June.
Small-business optimism fell nine-tenths of a point m/m in June to 103.6. Since reaching a 12-year-high 105.9 in January, optimism has lost some of the post-election enthusiasm.
Non-farm job openings dropped 301,000 m/m in May to 5.67 million. April’s record 5.97 million tied with July last year.
Preliminary productivity numbers for 2Q17 are reported Wednesday.
Output per hour was unchanged in 1Q17, as both output and hours worked grew 1.7 percent. This was preceded by rise of 3.3 percent in 3Q16 and 1.7 percent in 4Q16.
July’s PPI-FD comes out Thursday. Producer prices rose 0.4 percent m/m in June. In the 12 months through May, the PPI fell 0.7 percent. Core PPI rose 0.3 percent in June and 0.7 percent in the 12 months through June.
The CPI for July is due out Friday.
Consumer prices were unchanged m/m in June and increased 1.6 percent in the 12 months through June. Core CPI inched up 0.1 percent in June and 1.7 percent in the 12 months through June. This was the third straight sub-two-percent rise in core CPI after 17 consecutive increases over two percent.
Crude oil: Currently net long 498k, up 53.8k.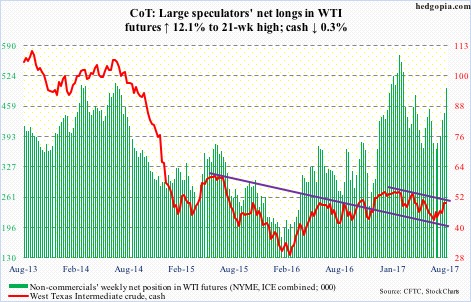
The trend-line resistance from February this year is proving a bit too much to conquer.
After rallying 20 percent from June 21 low, spot West Texas Intermediate crude ($49.58/barrel) was rejected at that resistance. Tuesday, it rallied to $50.43, before coming under slight pressure.
As things stand, with the daily chart overbought, bulls and bears are fighting a tug of war at the 200-day moving average. The 50-day lies at $46.46. Plus, there is support at $47.
From the inventory perspective, Wednesday’s EIA report was not that bad, but other elements were mixed.
For the week ended July 28, crude stocks fell 1.5 million barrels to 481.9 million barrels. From the all-time high 535.5 million barrels in the March 31st week this year, stocks are now down 53.7 million barrels, although they are still higher than the five-year average of 409.6 million barrels.
Gasoline stocks dropped 2.5 million barrels to 227.7 million barrels – a 31-week low. Distillate stocks decreased 150,000 barrels to 149.4 million barrels – a nine-week low.
Capacity utilization rose 1.1 percentage points to 95.4 percent. This was the highest since August 2015.
On the other hand, crude imports increased 209,000 barrels per day to 8.25 million b/d – an eight-week high.
Crude production rose 20,000 b/d to 9.43 mb/d. This was a two-year high. Since OPEC reached an agreement to cut back production by 1.8 mb/d last November, U.S. production has gone up by 731,000 b/d.
E-mini S&P 500: Currently net long 79.5k, down 28.7k.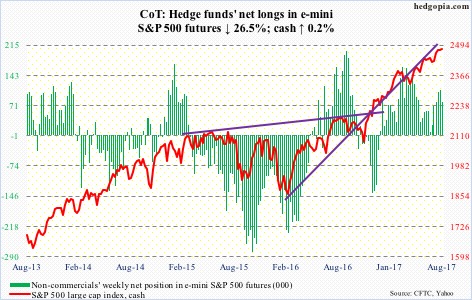
Thursday last week produced a hanging man on the cash. There was another this week on Wednesday. Friday was a doji. The 10-day is flat, with a fresh MACD cross-under on the daily chart.
Nearest support lies at 2450 – not that far away from the 50-day (2443.76).
In the week to Wednesday, U.S.-based equity funds lost another $133 million. In the last three, they lost $4.1 billion (courtesy of Lipper).
In the ETF land in the same week, SPY (SPDR S&P 500 ETF) saw outflows of $969 million, but this was offset by combined inflows of $905 million into VOO (Vanguard S&P 500 ETF) and IVV (iShares core S&P 500 ETF) – $358 million and $547 million, respectively (courtesy of ETF.com).
Euro: Currently net long 82.6k, down 8.2k.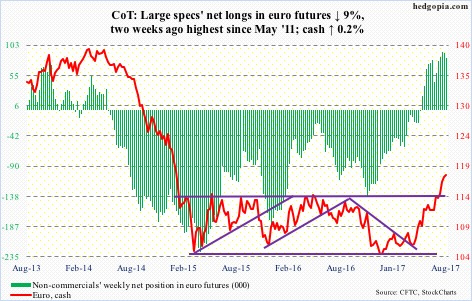
Eurozone GDP expanded 0.6 percent in 2Q17, following 0.5-percent growth in 1Q17. Growth was up 2.1 percent y/y in 2Q17.
The ECB is continuing with its stimulus program, but the euro (117.74) is beginning to price in an unwinding.
Through Wednesday’s intraday high of 119.09, the cash rallied 13.1 percent this year. Resistance at 119/120 goes back several years. At least for now, this seems to be holding.
Gold: Currently net long 129.7k, up 38.8k.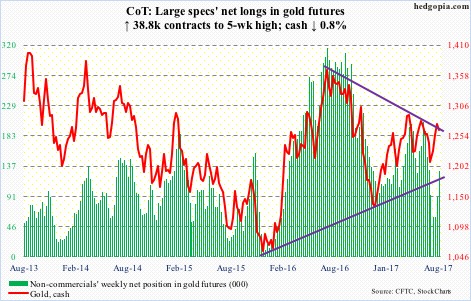
Last week, the cash ($1,264.6/ounce) feebly broke out of a falling trend line from July last year, but struggled to build on it this week. It did rally to $1,280.3 on Tuesday. Resistance at $1,300 was not tested.
GLD (SPDR gold ETF) continues to struggle to attract funds. In the week to Wednesday, it lost $142 million, with last Thursday the only session the ETF saw activity. In the last seven weeks, $2.5 billion has been withdrawn (courtesy of ETF.com).
The daily chart is extended. In the event the metal comes under pressure, the 50-day lies at $1,253.64.
Nasdaq 100 index (mini): Currently net long 55.8k, up 2.5k.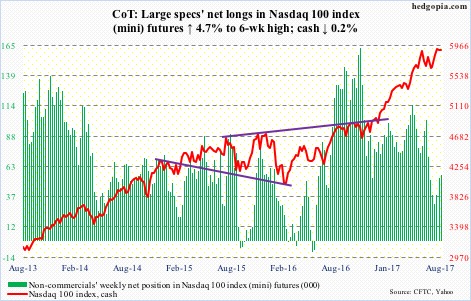
In the week through Wednesday, QQQ (PowerShares Nasdaq 100 ETF) lost another $925 million. This followed outflows of $2.6 billion in the prior week (courtesy of ETF.com).
Last week produced a spinning top on the cash. This week, both Apple (AAPL) and Tesla (TSLA) reported. The results were received well, but not enough to push the Nasdaq 100 higher.
Through the all-time high of 5995.77 on Thursday last week, the Nasdaq 100 rallied 7.5 percent in three weeks. It is probably time to digest the gains.
The 50-day lies at 5798.92.
Russell 2000 mini-index: Currently net short 43.5k, up 12.8k.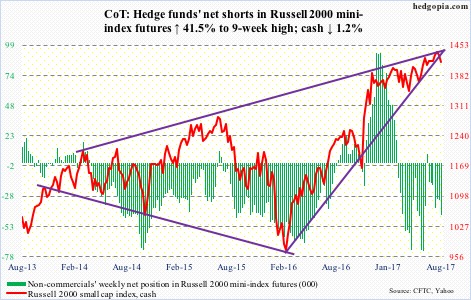
The cash this week lost a rising trend line from February last year – but barely.
The Russell 2000 (1412.32) has been trapped within a rising wedge for three years now, with the upper bound persistently repelling breakout attempts throughout this year, including the prior two weeks. This week, it shed 1.2 percent, and is now only up 4.1 percent for the year. It is lagging its major U.S. peers.
It will be interesting to see if small-cap bulls will step up to save breakout retest, and/or recapture the 50-day (1415.01).
For several months, the index remained range-bound between 1390s and 1340s, before breaking out two months ago. The bears would score big if that support is lost.
In the week to Wednesday, IWM (iShares Russell 2000 ETF) did take in $2.1 billion. In the prior five, $4.6 billion was redeemed (courtesy of ETF.com).
US Dollar Index: Currently net short 1.6k, down 938.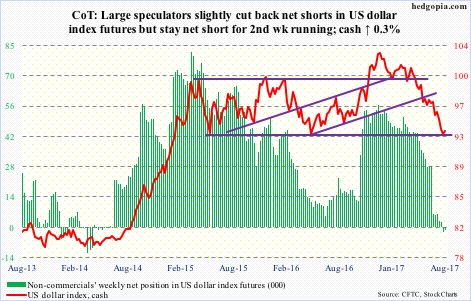
Prior to Friday’s 0.8-percent rally, the cash (93.42), under relentless pressure this year, was unable to catch a break.
However, Wednesday’s intraday low of 92.39 tested another crucial support – 92-plus goes back to at least 1998.
Odds of a rally have grown, but resistance is galore – 93.95, 95.30 and 96.50. The 50-day lies at 95.64.
VIX: Currently net short 158.1k, up 21.5k.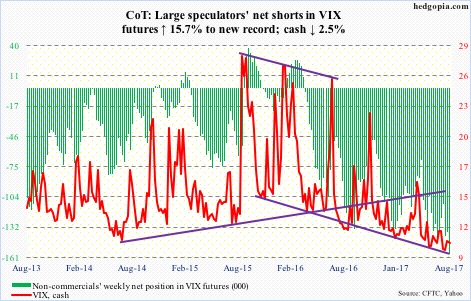
This week, the cash (10.03) went sub-10 intraday in four out of five sessions, but managed to pull itself up to close north of 10 each time.
From volatility bulls’ perspective, the good thing – if it can be called that – is the now-rising 10-day was defended three times. Also, daily Bollinger bands are beginning to narrow.
A weekly MACD crossover – potentially bullish – seems to be in the making.
Thanks for reading! Please share.
