
Following futures positions of non-commercials are as of November 5, 2019.
10-year note: Currently net short 231.5k, up 115.4k.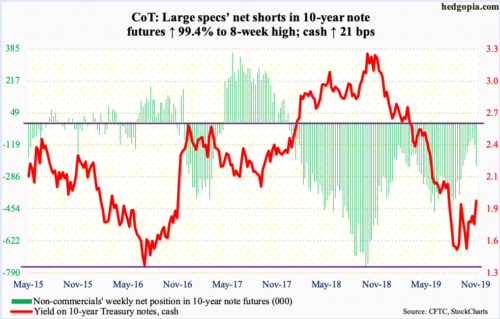
The 10-year Treasury yield (1.93 percent) bottomed on September 3 at 1.43 percent. Since then, rates have formed higher lows, followed Thursday by higher highs – the session high 1.97 percent versus the prior high of 1.90 percent on September 13. Bond bears (on price) would like this pattern. (Price and yield go the opposite direction.)
Near term, though, bond bulls have an opportunity to put their foot down. They likely showed up at/near Thursday’s session high. Resistance at two percent – or just under that – goes back to the middle of June.
Should yields come under pressure, the 50-day moving average lies at 1.71 percent. If this is breached, trend-line support from September around 1.60 percent is a must-save. The advantage bond bears currently have is that they have cut back their massive net shorts in 10-year note futures, although holdings rose by a decent amount this week. Nevertheless, the risk of a short squeeze is lesser now versus September last year when these traders held record net shorts.
30-year bond: Currently net short 54.6k, up 31.4k.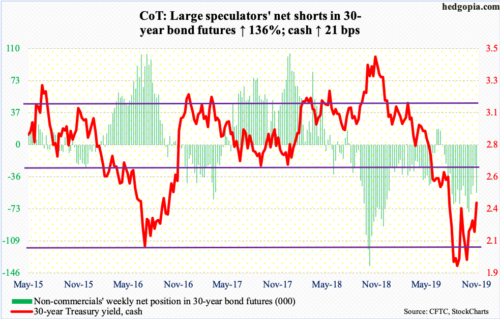
Major economic releases next week are as follows. The bond market is closed Monday for observance of Veterans Day.
The NFIB optimism index is due out Tuesday (October). Small-business optimism dropped 1.3 points month-over-month in September to 101.8. This was the 34th 100-plus reading in a row, including the all-time high 108.8 from August last year.
Consumer inflation is scheduled for Wednesday (October). Over August, the consumer price index was flat in September, while core CPI inched up 0.1 percent. In the 12 months to September, they rose 1.7 percent and 2.4 percent, in that order.
The producer price index comes out Thursday (October). Producer prices in September fell 0.3 percent m/m, while rising 1.4 percent year-over-year. Core PPI over the same time period respectively were unchanged and up 1.7 percent.
Friday brings retail sales (October) and industrial production (October).
Retail sales in September increased 4.1 percent y/y to a seasonally adjusted annual rate of $525.6 billion. In August, sales peaked at $526.9 billion.
Capacity utilization fell 2.3 percent y/y in September to 77.5 percent. This was the sixth consecutive y/y decline in utilization, which reached the cycle high 79.6 percent last November.
WTI crude oil: Currently net long 558.7k, up 26.4k.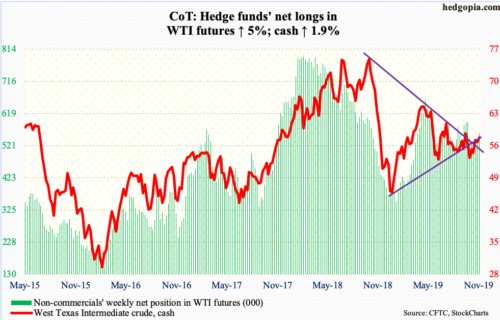
Rally attempts this week hit a roadblock at the 200-day ($57.26). In all five sessions, the cash ($57.24/barrel) surpassed the average intraday but was unable to close. It is also finding resistance at the daily upper Bollinger band. Several weekly indicators have reached the median. The RSI (52), for example, has turned back down from around here in the past four months. Bulls need to regain momentum.
Crude stocks in the week to November 1 did not favor the bulls. The EIA report, out Wednesday, showed stocks jumped 7.9 million barrels to 446.8 million barrels – a 16-week high. Crude production, too, remained unchanged at 12.6 million barrels per day. This was the fifth straight week of record production. Refinery utilization fell 1.7 percentage points to 86 percent. Gasoline and distillate stocks, however, fell – down 2.8 million barrels and 622,000 barrels to 217.2 million barrels and 119.1 million barrels respectively. Crude imports dropped 620,000 bpd to 6.1 mbpd.
E-mini S&P 500: Currently net short 117, up 33.7k.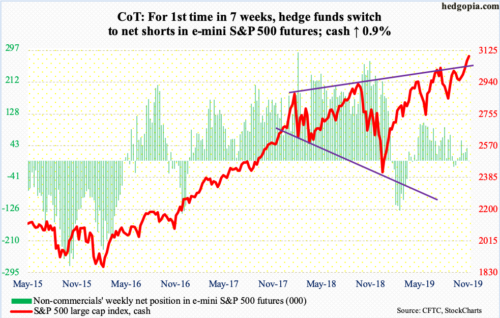
It was yet another positive week on the cash (3093.08) – fifth in a row – and up 0.9 percent for the week. That said, subtle signs of fatigue are showing up. Except for Friday, bulls struggled to hold on to all the gains, leaving behind upper shadows on the candles. During the week, there were two daily dojis plus a hanging man. With all that said, bulls continue to hold the momentum ball, regardless how overbought the daily is.
In the event of a pullback, immediate support lies at 3050, and 3020s after that, with the latter a breakout retest.
Flows were pretty much a meh. In the week through Wednesday, US-based equity funds lost $59 million (courtesy of Lipper). In the same week, SPY (SPDR S&P 500 ETF), VOO (Vanguard S&P 500 ETF) and IVV (iShares Core S&P 500 ETF) gained a combined $1.9 billion (courtesy of ETF.com). The Lipper data also show money-market funds took in $34.4 billion, which was the highest weekly total in six; the supposed ‘dry powder’ keeps building.
Euro: Currently net short 60.7k, up 7.4k.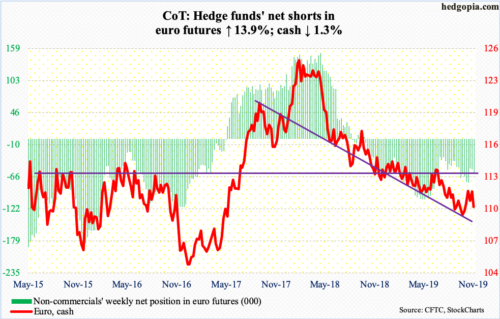
The European Commission, the European Union’s executive arm, lowered growth forecasts for the eurozone, with 2019 going from 1.2 percent to 1.1 percent and 2020 from 1.5 percent to 1.2 percent. The cash ($110.19) was already under pressure, and this news did not help.
Last Friday’s intraday high of $111.82 just about tested the 200-day ($111.95). That high also got rejected at a falling trend line from last September. Prior to this, the euro bottomed at $108.85 on October 1, meaning it rallied three points in a month, which is being unwound currently. The 50-day ($111.40) is lost as well, albeit not by much.
Gold: Currently net long 279.8k, up 3.3k.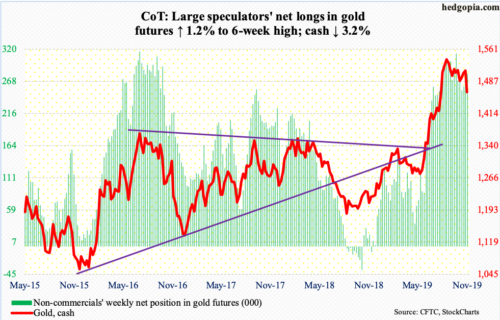
Last week, gold bugs probably felt excitement as the cash ($1,462.90/ounce) broke out of a falling trend line from September 4 when it peaked at $1,566.20. In the week to Wednesday, GLD (SPDR Gold ETF) did attract $14 million and IAU (iShares Gold Trust) $78 million (courtesy of ETF.com).
But that proved fleeting. The metal soon struggled at the 50-day ($1,505.15), which is now dropping. Tuesday, gold not only fell back under that trend line, but also sliced through a slightly-rising trend line from early October. Odds of breakout retest at $1,440s-50s have grown. The breakout occurred early August.
Nasdaq 100 index (mini): Currently net long 41.2k, up 739.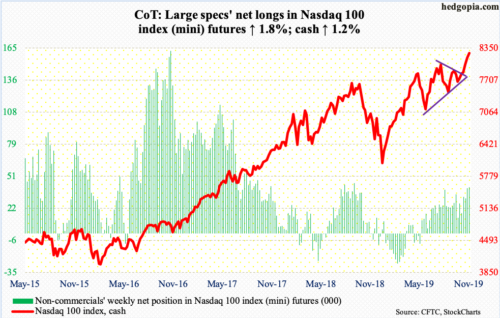
Tech bulls further built on last week’s breakout, but they would have probably liked to see this occur in a more decisive manner. In the first four sessions, there were some subtle signs of distribution. With all that said, price is what matters. The cash (8255.89) has now rallied for six straight weeks.
In the week to Wednesday, QQQ (Invesco QQQ Trust) drew $970 million (courtesy of ETF.com).
The daily remains overbought, although it has been that way for a while now. Now, the weekly is extended. Momentum still remains with the longs, with shorter-term moving averages still rising. Should unwinding of overbought conditions begin, breakout retest takes place just north of 8000.
Russell 2000 mini-index: Currently net short 11.1k, down 4.6k.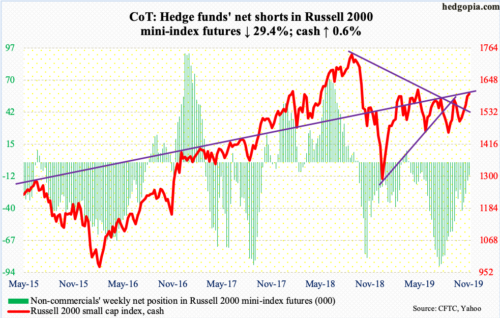
Last Friday, the cash (1598.86) broke through a falling trend line from August last year when it peaked at 1742.09 – potentially an important development. In the week to Wednesday (this week), IWM (iShares Russell 2000 ETF) and IJR (iShares Core S&P Small-Cap ETF) respectively gained $844 million and $10 million (courtesy of ETF.com).
The recapturing of that trend line opened the door to a test of 1600, which took place in no time. (On IWM, this resistance approximates $160.) Twice this week, the Russell 2000 rallied past 1600 – 1608.80 on Tuesday and 1607.41 on Thursday. This was intraday, not close. In other words, close but no cigar. In the end, the resistance, which goes back to January last year, prevailed. Particularly since February this year, bulls have been repeatedly rejected at this ceiling. It is unlikely it gives way this easy, particularly not when conditions are as overbought as they are now – daily for a while now and weekly quickly getting there. Selling likely accelerates once bulls lose trend-line support from early last month, which takes place around 1590.
US Dollar Index: Currently net long 28.4k, down 1.1k.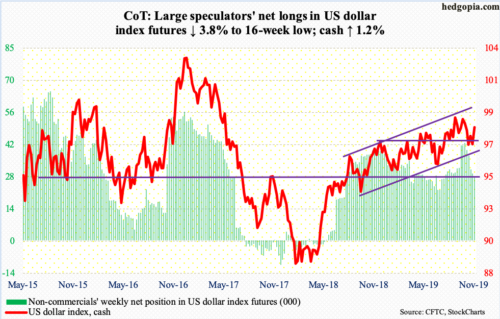
Last week, the cash (98.20) briefly breached the 200-day, but only to see bulls defend trend-line support from September last year. This week, it rallied 1.2 percent – past the 50-day (98.06). The ball is firmly in bulls’ court. Early September, and then early October, the US dollar index peaked at 99.30s. The upper end of the 15-month ascending channel it is in gets tested around 100.
VIX: Currently net short 203.6k, up 15.7k.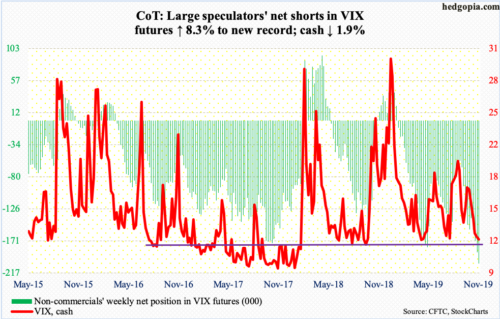
The 10-day, which has provided resistance for nearly three weeks now, continues to fall, although the trajectory is not as steep. In the right circumstances, it could be ready to at least go flat – and curl up eventually.
For that to happen, volatility bulls cannot lose 12. The cash closed out the week at 12.07 – the lowest since April this year. There is support at 10-11. VIX has not broken 10 since January last year.
Amidst all this, non-commercials took their net shorts to yet another uncharted territory. Watch out once they begin to cover – or are forced to cover – but for now it is volatility bears’ ball to lose.
In the meantime, in eight of the last 11 sessions the CBOE equity-only put-to-call ratio registered readings of 0.50s. Investor optimism is building. Fear is giving way to greed. The 21-day moving average of the ratio ended the week at 0.618, down from 0.699 on October 18. Historically, it tends to bottom at high 0.50s to low 0.60s. Once unwinding begins and the ratio rises, stocks come under pressure.
Thanks for reading!
