
Following futures positions of non-commercials are as of Aug 29, 2017.
10-year note: Currently net long 283.7k, up 22.5k.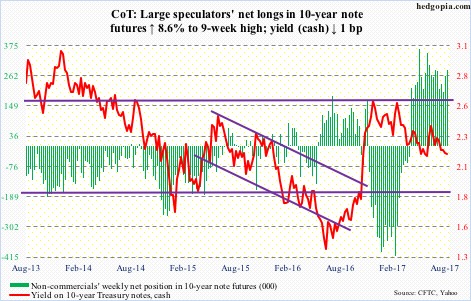
Hurricane Harvey may have given the Fed an excuse not to hike come December. At least that is how markets are beginning to position. In the futures market, the odds of a 25-basis-point hike on the 13th that month has gone down to just a tad below 40 percent.
But the Fed could also view things this way.
Real GDP growth in 2Q17 was revised higher to three percent this week. As of Friday, the Atlanta Fed’s GDPNow forecast expects 3.2 percent growth in 3Q17; this likely gets revised lower in the weeks to come. But at the same time, growth will get a boost when reconstruction begins. Auto sales, for instance, are bound to suffer initially, but the flood-damaged vehicles in due course will be replaced.
So the Fed equally has an excuse not to use the excuse not to hike.
After all, post-Great Recession, real GDP has grown at an average 2.2 percent – much weaker than 3.2 percent going back to 2Q47 – but probably not weak enough to deserve fed funds between 100 and 125 basis points.
30-year bond: Currently net long 56.5k, down 20.2k.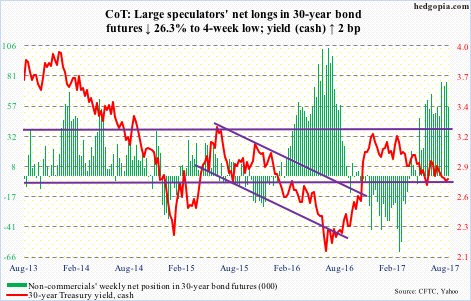
Major economic releases next week are as follows.
Markets are closed Monday for Labor Day.
July’s revised durable goods data are scheduled for Tuesday. Preliminarily, orders for non-defense capital goods ex-aircraft – proxy for business capital expenditures – rose 3.5 percent year-over-year. This was six straight months of growth, although it has decelerated from 6.1 percent in May.
Wednesday brings the non-manufacturing ISM index for August. July was down 3.5 points month-over-month to 53.9. February’s 57.6 was the highest since 58.1 in October 2015. Similarly, orders fell 5.4 points m/m to 55.1; April’s 63.2 was the highest since 65.3 in August 2005.
Revised 2Q17 productivity numbers come out on Thursday. Non-farm output per hour increased at a subdued 1.19 percent y/y – the highest growth rate in three quarters. This followed three quarters of negative growth.
Consumer credit for July is due out on Friday. June was up 5.7 percent y/y to a seasonally adjusted annual rate of $3.86 trillion. When Great Recession ended in June 2009, this stood at $2.59 trillion – up 49 percent since.
Crude oil: Currently net long 338.1k, down 93.6k.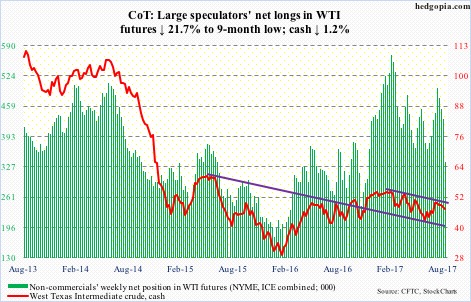
As Harvey wreaked havoc in Texas, rather than rallying spot West Texas Intermediate crude ($47.29/barrel) fell. The closure of so many U.S. refineries dampened demand for crude, even as gasoline prices shot up.
WTI buyers showed up Thursday near the daily lower Bollinger band. A rising trend line from February last year – around $44 – was not tested. If the crude manages to rally, it is possible the right side of an inverse head-and-shoulders is formed. The neckline gets broken just under $50, which is where a falling trend line from February this year lies.
The EIA report for the week ended August 25 showed crude stocks continued to drop, down 5.4 million barrels to 457.8 million barrels. Stocks peaked at 535.5 million barrels in the March 31st week this year. Thanks to Harvey, this metric will have looked a whole lot different when this week’s numbers are reported.
Ditto with stocks of gasoline and distillates, which respectively rose by 35,000 barrels and 748,000 barrels to 229.9 million barrels and 149.2 million barrels.
Crude production inched up 2,000 barrels per day to 9.53 million b/d. Since OPEC reached an agreement to cut back production by 1.8 mb/d last November, U.S. production has gone up by 831,000 b/d. Production is bound to take a hit – just a matter of by how much.
Crude imports fell 885,000 b/d to 7.91 mb/d.
Refinery utilization rose 1.2 percentage points to 96.6 percent – the highest since August 2005. It is redundant to state that utilization will have dropped this week, with shutdowns likely for several more weeks.
E-mini S&P 500: Currently net long 199.7k, up 57.6k.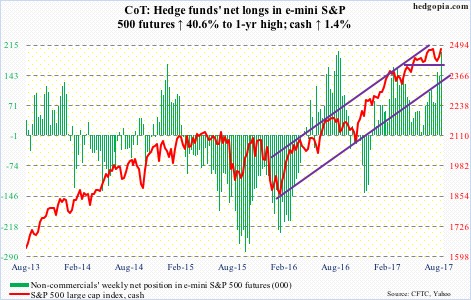
The bears did have an opportunity to push the cash (2476.55) lower, but that did not last very long. Tuesday, the S&P 500 fell to 2428.2 before reversing hard; recent lows were not even tested. In the subsequent sessions, the bulls took out both the 50-day moving average and a short-term trend line from August 8 when the index peaked at 2490.87.
With the daily chart beginning to look extended, momentum has swung back into the bullish camp, as long as support at 2450-ish holds.
In the week through Wednesday, flows fully sided with the bulls. U.S.-based equity funds took in $6.1 billion. This followed outflows of $16.2 billion in the prior six (courtesy of Lipper).
During the same week, SPY (SPDR S&P 500 ETF), VOO (Vanguard S&P 500 ETF) and IVV (iShares core S&P 500 ETF) together attracted $4.4 billion – respectively $3.8 billion, $19 million and $629 million (courtesy of ETF.com). In the prior week, $2 billion came in.
Euro: Currently net long 86.5k, down 1.5k.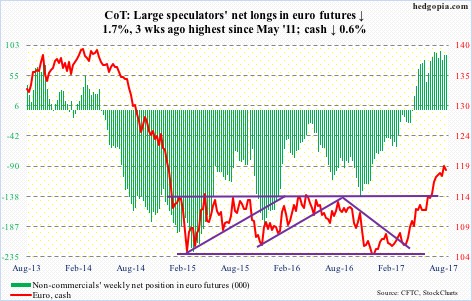
Euro bulls and bears are fighting tooth and nail over control of shorter-term averages. Tuesday’s reversal candle may have shifted the odds in favor of the latter.
From early this year through this week’s high, the cash (118.6) rallied nearly 17 percent – enough of an incentive to lock in profits. Those that are waiting for a technical signal may have gotten one this week.
Fundamentally, too, the ECB may have given traders a reason to lighten up – at least near term. The bank may not have final QE plan ready until December.
Nearest support lies at 116.5 (50-day) and 114.50 (retest of July breakout).
Non-commercials’ net longs are near six-year highs. This is a potential source of downward pressure in the cash when these traders decide/are forced to unwind.
Gold: Currently net long 231k, up 22.6k.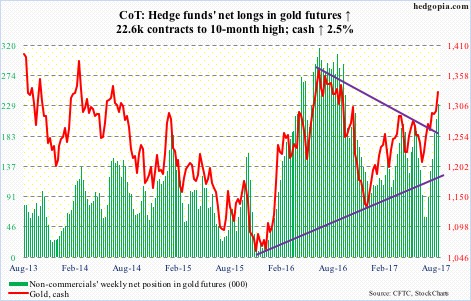
The cash ($1,330.4/ounce) this week broke out of two important resistance – $1,300 horizontal line, which goes back to September 2010, and a trend line from September 2011, when gold peaked at $1,923.70.
Non-commercials used the breakout as an opportunity to add to net longs.
Flows improved the past three weeks.
In the week to Wednesday, GLD (SPDR gold ETF) attracted $709 million, and $1.2 billion in the past three. During the same period, IAU (iShares gold trust) took in $59 million and $225 million, in that order (courtesy of ETF.com).
The daily chart is extended, but at least near term it is likely gold bugs show up near both 10- and 20-day – both rising. Their best-case scenario is, when $1,300 is tested, new buyers show up.
Nasdaq 100 index (mini): Currently net long 42.2k, up 3.1k.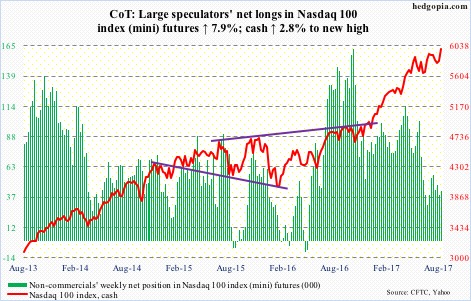
After Monday’s doji right on the 50-day, the cash came back to life the rest of the week, with a new intra-day high (6009.61) on Friday.
In the week to Wednesday, $307 million moved into QQQ (PowerShares QQQ trust). This followed outflows of $910 million in the prior week (courtesy of ETF.com). So flows probably were not that big a factor. But short squeeze likely was.
By the middle of August, short interest on QQQ rose 12.2 percent period-over-period to 67 million – the highest since end-February 2016. Short interest also remains elevated on XLK (SPDR technology ETF).
Russell 2000 mini-index: Currently net short 87.6k, up 5.9k.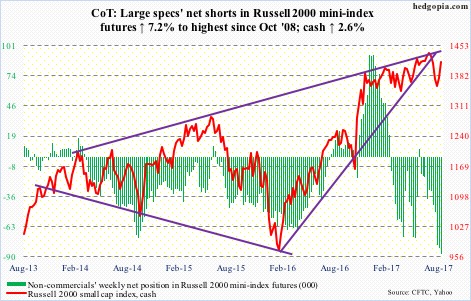
The cash (1413.57) reclaimed both the 200- and 50-day this week. The Russell 2000 has now moved back into a months-long rising channel, the upper end of which lies around 1465.
Near term, non-commercials can potentially decide which way it goes. They are most net short since October 2008. If flows into IWM (iShares Russell 2000 ETF) continue to improve, a squeeze can result.
In the week to Wednesday, the ETF attracted $639 million, following $780 million in the prior week (courtesy of ETF.com).
US Dollar Index: Currently net short 3.1k, up 1.6k.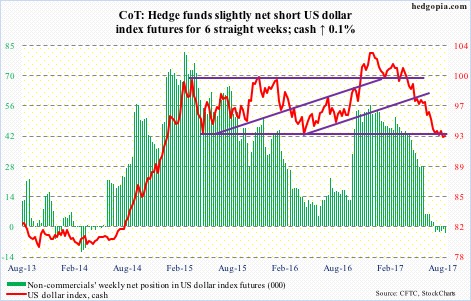
Tuesday’s candle has the look of a dragonfly doji. This showed up after the cash (92.77) fell 13.4 percent from early this year to this week’s low of 91.55. Support at 92, which goes back to at least 1998, has held.
The odds of a tradable rally have grown, with the caveat that non-commercials continue to show disinterest in building net longs.
VIX: Currently net short 117.4k, up 12.1k.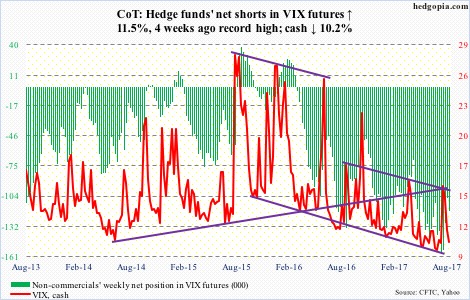
The cash (10.13) ended up losing both 200- and 50-day, in that order. August was the sixth consecutive month of long-tail candles. VIX-slamming continues, as does buy-the-dip in stocks.
In recent sessions, bullish options bets in stocks have increased substantially. In the last 10 sessions, the CBOE equity put-to-call ratio was in the .50s in seven, with the 10-day average of .59. This is complacent enough for contrarians to be on the lookout for at least a breather.
Thanks for reading!
