
The past couple of weeks offered both equity bulls and bears a little something to celebrate. The bulls got the relief rally, and the bears an opportunity to short. What next?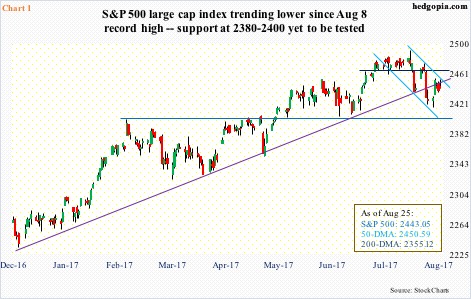
Since the S&P 500 large cap index peaked on August 8 at 2490.87, it has made two lower highs (Chart 1). The trendline resistance gets broken around 2455, which was tested last Friday – unsuccessfully.
Since that peak, the index also made two lower lows. For the bulls, the first one produced a 1.5-percent rally, and the second 1.6 percent. For the bears, shorting at the high on August 16 and through the low on August 21 would result in a 2.3-percent gain. It remains to be seen if the Friday failure at that trendline would represent an opportunity to short.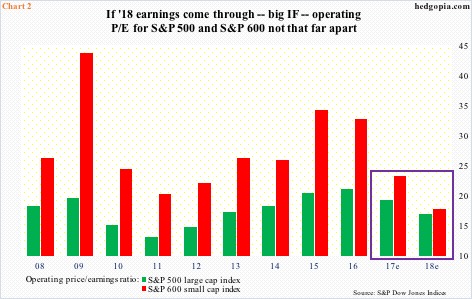
Year-to-date, the S&P 500 is up 9.1 percent, softer than the Nasdaq 100’s 19.7-percent gain but much stronger than the puny 1.5-percent rise in the Russell 2000 small cap index.
The divergence between large-caps and small-caps is striking. Particularly so as investors/traders in general tend to gravitate toward the latter in a risk-on environment. And particularly so as on next year’s earnings, operating P/E between the two are beginning to converge (Chart 2). Small-caps in general tend to command higher multiples.
In 2018, S&P 500 companies are expected to bring in $144.60 in operating earnings and S&P 600 companies $46.49, hence P/E of 16.9 and 17.8, respectively.
If tax cuts indeed come through, small-caps inherently are likely to get a bigger bang for the buck, as they are more domestically focused versus large-caps’ sizable overseas exposure.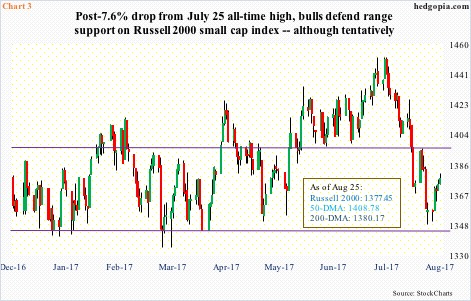
Despite this, small-caps cannot rally. Either markets do not trust next year’s earnings estimates or do not anticipate any tax cuts. Worse, small-caps are simply a canary in the coal mine, which in due course will end up pulling large-caps down.
Technically, small-caps act much weaker versus their larger-cap brethren.
Post-election last November, the Russell 2000 surged. Shortly thereafter, it began to go sideways between 1390s and 1340s. In May, it broke out, but falsely it turns out.
The index peaked on July 25 – much earlier than the S&P 500 – at 1452.09, before the bottom fell out. In the selloff that followed, it lost both 50- and 200-day moving averages, as well as a trend line from February last year. From the bulls’ perspective, the good thing is that support at the bottom end of the afore-mentioned range held (Chart 3). At the same time, last Friday it tested but was unable to take out the 200-day.
Once again, as is the case with the S&P 500, the Russell 2000 has offered opportunities for both bulls and bears – the nimble ones.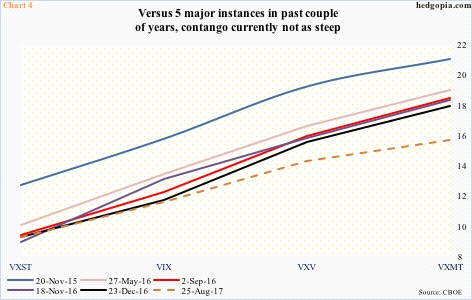
In the very near-term, things could go either way, with a down bias.
In one scenario, the S&P 500 ends up breaking out of the afore-mentioned trendline, which would also mean it recaptures the 50-day – now flattish.
In this scenario, the volatility curve – VXST (nine days), VIX (30 days), VXV (90 days) and VXMT (six months) – steepens further, as premium continues to come out of the short-end.
Chart 4 plots five prior instances in which the curve was in contango and the VXST-VXMT spread was minus eight points or higher. The sixth one (dashed line) is as of last Friday with a spread of minus 6.45 points.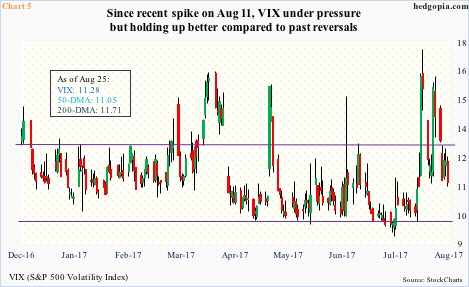
In scenario two, the Russell 2000 turns back down right here, and once again tests the range support.
Ditto with the S&P 500. Last Monday, it fell to 2417.35 intraday before attracting bids. Support at 2380-2400 – a must-hold – is yet to be tested. It will be an important test should it happen.
In this scenario, VIX refuses to go lower, and rallies right here.
Unlike several times in the past when VIX would spike but only to quickly recede back into 9s and 10s, this time around it is yet to drop below 11 (Chart 5). Friday, it lost the 200-day but is still above the 50-day. It is holding up better.
As well, the contango in Chart 4 is not very steep, but there have been several instances in the past couple of years when the curve began to shrink from minus six or seven points, not necessarily eight or nine.
In the very near term, equity bulls’ inability last week to take out resistance raises the odds that recent lows get tested.
Thanks for reading!
