
Following futures positions of non-commercials are as of Sep 5, 2017.
10-year note: Currently net long 221.8k, down 61.9k.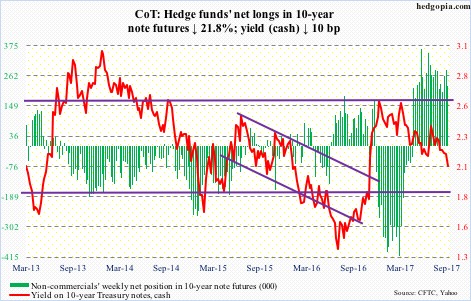
Last week, 2Q17 real GDP growth was revised higher to three percent – much better than the post-Great Recession average of 2.2 percent. The Atlanta Fed’s GDPNow model forecasts three percent growth in 3Q17.
Also Friday last week, ISM manufacturing rose 2.5 points month-over-month in August to 58.8 – a 76-month high; this week, ISM non-manufacturing rose 1.4 points m/m to 55.3. These are all strong data points.
On the weaker side was last Friday’s non-farm payroll, among others. Job creation slowed to 156,000 in August, averaging 176,000 in the first eight months this year – softer than the 2016 average of 187,000.
It so happens that markets are assigning more weight to the weak data. The yield curve (10s/2s) has narrowed to 79 basis points. In the futures market, the odds of a 25-basis-point hike in the the fed funds rate in December has tumbled to 27 percent.
The bond market is rapidly pricing out post-election optimism. On November 8 last year, 10-year T-yields closed at 1.86 percent, then gapping up twice in the next three sessions to 2.22 percent. This week, they closed at 2.06 percent.
Non-commercials – rightly – switched to net long 10-year note futures late April this year, and have maintained the bullish bias, although they cut back this week.
30-year bond: Currently net long 52.3k, down 4.2k.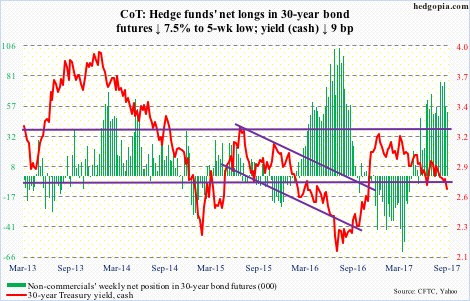
Major economic releases next week are as follows.
The NFIB small business optimism index (August) and JOLTS (July) are due out Tuesday.
The optimism index rose 1.6 points m/m in July to 105.2 – a stone’s throw away from 105.9 in January this year which was a 12-year high. July job openings were the highest since November 2000.
Non-farm job openings (JOLTS) jumped 461,000 m/m in June to 6.16 million.
August’s PPI-FD is reported Wednesday. Producer prices slipped 0.1 percent m/m in July, and were up 1.9 percent in the 12 months through July. Core PPI was unchanged m/m in July and increased 1.9 percent in the 12 months to July.
The consumer price index for August will be published Thursday. Both the headline CPI and core CPI in July inched up 0.1 percent m/m. In the 12 months to July, they respectively rose 1.7 percent and 1.69 percent. This was the fourth consecutive month of core CPI growing less than two percent year-over-year.
Friday brings retail sales (August), industrial production (August), and the University of Michigan’s consumer sentiment index (September, preliminary).
Retail sales in July rose 4.2 percent y/y to a seasonally adjusted annual rate of $478.9 billion. Sales have decelerated slightly since increasing 5.6 percent in January this year.
In August, capacity utilization rose 1.1 percent y/y to 76.7 percent. Utilization reached a cycle high 79.2 percent in November 2014.
Consumer sentiment rose 3.4 points m/m in August to 96.8. After having jumped post-election last year, sentiment peaked at 98.5 in January this year – a 13-year high.
Crude oil: Currently net long 362.9k, up 24.8k.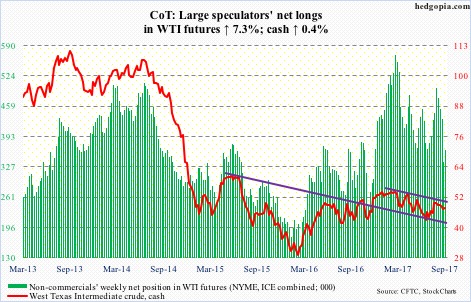
Spot West Texas Intermediate crude ($47.48/barrel) had a first up week in the last six – albeit a meek one.
Friday, the crude literally closed on the 50-day. This was preceded by an unsuccessful test early this week of the 200-day. The week’s high of $49.42 also tested a declining trend line from February this year. This also makes up the neckline of a potential inverse head-and-shoulders. A breakout would be important – should one occur.
That said, the daily chart is itching to go lower.
The EIA report for the week ended September 1, as expected, showed that crude production collapsed, down 749,000 barrels per day to 8.78 million b/d. The prior week’s 9.53 mb/d was the highest since mid-July 2015.
As did refinery utilization, which declined 16.9 percentage points to 79.7 percent. The prior week’s 96.6 percent was the highest since August 2005.
Crude imports fell, too – by 822,000 b/d to 7.08 mb/d.
Concurrently, stocks of both gasoline and distillates dropped – by 3.2 million barrels and 1.4 million barrels to 226.7 million barrels and 147.8 million barrels, respectively.
Crude stocks, however, rose by 4.6 million barrels to 462.4 million barrels.
E-mini S&P 500: Currently net long 157.9k, down 41.8k.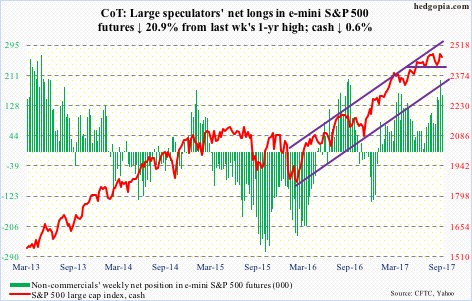
Bulls struggled to build on last week’s momentum. Flows refused to fully cooperate with them.
In the week through Wednesday, $1.1 billion came out of U.S.-based equity funds (courtesy of Lipper).
During the same week, SPY (SPDR S&P 500 ETF) lost $3.3 billion. This was offset by combined inflows of $2.3 billion into VOO (Vanguard S&P 500 ETF) and IVV (iShares core S&P 500 ETF) – $130 million and $2.2 billion, respectively (courtesy of ETF.com).
The S&P 500 (cash) is still above the 50-day, but merely 6.5 points away.
Euro: Currently net long 96.3k, up 9.8k.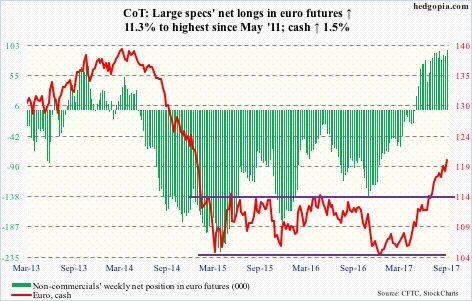
The ECB raised its 2017 Eurozone growth forecast to 2.2 percent. This will be the fastest pace since 2007. Mario Draghi, the bank’s president, also said “downside risks continue to exist.”
As if this was not confusing enough, he also said appreciation of the euro is a risk that warrants close attention. But his rhetoric was not aggressive enough. Currency traders who probably expected stronger verbal intervention pushed the euro higher.
The currency had a major breakout in July this year – out of 114.50. Using a measured-move approach, in due course it can rally up to 124-125. If ECB policy lets it, that is.
Gold: Currently net long 245.3k, up 14.3k.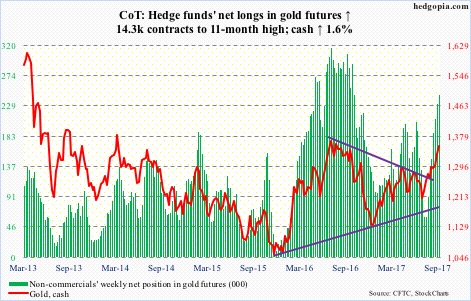
The cash ($1,351.2/ounce) continued to build on last week’s action – when it broke out of $1,300 horizontal line, which goes back to September 2010, and a trend line from September 2011, when gold peaked at $1,923.7.
Flows poured in. In the week ended Wednesday, GLD (SPDR gold ETF) took in another $873 million, and IAU (iShares gold trust) $68 million (courtesy of ETF.com).
With this, gold now sits at a crucial juncture. There is a potential multi-year inverse head-and-shoulders in the making. A convincing breakout would be massive.
Momentum is intact, but at the same time the daily chart is extended. The advantage gold bugs have is this. Even if the metal comes under pressure and $1,300 holds, they keep the ball.
Nasdaq 100 index (mini): Currently net long 44.1k, up 2k.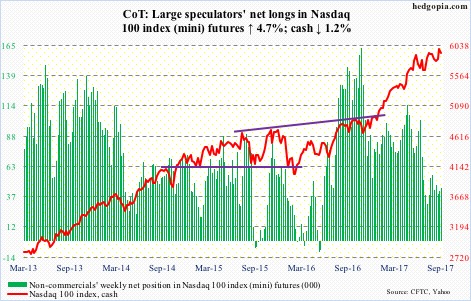
In the week to Wednesday, $676 million moved into QQQ (PowerShares QQQ trust). This followed inflows of $307 million in the prior week (courtesy of ETF.com).
However, since the cash reversed Friday last week after scoring a new intra-day high of 6009.61, the bulls are struggling to maintain momentum.
This week, buyers stepped up to defend the 10-day, but in an unconvincing manner, with Wednesday a long-legged doji and Thursday a spinning top.
Russell 2000 mini-index: Currently net short 82.4k, down 5.2k.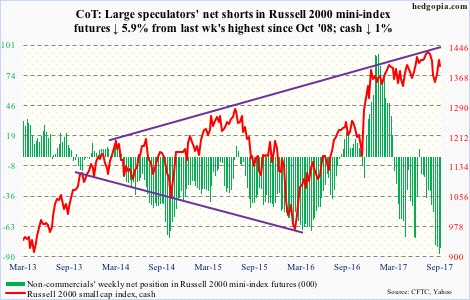
The cash (1399.43) opened the week with a loss of the 50-day.
From the bulls’ perspective, the good thing is that support at 1390s was defended three times during the week. Prior to recent breakout, the Russell 2000 was caught between 1340s and 1390s for months. A loss of this support opens the door to a test of the 200-day (1385) and/or 1340s. The latter was successfully tested mid-August.
Flows have been positive of late. In the week to Wednesday, IWM (iShares Russell 2000 ETF) attracted $414 million – and $1.8 billion in the past three. These longs’ resolve/patience will be tested if the Russell 2000 loses the 200-day.
US Dollar Index: Currently net short 3.9k, up 890.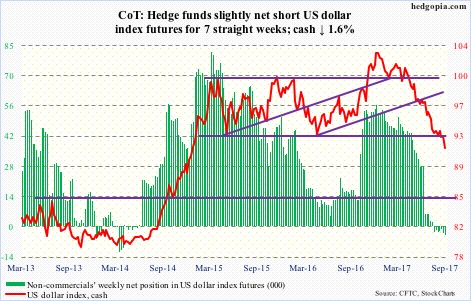
Since it peaked early this year, the cash has pretty much established a pattern – go sideways in what initially looks like a bottoming pattern, only to face a new round of selling.
This week, two-year Treasury yields – most susceptible to the Fed’s monetary policy – shed eight basis points to 1.27 percent, and financials took it on the chin.
Dollar bulls now have a new hurdle – 92.60-ish on the cash (91.33).
Non-commercials are still not interested in building net longs.
VIX: Currently net short 121.3k, up 4k.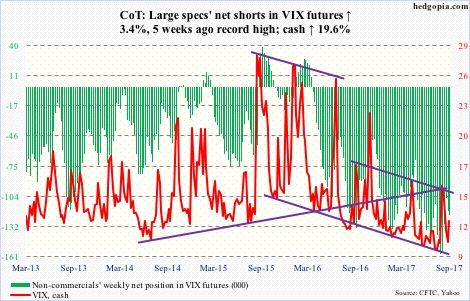
Tuesday’s intraday spike to 14.06 on the cash (12.12) was once again smacked hard, followed by a test of the 200-day (11.61) in the next couple of sessions.
That said, last Friday’s low of 10.02 did not even come close to getting breached this week. Ditto with the 50-day (11.22). The two averages are on the verge of converging.
Even though major equity indices had a down week, the CBOE equity put-to-call ratio had two more sessions in the .50s – which was the case in nine of the last 14 sessions. Complacency remains elevated near term.
Thanks for reading!
