Following futures positions of non-commercials are as of Sep 19, 2017.
10-year note: Currently net long 270.1k, up 18.4k.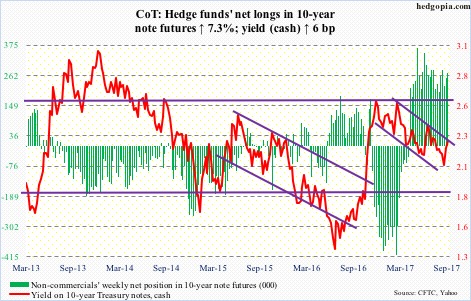
Americans’ love for leverage needs no elaboration. The debt culture began in earnest in the early ’80s. Leverage remains high – be it at the government level, corporate or individual.
The federal debt stands at $20.2 trillion, with the debt-to-GDP ratio north of one for 19 straight quarters.
In 2Q17, federal interest payments were $482.3 billion (seasonally adjusted annual rate). This made up 2.43 percent of the debt load. Simplistically, if effective rates were 100 basis points higher, interest payments would be $200 billion larger. This is no chump change. Including corporate and individual, this can act as automatic brakes on the economy.
This effectively means the fed funds rate, which is the Fed’s traditional tool for dialing up or down stimulus, probably lacks room to meaningfully rise – rise enough for the Fed to fall back on when the next downturn hits. By corollary, this means when bad times hit, it likely resorts – again – to unconventional methods such as QE.
Thanks to three iterations of QE, the Fed sits at a massive $4.5-trillion balance sheet. This week, it said it will begin to roll off its portfolio of mortgage-backed securities and Treasury bonds/notes in October – by $10 billion/month, rising every three months until monthly reductions reach $50 billion.
Be that as it may, it is unlikely we have seen the last of QE.
30-year bond: Currently net long 58.1k, up 7.6k.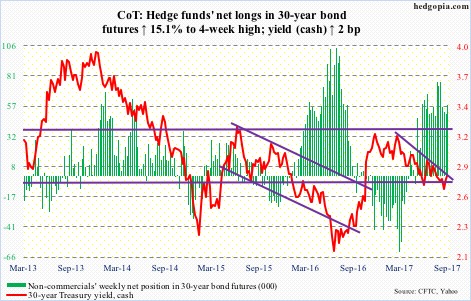
Major economic releases next week are as follows.
The S&P Corelogic Case-Shiller home price index (July) and new home sales (August) will be reported Tuesday.
Nationally, home prices in June rose 5.8 percent year-over-year, and have gradually trended higher in the past year – from 4.9 percent in June last year.
New home sales fell 9.4 percent m/m in July to 571,000 units (SAAR). The cycle peaked in March this year at 638,000, which was the highest since November 2007.
Durable goods orders (Aug) and pending home sales (Aug) are due out Wednesday.
Orders for non-defense capital goods ex-aircraft – proxy for business capital expenditures – were up 3.9 percent y/y in July to $64.1 billion. Orders peaked at $70.3 billion in September 2014.
Pending home sales fell 0.9 percent m/m in July to 109.1. A decade-high 113.6 was reached in April last year.
GDP (2Q17, final) and corporate profits (2Q17, revised) are scheduled for Thursday.
The second estimate showed the economy grew three percent (SAAR) in 2Q17 – the highest growth rate in nine quarters.
Preliminarily, 2Q17 corporate profits adjusted for inventory valuation and capital consumption rose 1.3 percent quarter-over-quarter to $2.14 trillion (SAAR). Profits peaked at $2.23 trillion in 4Q14.
Friday brings personal income and spending (Aug) and the University of Michigan’s consumer sentiment (September, final).
Core PCE – the Fed’s favorite measure of consumer inflation – rose 1.41 percent in the 12 months to July. The last time inflation rose north of two percent y/y was in April 2012.
September’s preliminary estimate showed consumer sentiment slid 1.5 points m/m to 95.3. Post-election, January’s 98.5 was a 13-year high.
Crude oil: Currently net long 401.7k, up 44.6k.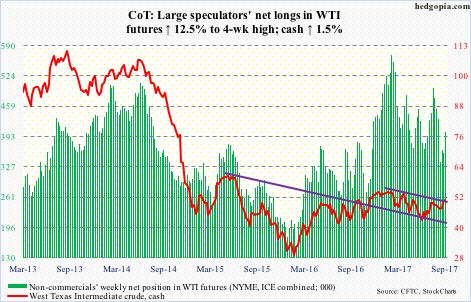
Spot West Texas Intermediate crude ($50.66/barrel) managed to peek out of trend-line resistance from February this year, but rather unconvincingly. In all probability, the 200-day moving average ($49.63), which the crude has remained north of for the past seven sessions, gets tested soon. The daily chart is extended. The rising 50-day lies at $48.32.
In the week to September 15, as per the EIA, U.S. refined products continued to drop, with gasoline stocks declining 2.1 million barrels to 216.2 million barrels, and distillates 5.7 million barrels to 138.9 million barrels.
After dropping 18.9 percentage points in the past couple of weeks, refinery utilization rose 5.5 points to 83.2 percent.
Crude imports rose 888,000 barrels/day to 7.37 million b/d.
Crude production rose 157,000 b/d to 9.51 mb/d. Pre-Harvey, production was 9.53 mb/d.
Crude stocks rose 4.6 million barrels to 472.8 million barrels. They peaked at 535.5 million barrels in the week ended March 31, and have been rising since bottoming at 457.8 million barrels three weeks ago.
E-mini S&P 500: Currently net long 101.3k, down 86.7k.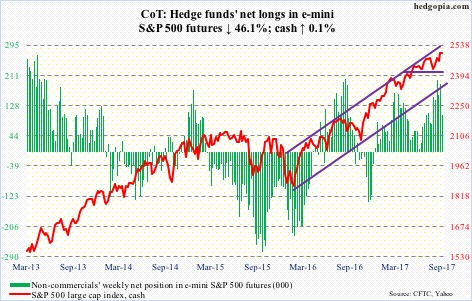
Combined, SPY (SPDR S&P 500 ETF), VOO (Vanguard S&P 500 ETF) and IVV (iShares core S&P 500 ETF) in the week to Wednesday lost $2.1 billion – outflows of $3 billion and inflows of $761 million and $214 million, respectively (courtesy of ETF.com). In the same week, U.S.-based equity funds took in $803 million (courtesy of Lipper).
Also Wednesday, the S&P 500 (cash) rose to yet another intraday high of 2508.85, but not before giving off signs of fatigue. The week produced a doji, and Wednesday a hanging man.
Nearest support lies at 2480. If the bears seriously wrest control of near-term momentum – not outside the realm of possibility – the bulls’ real test lies at 2400.
Euro: Currently net long 62.8k, down 23.3k.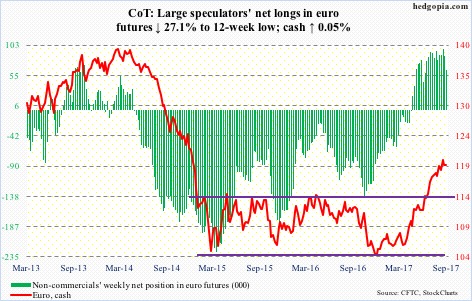
The cash ($119.51) continues to act like it is in the process of topping out. After August’s monthly spinning top, September-to-date has produced a doji. Add to that a weekly long-legged doji this week.
In the meantime, 10- and 20-day moving averages are on the verge of crossing down, even as daily Bollinger bands have tightened.
Nearest support lies at 118.40-ish. Right underneath is the 50-day (118.12).
Gold: Currently net long 236.1k, down 18.7k.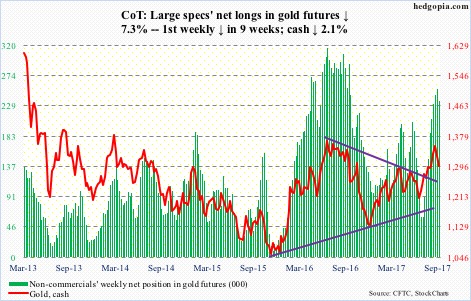
After positive July and August, September-to-date has produced a reversal candle with a long wick. Thus far, this has been an unsuccessful test of multi-year resistance.
All is not lost for the bulls. Late August, the cash ($1,297.5/ounce) broke out of $1,300, which is being tested. As is the 50-day ($1,291.47). From gold bugs’ perspective, it is a must-save. And they are doing what they can.
In the week to Wednesday, as per ETF.com, another $314 million moved into GLD (SPDR gold ETF) and $47 million into IAU (iShares gold trust) – inflows of $2.5 billion and $443 million in the past six, respectively (courtesy of ETF.com).
Risk lies elsewhere. Non-commercials, who rode the recent upturn in the cash perfectly, cut net longs for the first time in nine weeks. Holdings remain elevated.
Nasdaq 100 index (mini): Currently net long 38.5k, down 9.1k.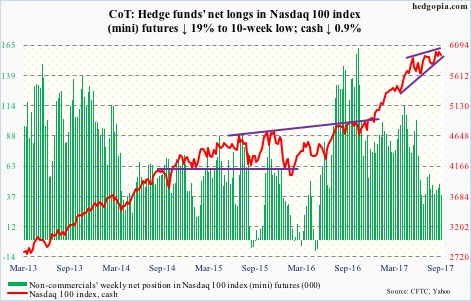
The cash (5932.32) has been trapped in a rising wedge for nearly five months now. The upper end was tested Monday when the index rose to a new all-time high of 6012.95. The 6000 level has also resisted rally attempts for a couple of months now.
The wedge will be broken to the downside around 5860. The bulls do not want to see that happen, yet that may very well be the outcome in the days/weeks to come. For now, the bulls defended the 50-day Friday.
In the week to Wednesday, QQQ (PowerShares QQQ trust) did attract $741 million, but inflows have been sporadic.
Russell 2000 mini-index: Currently net short 3.7k, down 98.7k.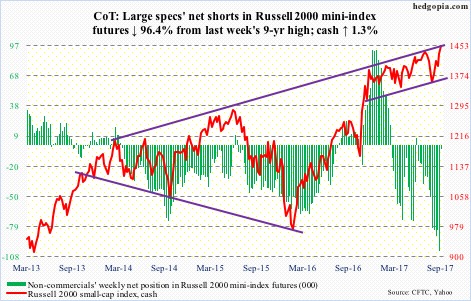
Friday, the cash came within less than a point of the all-time high of 1452.09 on July 25, but did score a record close.
Non-commercials likely contributed to this, having cut back net shorts by 98,671 contracts. It is possible this is not a clean number, as the CME’s e-mini Russell 2000 index – recently introduced – saw non-commercials switch from 38,318 net longs to 38,771 net shorts. Open interest in the latter has really gone up the past couple of weeks. Next week likely presents a clearer picture.
In the week ended Wednesday, IWM (iShares Russell 2000 ETF) attracted $1.9 billion (courtesy of ETF.com).
US Dollar Index: Currently net short 6.2k, up 4k.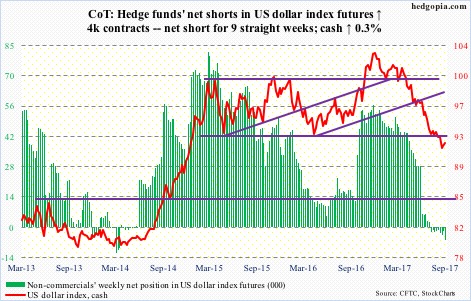
Intraday between September 7 and 22, two-year yields – most susceptible to the Fed’s monetary policy – went from 1.27 percent to 1.46 percent, and 10-year yields between September 7 and 20 from 2.05 percent to 2.28 percent. Between the periods, the US dollar index (cash) was essentially flat to ever so slightly up.
The index either does not trust the recent backup in yields or is in the process of hammering out a decent bottom.
From early this year through recent lows, the dollar index shed 12-plus percent. Several rally attempts in the last couple of weeks have been repelled at broken support-turned-resistance at 92.50-60. This needs to be taken out if momentum were to shift to the bulls’ way.
VIX: Currently net short 171.2k, up 47.4k.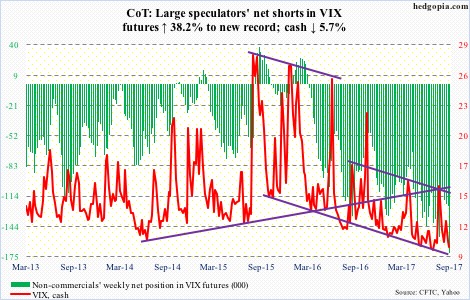
During all five sessions this week, the cash dipped below 10 intraday, with the last three also closing below. The declining 10-day persistently provided resistance.
Non-commercials – who accumulated the most net shorts ever – got the direction right.
In the meantime, the 21-day CBOE equity put-to-call ratio dropped to .605 Tuesday. Several times in the past, the ratio in high .50s-low .60s have been a signal to get cautious on equities – at least short-term.
Thanks for reading!

