
Following futures positions of non-commercials are as of Oct 3, 2017.
10-year note: Currently net long 232.2k, down 24.5k.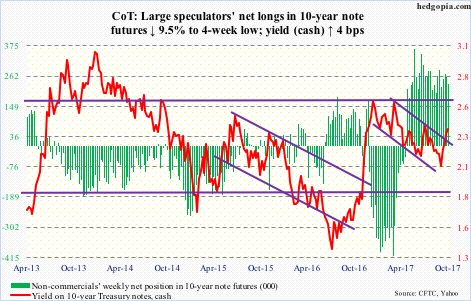
December looks like a lock. The odds in the futures market of a 25-basis-point hike in the 12-13th meeting that month have risen to 92 percent.
This would be a third hike this year and fifth overall since the Fed started raising the fed funds rate – currently 1.16 percent – in December 2015.
Even if it were to move in December, the monetary policy remains very accommodative.
In this context, the nomination of the next Fed chair by President Trump will send a loud and clear message as to how the monetary policy might evolve in the next few years.
If Janet Yellen, whose term as chair expires next February – or someone as dovish – gets the nod, it will be a signal that he would like accommodation to continue, even though he was critical of the Fed’s easy monetary policy in the past.
If instead he would like to deflate the prevailing inflation in assets – not the least of which is stocks – he probably picks someone hawkish. U.S. stocks – at multi-year highs and under persistent upward pressure – are not priced for this scenario.
30-year bond: Currently net long 14.8k, down 38.1k.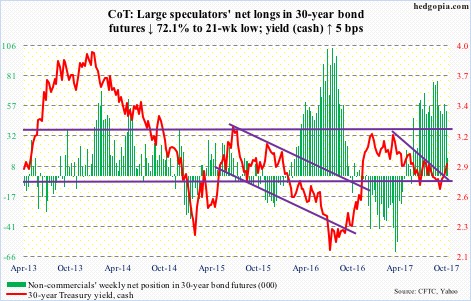
Major economic releases next week are as follows.
The NFIB small business optimism index for September comes out Tuesday. August inched up one-tenth of a point to 105.3 – not that far away from the post-recession peak of 105.9 in January, which was the highest since December 2004.
JOLTS (August) and FOMC minutes (September 19-20 meeting) are due out Wednesday.
Non-farm job openings in July rose 54,000 m/m to 6.17 million – a new high.
September’s producer prices are published Thursday. Both headline and core PPI-FD inched up 0.2 percent m/m in August. In the 12 months to August, they advanced 2.4 percent and 1.9 percent, respectively.
Friday brings CPI (September), retail sales (September), and the University of Michigan’s consumer sentiment index (October, preliminary).
Consumer prices in August rose 0.4 percent m/m and 1.9 percent in the 12 months to August. Core CPI increased 0.2 percent and 1.7 percent, respectively. This was the fifth straight year-over-year increase of sub-two percent.
August’s retail sales rose 3.2 percent y/y to a seasonally adjusted annual rate of $474.8 billion. Most recently, growth has been decelerating since January’s 5.6 percent.
Consumer sentiment in September fell 1.7 points m/m to 95.1. A 13-year high 98.5 was reached in January this year.
Crude oil: Currently net long 451.1k, down 10.2k.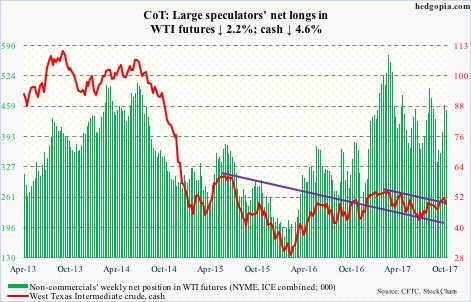
Spot West Texas Intermediate crude ($49.29/barrel) sits at a crucial juncture.
It came under pressure after getting rejected at the daily upper Bollinger band on Thursday last week. This Friday, the 200-day was lost, and the 50-day was tagged. The latter also represents a breakout retest of a trend line from February this year. Right around there lies a rising trend line from June this year – and a must-hold for the bulls.
Medium term, the weekly chart has tons of room to continue lower.
The EIA report for the week of September 29 – out Wednesday – showed crude stocks dropped six million barrels to 465 million barrels. As did distillate stocks – down 2.6 million barrels to 135.4 million barrels.
Crude imports fell, too – by 213,000 barrels/day to 7.21 million b/d.
Gasoline stocks, however, rose 1.6 million barrels to 218.9 million barrels.
Crude production continued to rise – up 14,000 b/d to 9.56 mb/d. This was a 26-month high.
Refinery utilization declined five-tenths of a point to 88.1 percent. Post-Harvey, it dropped to 77.7 percent three weeks ago.
E-mini S&P 500: Currently net long 101.5k, down 18.2k.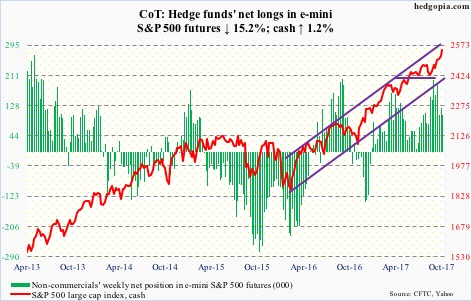
For six consecutive sessions through Thursday, the cash opened just about flat, and then progressively drew in buyers as the session progressed, closing at/near session high. Such has been the momentum. The latest rally began after the S&P 500 broke last Friday out of short-term resistance at 2509.
In the week to Wednesday, flows were not in cooperation. SPY (SPDR S&P 500 ETF) lost $1.9 billion. The loss was more than what VOO (Vanguard S&P 500 ETF) and IVV (iShares core S&P 500 ETF) took in – $427 million and $1 billion, respectively (courtesy of ETF.com).
In the same week, U.S.-based equity funds lost $1 billion (courtesy of Lipper).
This did not stop the bulls from rallying the cash another 1.2 percent this week.
The index is overbought on nearly all time frame, with the daily RSI (14-day) in particular closing the week at 76-plus. It read 78-plus on Thursday – the highest since February this year.
Euro: Currently net long 90.8k, up 2.7k.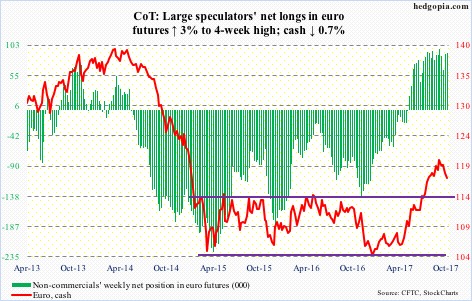
After losing near-term support at 118.40 – as well as the 50-day – nine sessions ago, the cash ($117.31) has remained under that support-turned-resistance.
On the weekly chart, the momentum is down. The bulls need to defend near-term support at 116.90, which they did Friday.
In the event of a rally, the 50-day (118.45) holds importance.
Gold: Currently net long 203.9k, down 8.7k.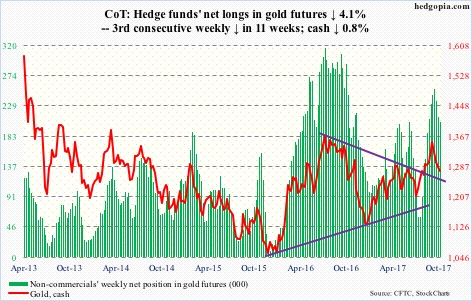
From gold bugs’ perspective, the week produced both good and bad news. Good because buyers showed up at the $1,270/ounce level on the cash ($1,274.9). Bad because this was not enough to arrest the downward momentum.
In the week through Wednesday, GLD (SPDR gold ETF) lost $425 million, even as IAU (iShares gold trust) took in $124 million (courtesy of ETF.com).
The weekly chart continues to unwind the overbought condition it is in.
In a worse-case scenario, the metal drops to test the 200-day ($1,250.91). This is about where a trend line from last December meets.
That said, the daily chart is itching to move higher.
Nasdaq 100 index (mini): Currently net long 29.2k, up 911.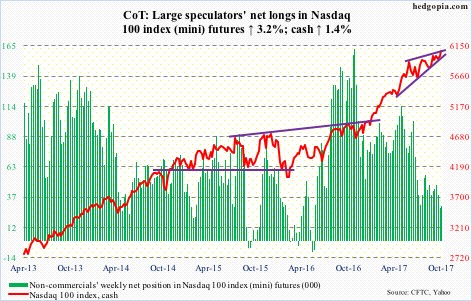
The cash (6064.57) broke out of two-month horizontal resistance at 6000 – finally – but still remains trapped within a rising four-month wedge.
The breakout took place Thursday, and at least through Wednesday, flows were not cooperating.
In the week to Wednesday, QQQ (PowerShares QQQ trust) lost $319 million. This followed outflows of $1.1 billion in the prior week (courtesy of ETF.com).
Russell 2000 mini-index: Currently net short 4.4k, down 21.8k.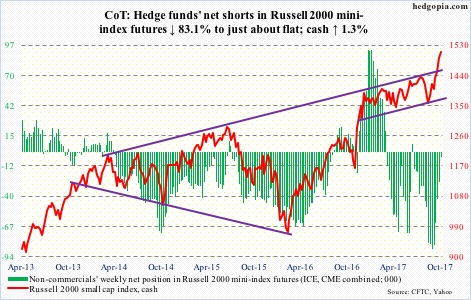
The cash (1510.22) continued to build on last week’s wedge breakout. As overbought as it is on the daily chart, it has pretty much traded along a sharply rising upper Bollinger band for 20 sessions.
Some signs of fatigue can be seen on IWM (iShares Russell 2000 ETF). After Monday’s 1.2-percent rally, Tuesday produced a hanging man, followed by a spinning top and a doji.
The ETF/Russell 2000 is up 12 percent since bottoming August 18, and has rallied in six of the last seven weeks.
Non-commercials probably lent a big helping hand in this. Net shorts dropped from 87,499 contracts five weeks ago to 4,435. Some squeeze!
As did the flows.
In the week to Wednesday, per ETF.com, $198 million moved into IWM, and $684 million into IJR (iShares core S&P small-cap ETF). In the past three weeks, they together attracted $3 billion.
US Dollar Index: Currently net short 3.3k, down 3.3k.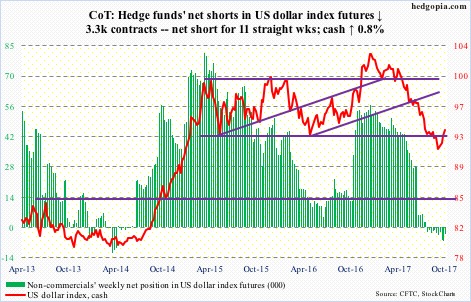
Oversold weekly conditions kept unwinding. The cash (93.64) continued to push higher. Shorter-term moving averages are rising. The 50-day is flattish, but looks to be on the verge of pointing up.
Near term, resistance lies at 94, which was unsuccessfully tested Friday. Down below, the bulls need to defend broken-resistance-turned-support at 92.50-60.
VIX: Currently net short 170.6k, down 1.8k.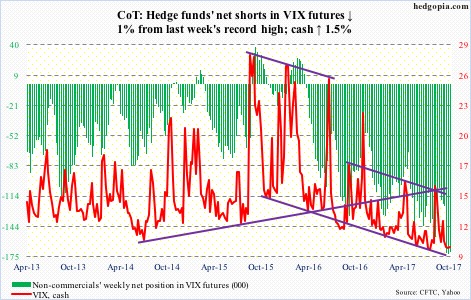
Seven weeks and counting. That is the number of weeks the VIX-to-VXV ratio has remained oversold. In five of the last seven, the ratio has been in mid- to high-0.70s and two were in low-0.80s. At least going back two and a half years, the ratio has lingered in oversold territory for weeks before spiking.
For that to happen, VIX needs to get its act together. Thus far, volatility bears continue to slam the cash near the 10- and 20-day. All five sessions closed sub-10 this week.
That said, the 10-day is at least beginning to go flat, and from the bulls’ perspective, Friday’s action is encouraging, having bounced off the lower Bollinger band. These bands have narrowed quite a bit.
Thanks for reading!
