
Following futures positions of non-commercials are as of January 25, 2022.
10-year note: Currently net short 264.7k, down 6.8k.
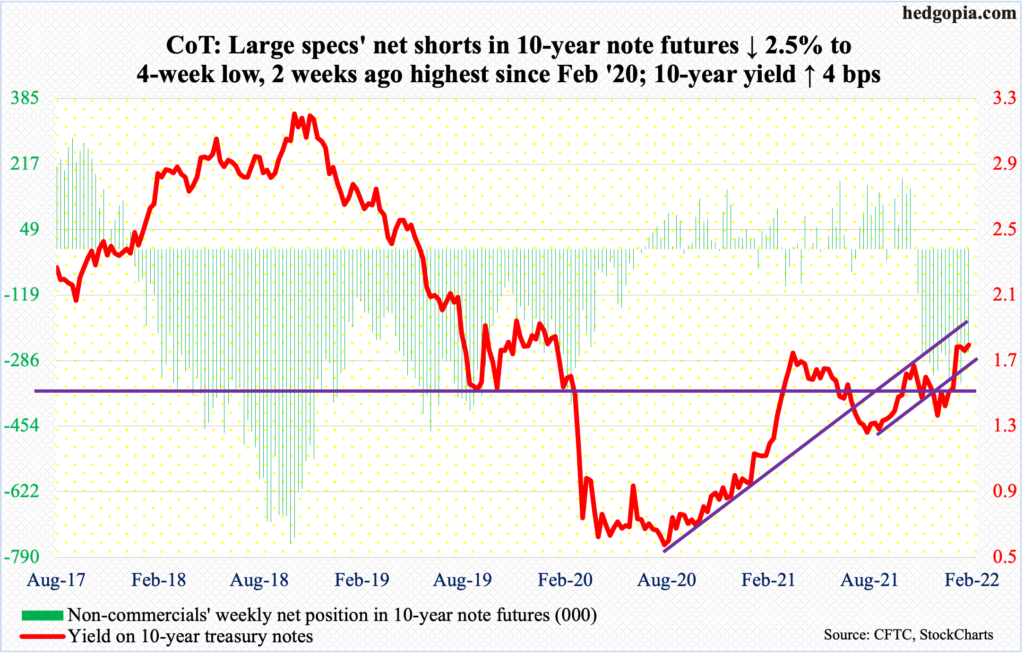
Jerome Powell, Fed chairman, has a task at hand – to bring inflation, the likes of which has not been seen in decades, down.
In the 12 months to December, the CPI (consumer price index) jumped seven percent and the PCE (personal consumption expenditures) 5.8 percent. This does not quite jibe with benchmark rates in a range of zero to 25 basis points and a balance sheet that has gone from $4.24 trillion in March 2020 to $8.86 trillion.
This week, Powell just about confirmed an imminent rate increase in the next meeting, in March. In the futures market, traders have priced in up to five 25-basis-point hikes this year. At the press conference, Powell said there was “quite a bit of room” to hike rates. He may have to tighten quite a bit to bring inflation back down to two percent, hurting the economy/corporate earnings in due course (more on this here).
A stock market that is spoiled by years of easy money is probably not ready for this.
How far will Powell go to protect asset prices? In the past, his predecessors – Alan Greenspan, Ben Bernanke, and Janet Yellen – sooner or later rode to the rescue with loads of liquidity. In other words, where exactly is the Fed put, if any? Is it the S&P 500 down 15 percent, 20 percent, or some other number? If he does not go down the path that his predecessors went – or if inflation do not let him – then interesting times lie ahead.
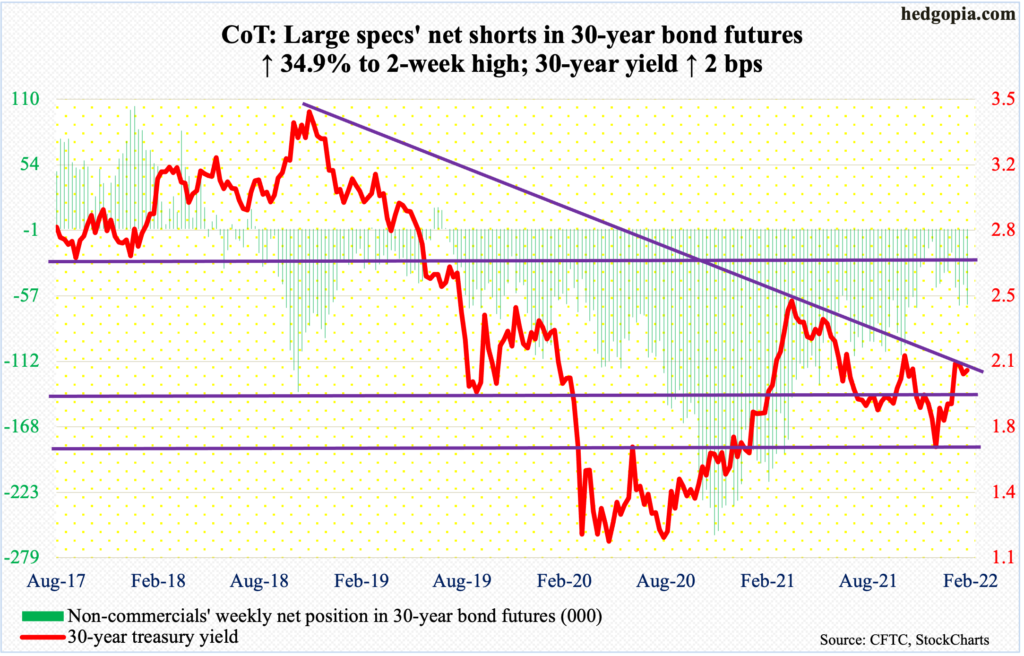
30-year bond: Currently net short 64.1k, up 16.6k.
Major economic releases for next week are as follows.
The ISM manufacturing index (January) and non-farm job openings (JOLTs, December) will be published on Tuesday.
Manufacturing activity dropped 2.4 percentage points month-over-month in December to 58.7 percent. This matches last January’s reading.
Non-farm openings fell 529,000 m/m in November to 10.6 million. October’s 11.1 million just about matches July’s record 11.1 million.
Thursday brings labor productivity (4Q21), the ISM non-manufacturing index (January) and factory orders (December, revised).
Non-farm output per hour dropped 0.6 percent year-over-year in 3Q21. This was the first y/y decline in five years.
Services activity tumbled 7.1 percentage points m/m in December to 62 percent. This still represented a 10th consecutive month of 60-plus reading.
Preliminarily in the 12 months to December, orders for non-defense capital goods – proxy for business plans for capital expenditures – were essentially unchanged at a seasonally adjusted annual rate of $79.1 billion.
Non-farm payrolls (January) are due out on Friday. In December, the economy added 199,000 jobs. In all of 2021, 6.4 million jobs were created. From the post-pandemic low of 130.2 million in April 2020, 18.8 million jobs have been added, which is 3.6 million short of the record high 152.5 million from February 2020.
WTI crude oil: Currently net long 371.5k, down 22.5k.
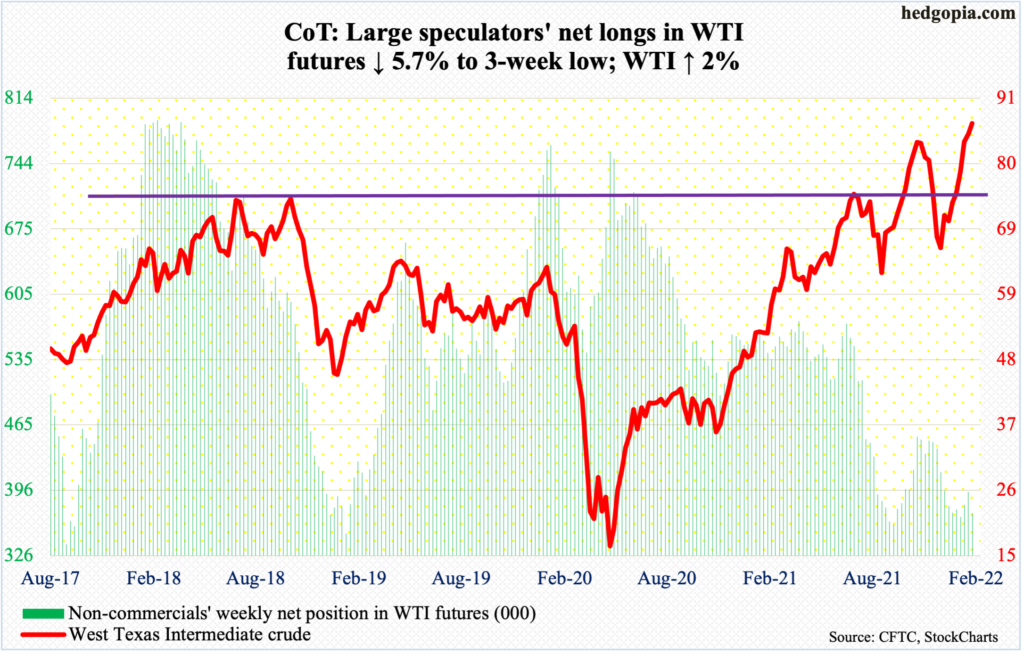
With upside momentum intact, WTI ($86.82/barrel) continued to trudge higher, with Friday ticking $88.84. The most recent bottom occurred on December 2 at $62.43.
On the daily, the crude has rallied in overbought territory for a while now; of late, the RSI has begun to diverge with the price. This is worth watching. Oil bulls were unable to hang on to all of Thursday’s as well as Friday’s intraday high/gains.
In the event of downside pressure, bulls need to defend to $85. After that, there is horizontal support around $80, and then $76-$77.
In the meantime, US crude production in the week to January 21 dropped 100,000 barrels/day to 11.6 million b/d. Crude imports, too, fell – down 509,000 b/d to 6.2 mb/d. Distillate stocks were down 2.8 million barrels to 125.2 million barrels. Refinery utilization declined four-tenths of a percentage point to 87.7 percent. Stocks of crude and gasoline, however rose – up 2.4 million barrels and 1.3 million barrels to 416.2 million barrels and 247.9 million barrels.
E-mini S&P 500: Currently net long 226.8k, up 101.6k.
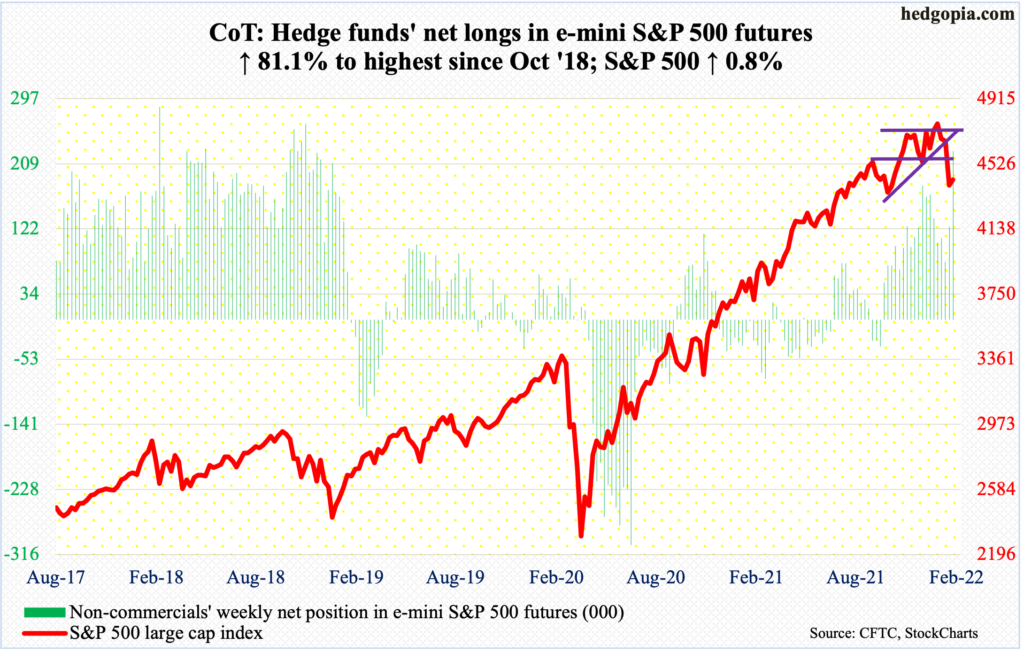
After last week’s bearish marubozu and a spinning top before that, this week started where it left off. At Monday’s low, the S&P 500 was down as much as four percent but reversed to edge up 0.3 percent, resulting in a massive hammer. By then, from the new intraday high of 4819 on the 4th this month, the large cap index was down 12.4 percent.
Monday’s low of 4223 also tested horizontal support at 4200s from April-May last year. This drew bids. By the time the week was over, the index managed to rally 0.8 percent, closing right at the 200-day moving average.
Non-commercials used the recent decline in the cash to load up on net longs, which are the highest since October 2018.
The index (4432) is way oversold on the daily. Post-FOMC weakness has been bought (more on this here). Nearest resistance lies at 4540s.
Euro: Currently net long 31.6k, up 7k.
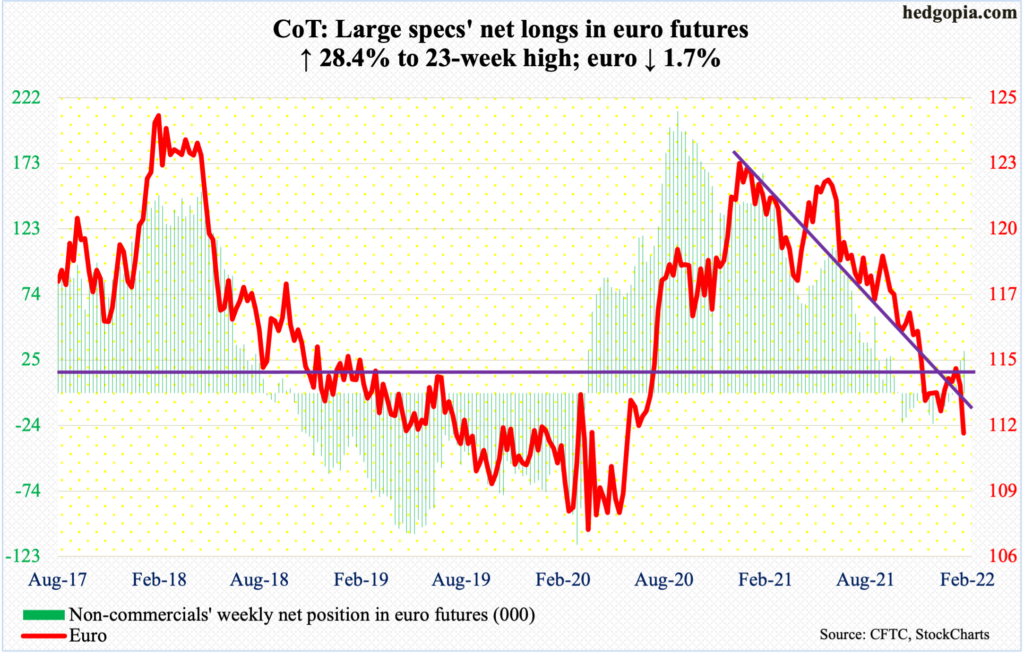
On Thursday, the euro gapped down 0.8 percent to pierce through the November 24 low of $1.1186. Earlier on Tuesday, it breached a rising trend line from that low. With one session to go this month, the currency is down two percent, to $1.1149.
Euro bulls need to recapture $1.1180s – or $1.12 – as soon as possible. Else, the downward momentum can build on itself.
Gold: Currently net long 220.2k, up 25.9k.
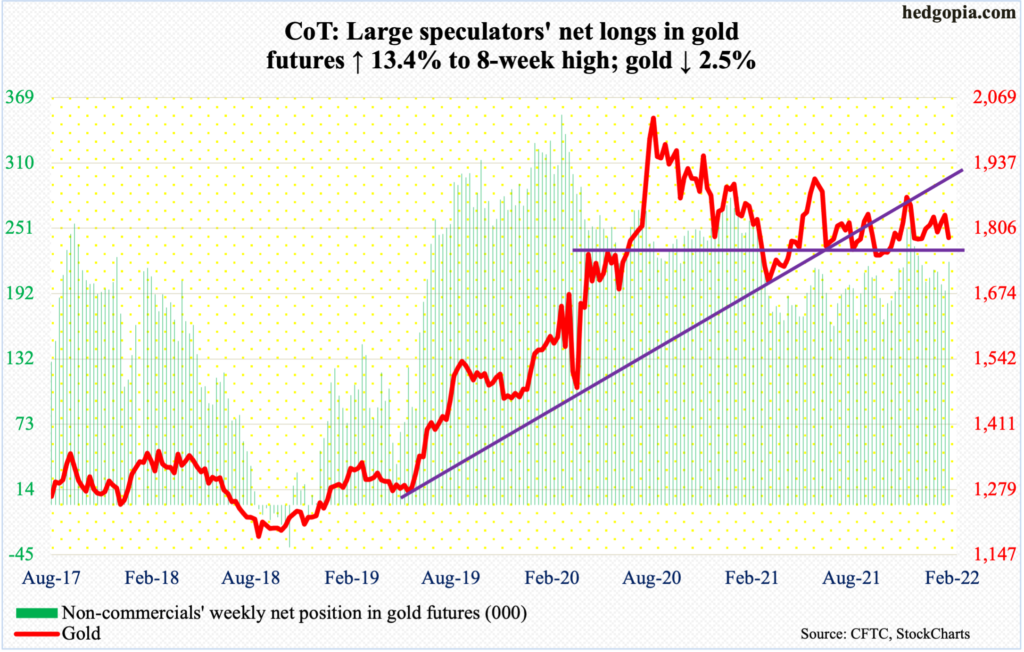
Gold traditionally has been seen as a safe-haven investment. January is just about done, and the metal is down 2.3 percent for the month, as is the S&P 500 which is down seven percent.
This week, as stocks took it on the chin, the yellow metal ($1,787/ounce) did attract bids early on, touching $1,854 on Tuesday. On Wednesday, it landed right at $1,830. Support at $1,830s goes back more than a year. Selling continued Thursday, slicing through both the 50- and 200-day to close at $1,795, which is where a rising trend line from last August lies. If this support gives way, there is crucial support at $1,760s-$1,770s, which is a must-hold.
Nasdaq 100 index (mini): Currently net long 30.1k, down 104.
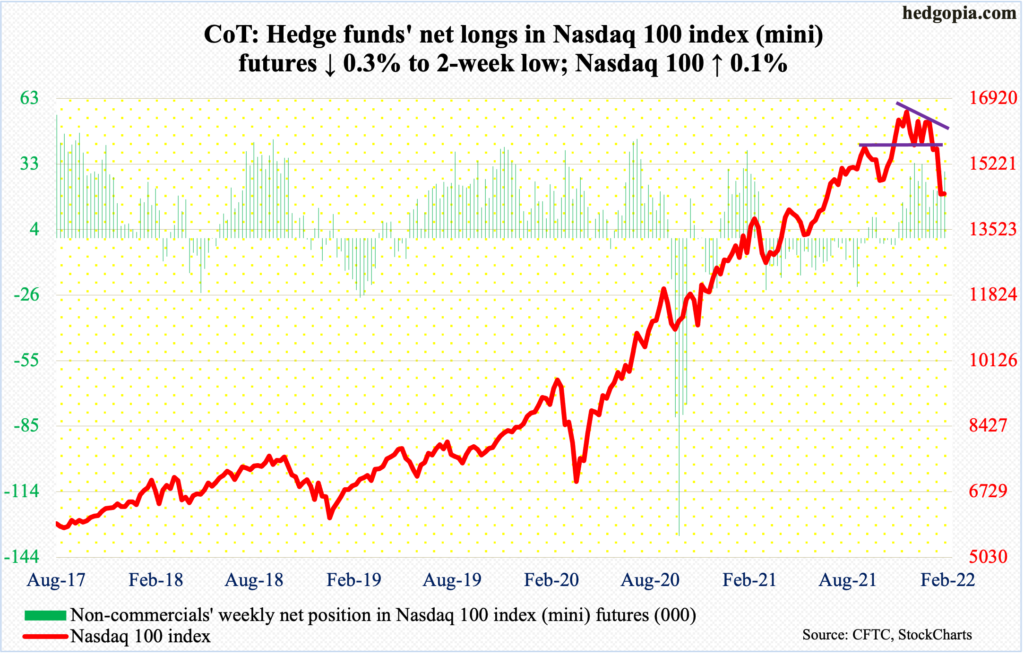
At one point on Monday, the Nasdaq 100 was down 4.9 percent, but tech bulls managed to pull themselves up by their bootstraps; by close, the hammer session ended up 0.5 percent. Willingness to buy weakness was once again seen on Friday when it rallied nearly 400 points in the last 90 minutes.
Down 18.1 percent from the November 22 record high of 16765 through Monday’s low of 13725, the tech-heavy index (14455) eked out a weekly gain of 0.1 percent. The Nasdaq 100, along with other major equity indices, has suffered technical damage this month. There is a lot of repair work ahead.
Right here and now, so long as Monday’s low is not breached, this week’s back-and-forth action can be considered healthy – for a relief rally. The 200-day lies at 15012.
Russell 2000 mini-index: Currently net short 2.8k, down 11.8k.
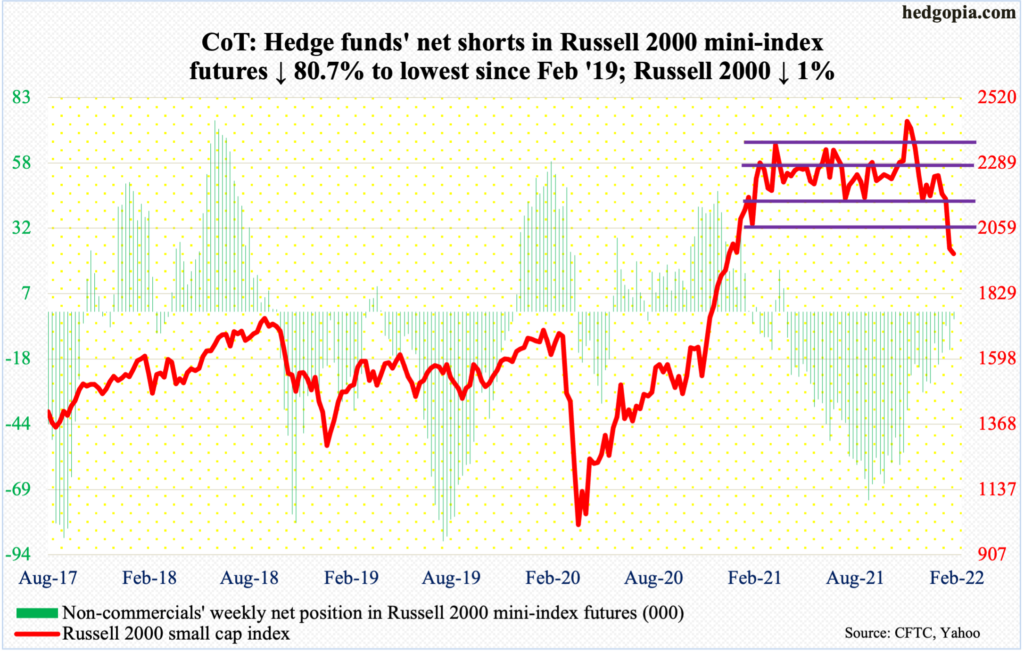
Of the major US equity indices, the Russell 2000 was the only one to have breached Monday’s low of 1931, with Friday tagging 1901. Through that low, the small cap index was down 22.7 percent from the all-time high of 2459 from November 8 (last year). It is in a technical bear market. Once again, it is the only index to have done so, with tech coming close.
By nature, small-caps have larger exposure to the domestic economy compared to their larger-cap brethren which are also exposed internationally. This arguably does not bode well for the US economy in the quarters to come. At least that is the message coming out of the small-cap arena.
Already, since last March, the Russell 2000 (1969) had been rangebound between 2350s and 2080s, and between 2280s and 2150s within this box. On Nov 3, it broke out but was quickly followed by a failed retest on the 19th. Last week, it fell out of the box. Bids showed up this week near last January’s low. A breach of this support raises the odds it will in due course proceed to test major support at 1700.
Immediately ahead, a rally is due.
US Dollar Index: Currently net long 36.9k, up 427.
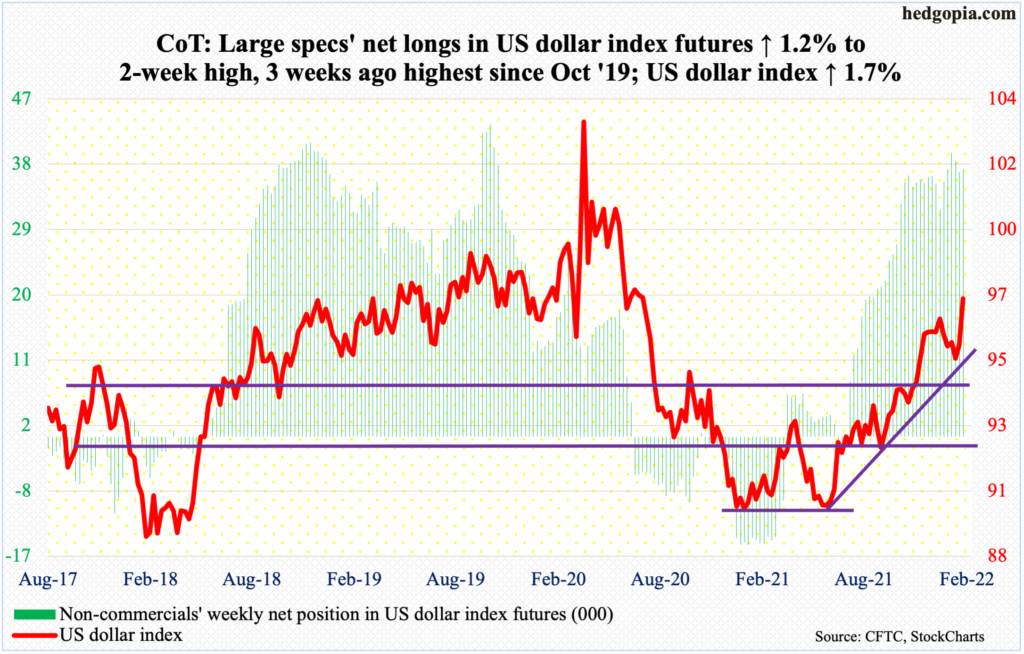
Dollar bulls made great use of the successful defense on January 13-14 of horizontal support at 94.50s. Subsequently, they not only reclaimed the 50-day but also straight-line resistance around 97 which goes back at least 18 years. Both took place this week. With this, the US dollar index (97.27) also broke out of trend-line resistance from November 24 when it tagged 96.94.
Bulls used this week’s rally in interest rates to push the index higher. The 10-year treasury yield (1.78 percent) this week rallied four basis points, but Wednesday’s high of 1.86 percent was unable to surpass the most recent high of 1.87 percent from January 19. Immediately ahead, the US dollar index likely follows rates’ path; Friday ended with a spinning top.
VIX: Currently net short 41.7k, down 5.2k.
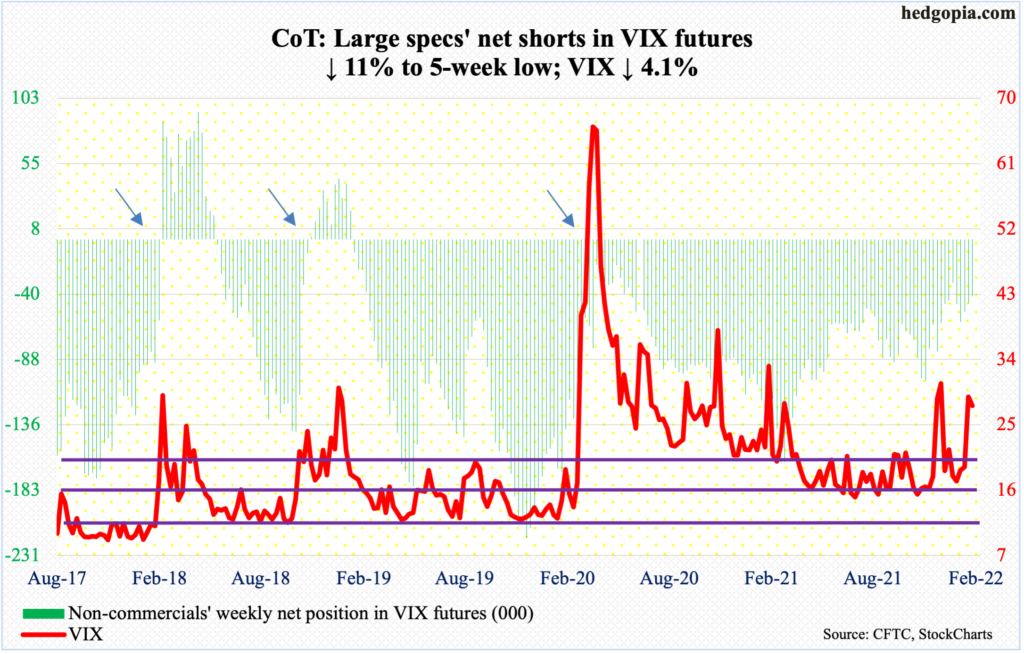
VIX this week weakened by 1.19 points to 27.66 but rallied as high as 38.94 on Monday, which was the highest print since October 2020. Volatility bulls’ inability to hold on to Monday’s gains has resulted in a spike reversal.
As recently as January 4, VIX made a low of 16.34.
In the past, such reversals have tended to put downward pressure on volatility. There is decent support at mid-20s, which incidentally was just about tested on Wednesday when the volatility index tagged 26.90. A loss of mid-20s, which is looking likely, will be cherished by equity bulls.
Thanks for reading!
