
Following futures positions of non-commercials are as of Nov 14, 2017.
10-year note: Currently net long 74.8k, up 24.8k.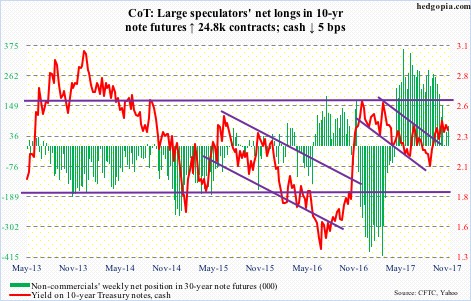
The dichotomy continues.
At 1.73 percent, two-year T-yields, which reflect markets’ expectations for the Fed’s monetary policy, are the highest since October 2008.
The Fed is on course for a move in December (12-13), with the futures market predicting 92-percent odds of a hike. This will be the fifth 25-basis-point raise since December 2015, which will put the fed funds rate between 125 and 150 basis points. Historically, rates are still very low – and accommodative.
The FOMC’s dot plot suggests there will be three more hikes next year, which the short end of the yield curve seems to have bought into.
Except the long end begs to differ.
The spread between two- and 10-year yields dropped to 62 basis points Friday. This is the narrowest since November 2007.
The 10-year just cannot get going. In December last year, yields retreated after hitting 2.62 percent, which was once again tested in March this year – unsuccessfully. The most recent rally peaked at 2.48 percent on October 25.
Recall that 10-year yields (2.35 percent) have been trapped in a descending channel for three decades now, and will break out around 2.6 percent.
But the long end’s inability to even test that resistance – let alone penetrate – is confounding, particularly so given economic data of late have been coming in better than expected.
Something has got to give.
Either the U.S. economy decelerates meaningfully, or the 10-year breaks out of that channel. Either scenario will have implications for a whole host of assets, not the least of which are equities. Particularly so considering the amount of leverage in the system – government, corporate and individual.
30-year bond: Currently net long 45.2k, up 5.8k.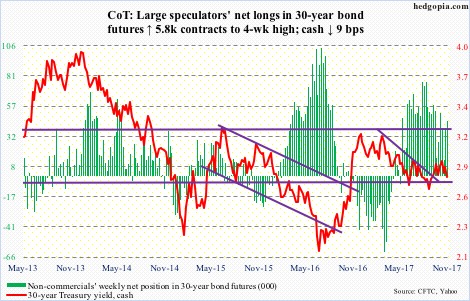
Major economic releases next week are as follows. Happy Thanksgiving!
Existing home sales for October are due out Tuesday. September was up 0.8 percent month-over-month to a seasonally adjusted annual rate of 5.39 million units. March’s 5.7 million units were the highest since 5.79 million in February 2007. The median price of an existing home in September was $245,100, versus the all-time high of $263,300 in June this year.
Wednesday brings durable goods orders (October), the University of Michigan’s consumer sentiment index (November, final), as well as FOMC minutes for the October 31-November 1 meeting.
Orders for non-defense capital goods ex-aircraft – proxy for business capital expenditures – jumped 8.3 percent year-over-year in September to $66.3 billion (SAAR). This was excellent growth, except that year-ago numbers were suppressed. Orders peaked at $70.3 billion in September 2014 and bottomed at $59.9 billion in May last year.
Preliminarily, consumer sentiment in November fell 2.9 points m/m to 97.8. October’s 100.7 was the highest since 103.8 in January 2004. Sentiment jumped in the wake of the presidential election in November last year. In October last year, the index read 87.2.
Crude oil: Currently net long 619.2k, up 36.1k.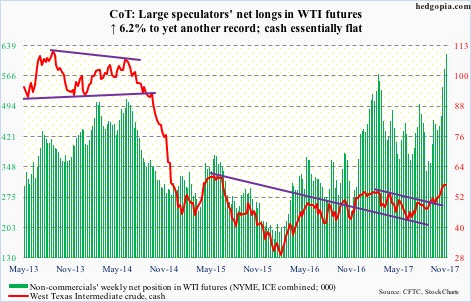
West Texas Intermediate crude ($56.71/barrel) finally gave in. Sort of. After giving out signs of fatigue last week, it sliced through the 10-day moving average Tuesday, but only to get reclaimed Friday. The bulls defended the 20-day in the following sessions, which also approximates support at $54-55.
Near-term, the bulls may have a shot at the recent high of $57.92, but after five months of persistent rally they are also having to expend a lot of energy. Non-commercials are the most net long ever.
The weekly chart – way overbought – produced a dragonfly doji this week after what looked like a reversal candle last week. There is plenty of unwinding left.
The EIA report for the week of November 10 – out Wednesday – did not favor the bulls much.
Crude production rose to yet another high – up 25,000 barrels/day to 9.65 million b/d.
Crude imports grew 521,000 b/d to 7.9 mb/d – a three-week high.
As did crude stocks, which increased 1.9 million barrels to 459 million barrels, and gasoline stocks, which rose 894,000 barrels to 210.4 million barrels.
Distillate stocks, however, dropped 799,000 barrels to 124.8 million barrels. This was the lowest since February 2015.
Refinery utilization rose 1.4 percentage points to 91 percent – the highest since pre-hurricane high of 96.6 percent 11 weeks ago.
E-mini S&P 500: Currently net long 152.6k, up 5.5k.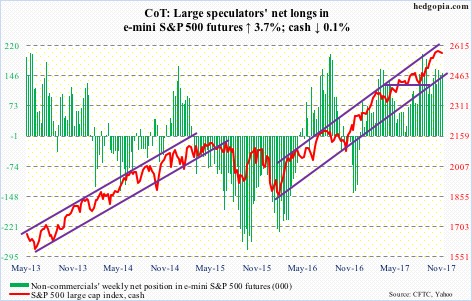
No sooner did the bulls lose short-term support at 2566 on the cash than they recaptured it. Wednesday’s selloff found buyers at the daily lower Bollinger band. Momentum may have swung the bulls’ way near term.
The weekly chart remains overbought, however. The S&P 500 has essentially gone sideways the past five weeks, with the last two producing spinning top candles.
SPY (SPDR S&P 500 ETF) continued to lose money – down $1.3 billion in the week to Wednesday and down $10.8 billion in the past three weeks (courtesy of ETF.com). But at the same time, VOO (Vanguard S&P 500 ETF) and IVV (iShares core S&P 500 ETF) continued to see inflows – up $634 million and $573 million in the week through Wednesday. In the past three, they respectively took in $2.5 billion and $2.8 billion – although not enough to offset SPY’s bleeding.
In the same week, U.S.-based equity funds lost $240 million. In the prior five, inflows were $21.3 billion (courtesy of Lipper).
For a while now, foreigners have been a tailwind for U.S. stocks.
Euro: Currently net long 84.6k, down 869.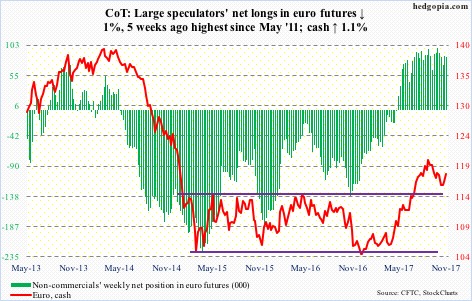
The euro-area economy maintained a solid pace of expansion in 3Q17, up 0.6 percent sequentially and up 2.5 percent y/y. Tuesday, the cash ($117.92) responded by jumping 1.1 percent. The intraday attempt in the following session to press further was rejected at the daily upper Bollinger band. Wednesday’s high of $118.61 – or thereabouts – has also been an important level going back three months.
The daily chart is itching to go lower, with a test of $116.70 likely, which also approximates both the 10- and 20-day.
Gold: Currently net long 195.1k, down 706.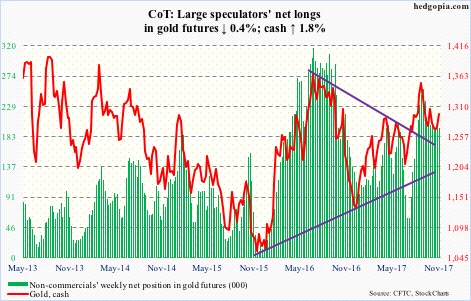
The cash ($1,296.50) hung in there, continuing to trade between the 50- and 200-day, until Friday when it rallied 1.4 percent past the former. In the meantime, daily Bollinger bands are opening up from a very tight range.
There is room to rally on the weekly chart, and it will be a victory for the bulls if they can take out $1,300.
If only flows improved a bit. In the week to Wednesday, IAU (iShares gold trust) took in $62 million, and GLD (SPDR gold ETF) $12 million. In the prior two weeks, GLD lost $400 million (courtesy of ETF.com).
Nasdaq 100 index (mini): Currently net long 27.6k, down 1.2k.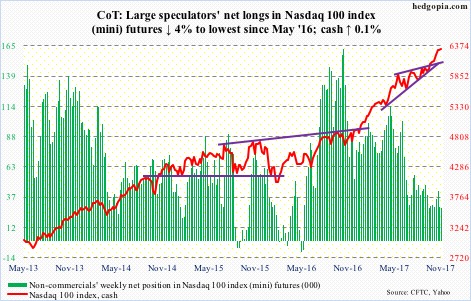
Wednesday, 42.3 percent of Nasdaq stocks were above their respective 50-day, down from 77.8 percent on October 6. Throughout this, the soldiers bore the brunt of the weakness, with the generals mostly intact.
Since the Nasdaq 100 is market cap-weighted and since the leading names were holding their ground, the index was barely off its highs. In fact, Wednesday’s long-legged doji selloff found support at the 20-day, followed by Thursday’s 1.3-percent rally, to a new intraday high.
Flows are cooperating. In the week to Wednesday, $1.2 billion moved into QQQ (PowerShares QQQ trust). This was the fourth straight weekly inflows, for a total of $3.6 billion (courtesy of ETF.com).
Non-commercials do not look that excited, though. Net longs are the lowest since May last year.
There is plenty of room for downward pressure on the weekly chart.
Russell 2000 mini-index: Currently net short 252, down 1.5k.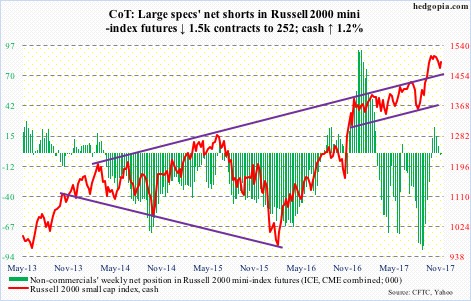
After bleeding in each of the prior seven sessions for a total of $1.9 billion, IWM (iShares Russell 2000 ETF) attracted $505 million Wednesday. For the week ended that session, it lost $984 million, and IJR (iShares core S&P small-cap ETF) $55 million (courtesy of ETF.com).
The Russell 2000 (cash) peaked on 1514.94 on October 5, before trending lower, subsequently dropping out of a descending channel as well as losing the 50-day. The bulls were risking a breakdown, until they stepped up Wednesday to defend support at 1450s. Intraday, between that low and Friday, it already rallied 2.9 percent.
Near-term, there is room for the index (1492.82) to push higher, provided 1480-85 remains intact.
US Dollar Index: Currently net short 2.8k, up 3k.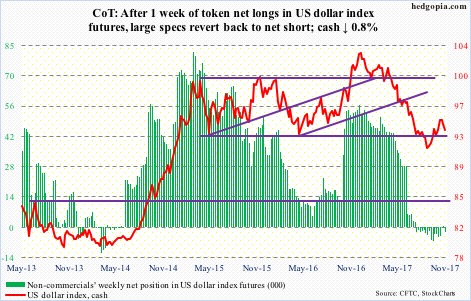
The cash (93.57) is at an interesting juncture. Since getting rejected at 95.06-07 twice in the last three weeks, sellers showed up on the US dollar index. Support at 94 has been lost. Overbought weekly conditions can exert control if the 50-day (93.33), which was defended Wednesday, is lost.
Non-commercials continue to act hesitant. After one week of net long, albeit just by a tad, they went back to net short.
VIX: Currently net short 127.7k, down 25.7k.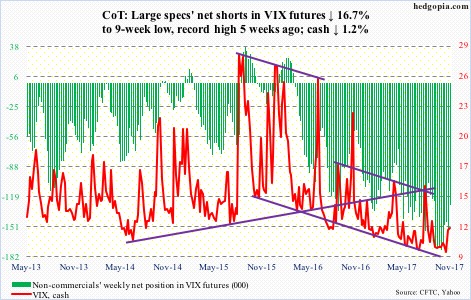
Same old, same old.
Volatility bulls had an opportunity, which they seized on but were unable to hang on to it. Wednesday’s intraday jump to 14.51 – highest since August 21 – ended up with a spike reversal. Friday, the cash closed at 11.43. The 200-day is right underneath.
Near term, VIX has room to head lower.
Thanks for reading!
