
Following futures positions of non-commercials are as of Aug 8, 2023.
10-year note: Currently net short 691.7k, up 46.5k.
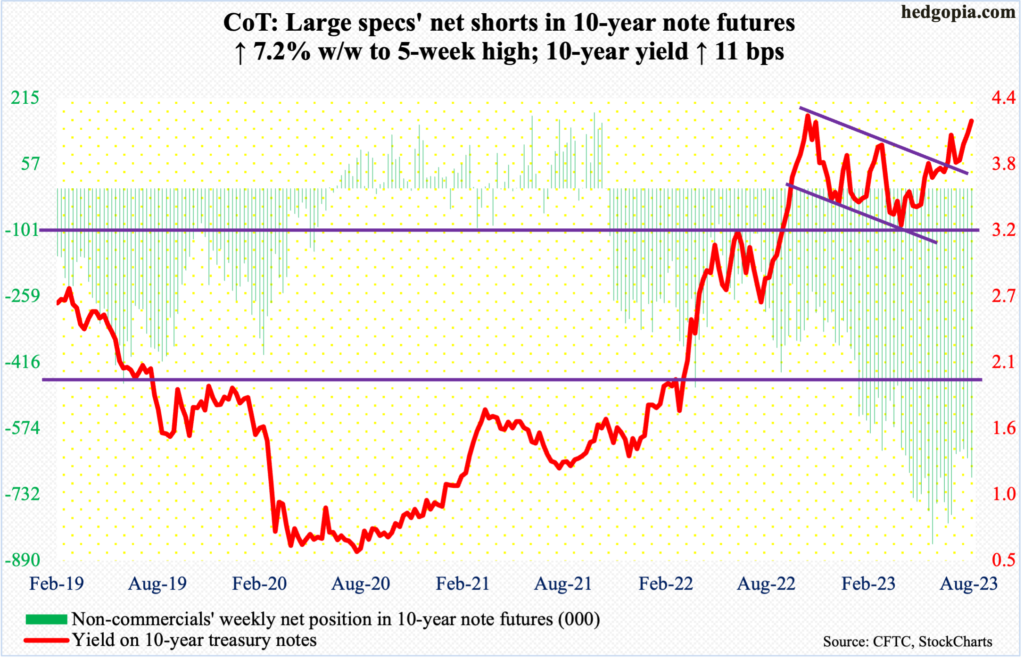
Minutes for the July 25-26 meeting are due out Wednesday. The fed funds rate was raised by 25 basis points in that meeting, to a range of 525 basis points to 550 basis points. Fourteen months ago in March last year, these rates were zero to 25 basis points – left there languishing for two whole years post-Covid economic disruptions.
Both the FOMC statement and Chair Jerome Powell in the presser made it clear last month that September would be a live meeting, suggesting a pause is as much possible as a hike. In other words, they were data dependent.
After last month’s hike, July’s payroll data came in softer than expected, with the economy producing 187,000 non-farm jobs. In the 12 months to July, headline and core CPI – out Thursday – grew 3.2 percent and 4.7 percent, versus last year’s four-decade highs of 9.1 percent (June) and 6.6 percent (September), in that order.
If the Fed is looking for a reason not to hike in September, they have plenty to fall back on. However, the next meeting is not until September 19-20. By then, August’s payroll (September 1) and CPI (September 13) as well as July’s PCE index (August 31) will be out. So, for a data-dependent Fed, things can go either way.
Fed funds futures traders, who have been consistently low-balling Fed action, continue not to expect another hike. To them, July’s was the last hike in the tightening cycle and that the benchmark rates would be aggressively cut next year, with the first easing coming in March or May and ending 2024 between 400 basis points and 425 basis points. The Fed has persistently downplayed this outlook. The minutes next week are unlikely to change this.
More pertinent is if upcoming data – both jobs and inflation – continue to show signs of deceleration, that should not only take a September hike off the table but also force the Fed to soften its rates outlook for next year – not to the extent fed funds futures are predicting but softer than what the Fed has been telegraphing.
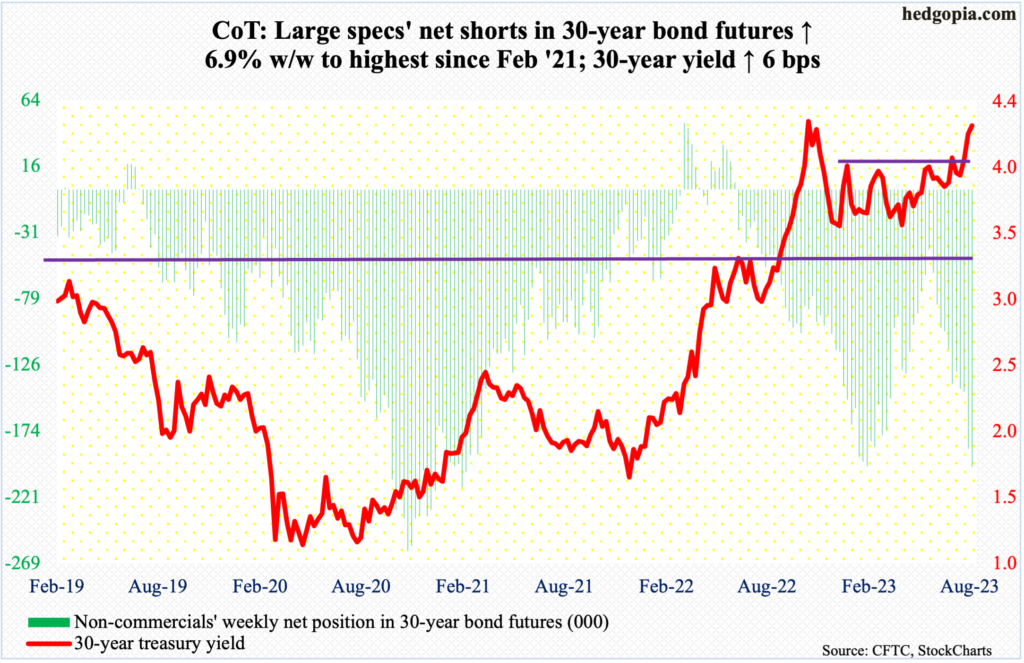
30-year bond: Currently net short 199.6k, up 12.9k.
Major US economic releases for next week are as follows.
Retail sales (July) and the NAHB housing market index (August) are scheduled for Tuesday.
Retail sales edged up 0.2 percent month-over-month in June to a seasonally adjusted annual rate of $689.5 billion – not too far away from the record $692.5 billion posted in January.
Homebuilder optimism inched up a point m/m in July to 56. Optimism had slumped to 31 last December.
Wednesday brings industrial production (July) and housing starts (July).
Capacity utilization in June dropped 0.7 percent m/m to 78.9 percent. The cycle high 80.8 percent was hit last September.
June housing starts tumbled eight percent m/m to 1.43 million units (SAAR) – a two-month low.
WTI crude oil: Currently net long 283.3k, up 6.3k.
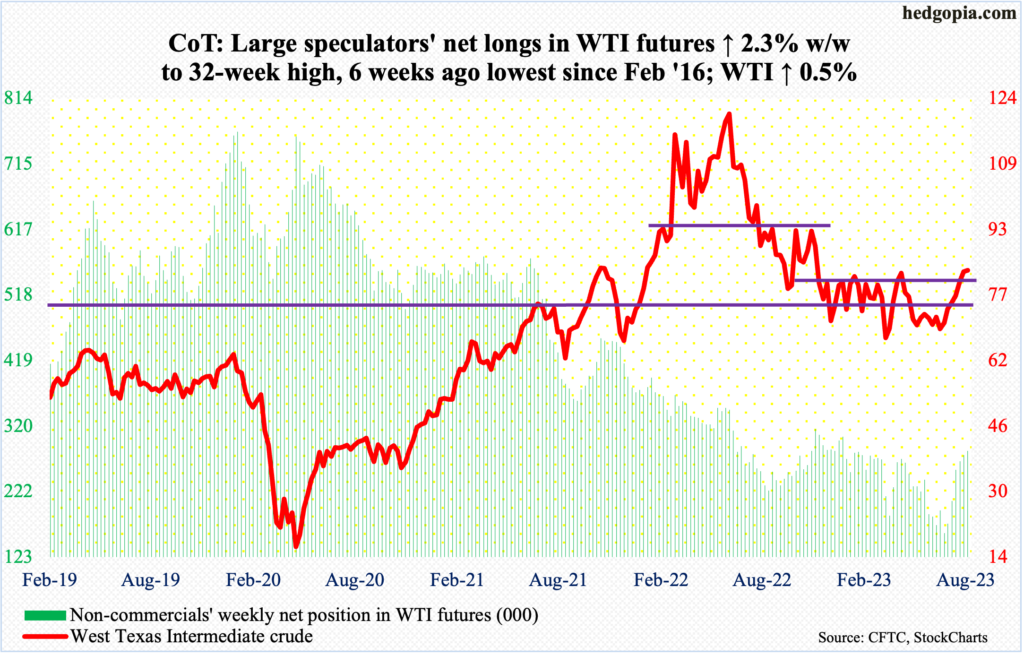
Oil bulls eclipsed the April high intra-week but could not quite close the deal. West Texas Intermediate crude ($83.19/barrel) rallied 0.5 percent for the week – its seventh consecutive weekly gains. At Thursday’s intraday high of $84.89, it was up 2.5 percent for the week, but the bulls failed to hold on to it. The weekly ended with a spinning top.
Last week, the crude poked its head out of an eight-month range between $71-$72 and $81-$82. Ability to keep most of Thursday’s gains would have established a higher high past the April high.
WTI acts like it is tired for now. On June 28, it began to rally from an intraday low of $67.05. The daily is in deep overbought territory. Breakout retest at $81-$82 is the path of least resistance.
In the meantime, as per the EIA, US crude production in the week to August 4 increased 400,000 barrels per day week-over-week to 12.6 million b/d, which is the highest since March 27, 2020. Crude imports increased as well, up 14,000 b/d to 6.7 mb/d. As did crude inventory, which was up 5.9 million barrels to 445.6 million barrels. Stocks of gasoline and distillates, however, dropped – respectively down 2.7 million barrels and 1.7 million barrels to 216.4 million barrels and 115.4 million barrels. Refinery utilization firmed up 1.1 percentage points to 93.8 percent.
E-mini S&P 500: Currently net short 159.6k, down 40.5k.
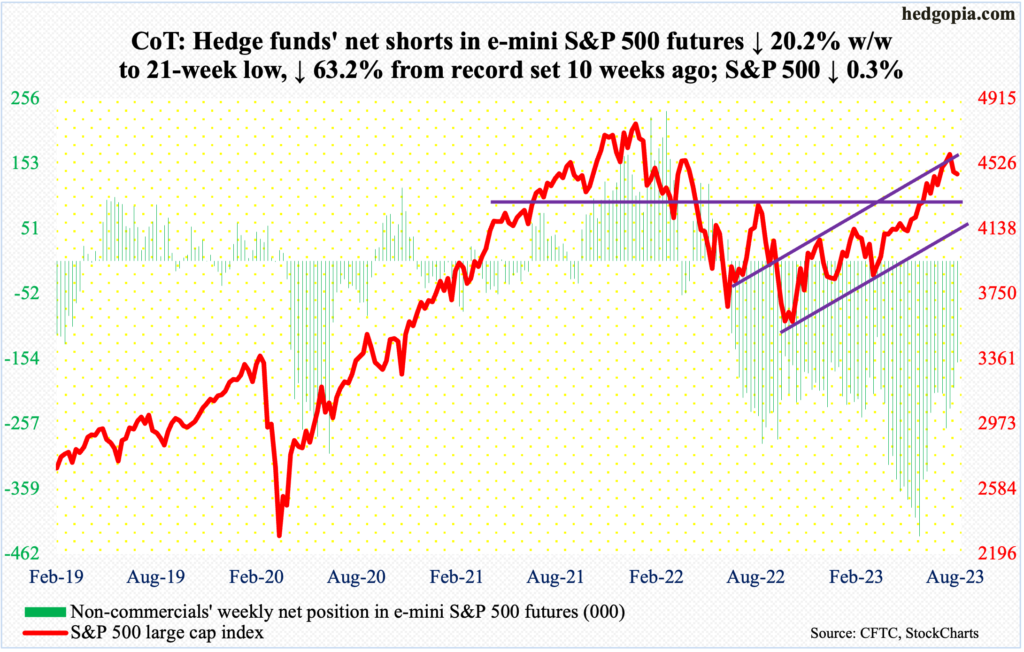
Equity bears who were zealously shorting at/near the low from last October contributed massively to the rally that followed. Between that low (3492) and the high of July 27 (4607), the S&P 500 shot up 31.9 percent.
In the week to October 18 last year, non-commercials were net short 223,198 contracts in e-mini S&P 500 futures. The cash began to rally, but these traders were not convinced the upward momentum had sustaining power. By May 30, they were net short a record 434,170 contracts, even as the S&P 500 had rallied to 4206. Ten weeks later, their holdings are down 63.2 percent from that high, while the S&P 500 went on to tick 4607 on July 27, before reversing lower. The tailwind provided by bears’ short-covering is no more – or at least substantially less than before.
Elsewhere, mid-September last year, SPY (SPDR S&P 500 ETF) short interest stood at 180.5 million, which was the highest print since February 2021. At the end of July, this was down to 132.9 million – only 2.5 percent from the mid-February low of 129.7 million (more on this here).
The bottom line is that the odds of a short squeeze have gone down meaningfully, and the bulls are sitting on tons of paper profit. They cannot be blamed for cashing in at least some of the gains.
The S&P 500 is now down two weeks in a row, closing the week at 4464. Friday’s intraday low of 4444 just about tested the 50-day (4438). The daily is beginning to get oversold. If bulls put foot down and defend the average, bears are likely to get active at 4520s. Else, a breach of the 50-day opens the door for breakout retest at 4320s (more on this here).
Euro: Currently net long 149.8k, down 22.3k.
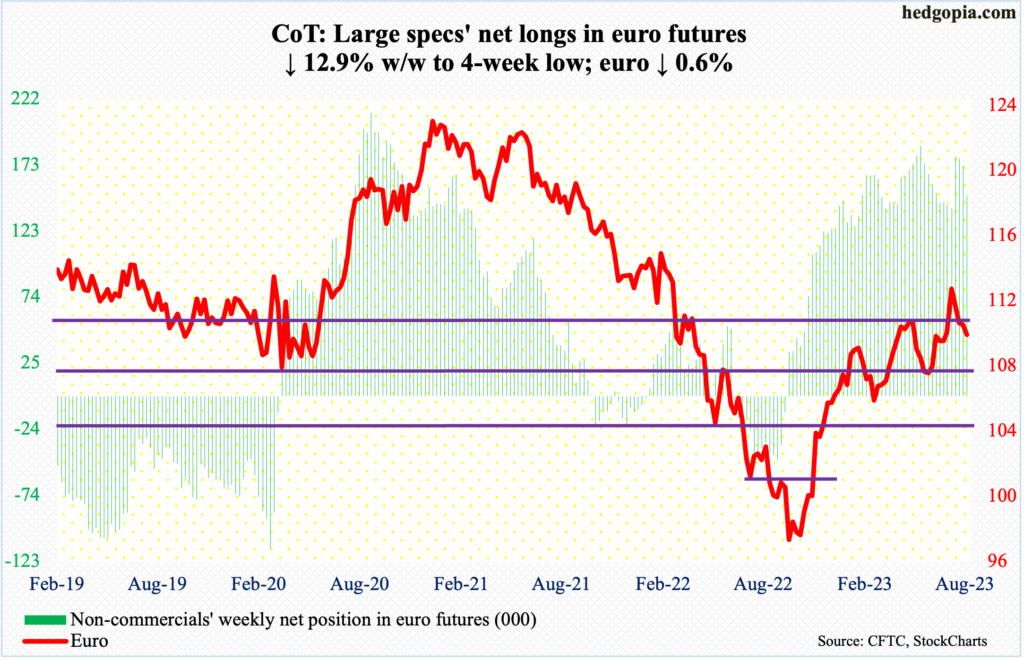
The monthly RSI runs a risk of turning down at the median; last year, it languished sub-30 for a few months before the euro bottomed at $0.9559. On July 18, the currency tagged $1.1270 intraday. It is possible momentum is turning the other way.
Four weeks ago, the euro broke out of $1.09-$1.10. Now, the bulls are fighting to save it. For nearly two weeks now, the currency has gone sideways just above the 50-day, with Friday’s close of $1.0950 barely under the average at $1.0957.
Non-commercials have been cutting back of late, but they still hold sizable net longs; continued reduction – likely – should put the currency under pressure.
Gold: Currently net long 143k, down 21.9k.
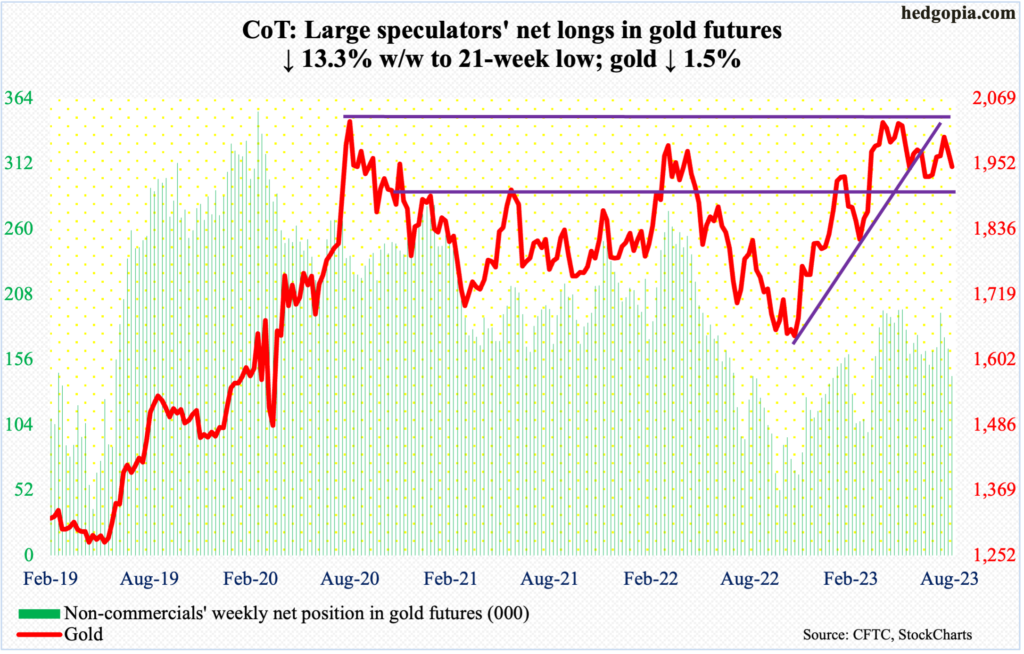
The weekly RSI is at a crucial stage. Gold bottomed at $1,620s last October-November. Soon thereafter, the weekly RSI rallied past the median, eventually peaking just north of 70 early April; this week, the metric closed at 50.78. A push under the median can be taken to mean that momentum is seriously weakening.
Gold bugs indeed had an opportunity but failed to take out $2,080s. On May 4 (this year), in a spinning top session, the metal ticked $2,085 before pulling back. In the past, $2,089 was tagged in August 2020 – an all-time high – and $2,079 in March 2022.
This has adversely impacted non-commercials’ sentiment, as they reduced net longs in gold futures from 193,348 contracts as of July 18th to this week’s 142,985, which still remains elevated. If $1,920s go, it is possible these traders will cut back holdings in a hurry. A test of that level looks imminent. This week, the 50-day ($1,958) was breached, with gold closing at $1,947/ounce.
Nasdaq 100 index (mini): Currently net short 10.9k, down 526.
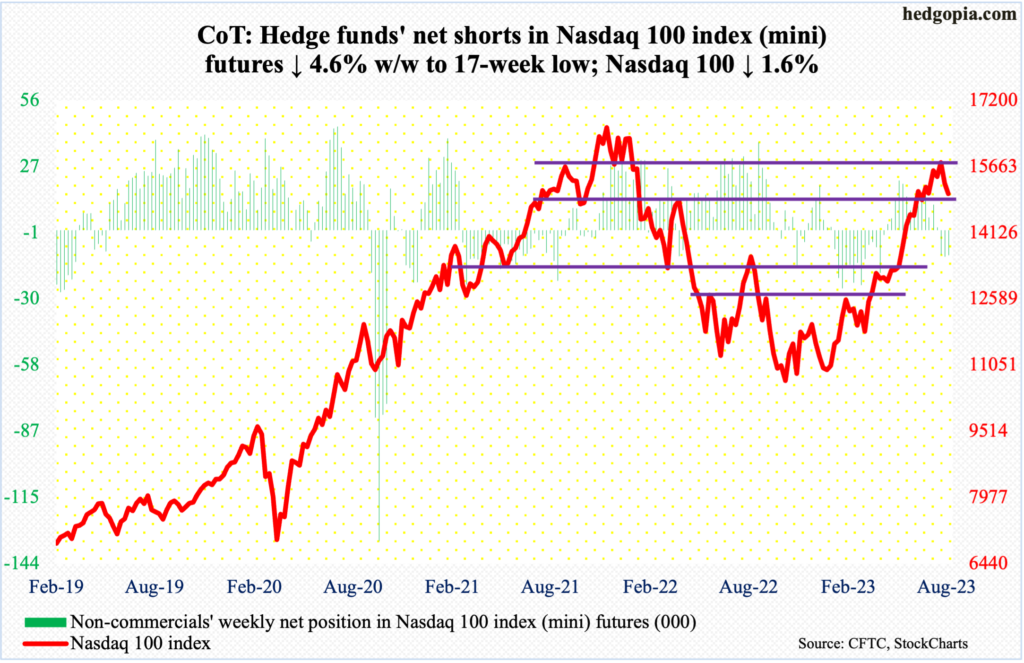
After five straight up months – and six out of seven or eight out of 10 – the Nasdaq 100 is so far down 4.6 percent in August. This week, the tech-heavy index lost the 50-day, which is the first time this has happened in five months.
Since July 19 when the index hit 15932 intraday – up 52.6 percent (!) from last October’s low – tech bulls have been on the defensive. In the right circumstances for the bears, the index has a long way to go on the downside. Conditions remain extremely overbought, although it is getting oversold on the daily.
Russell 2000 mini-index: Currently net short 64.5k, down 1.8k.
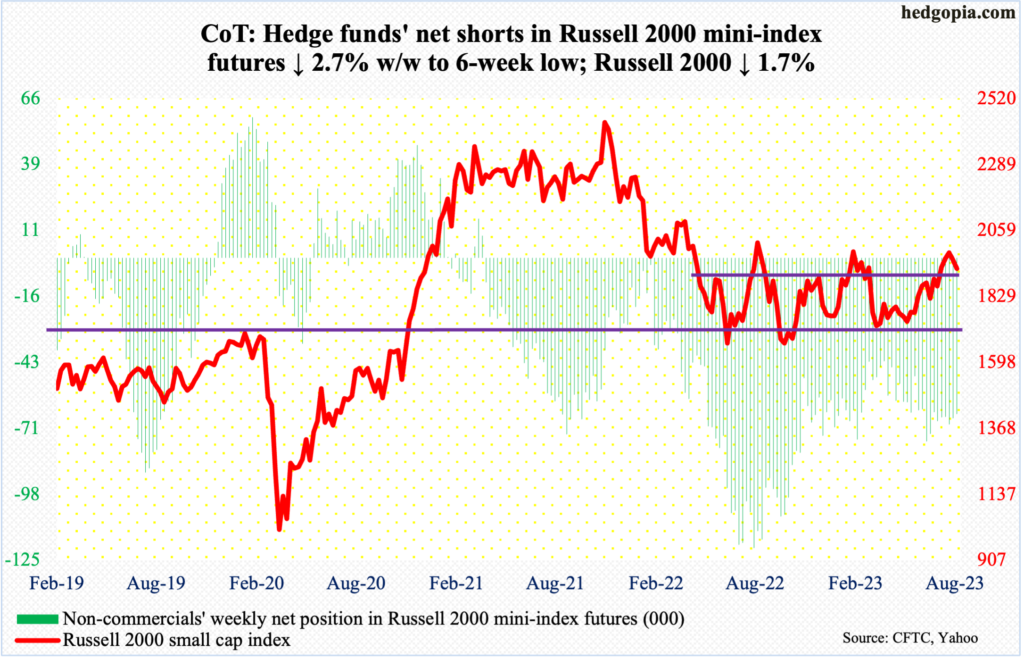
Non-commercials are proving to be a tenacious bunch. They were never flustered when the cash broke out of 1900 on July 11. This was an important breakout as the Russell 2000 had been rangebound between 1700 and 1900 since January last year. In the week to July 11, non-commercials held 65,873 net shorts in Russell 2000 mini-index futures; this week, holdings were steady at 64,511. In the interim, post-1900 breakout, the small cap index rallied to 2004, which was hit on July 31, but came up short of eclipsing the February high of 2007. No higher high – not this time anyway.
This raises the odds of the Russell 2000 revisiting the breakout point sooner than later. As a matter of fact, having closed this week at 1925, with a low of 1914 on Friday, the index arguably has already done that. Saving it will not be easy for small-cap bulls.
US Dollar Index: Currently net long 2.6k, down 491.
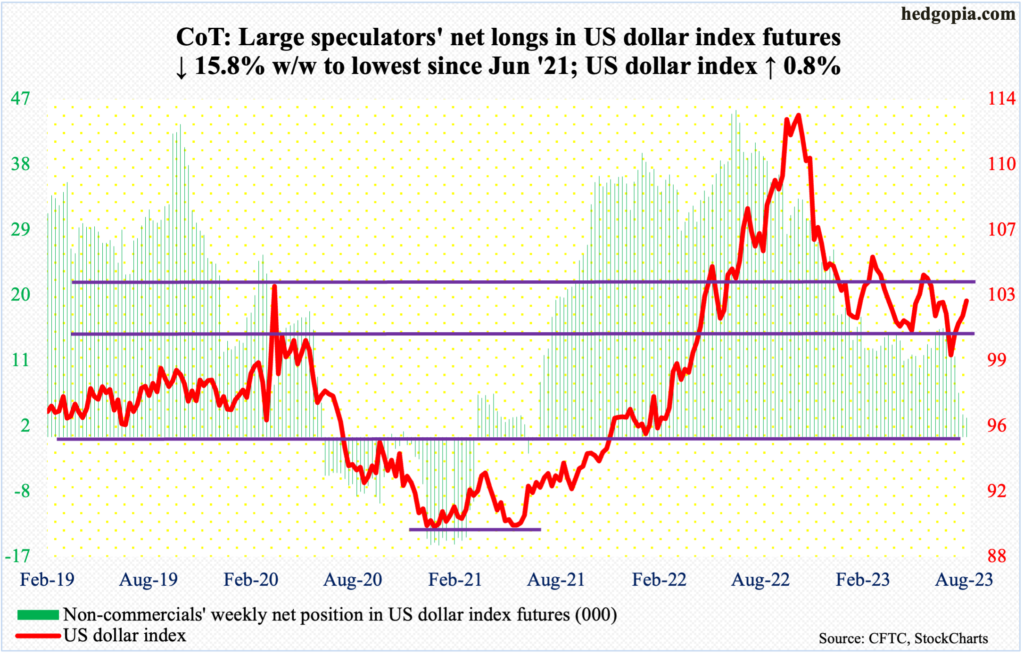
Dollar bulls came a step closer toward a test of 103-104. A test of that level was rejected in May-June, subsequently bottoming at 99.20s in July.
This week, the US dollar index added 0.8 percent to 102.69. This was a fourth up week in a row.
Non-commercials, on the other hand, have reduced net longs in US dollar index futures to the lowest since June 2021. Should they decide to rebuild their positions, the cash should get a tailwind.
VIX: Currently net short 44.4k, up 2.2.
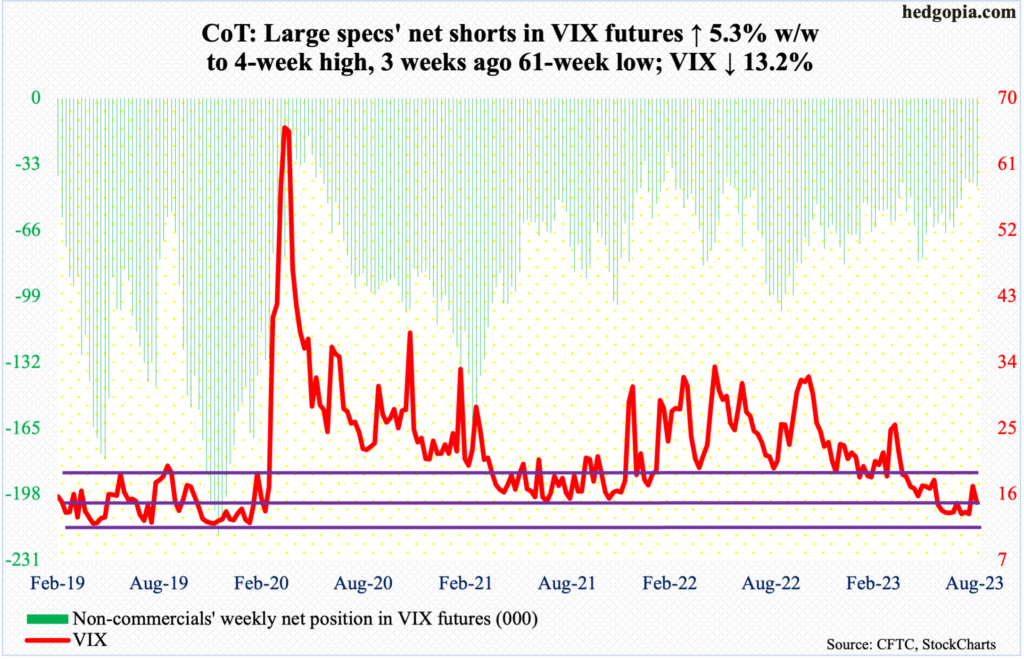
VIX experienced one of those rare weeks when it moved in unison with the S&P 500. Both were down this week.
Earlier on Tuesday, the volatility index tagged 18.14 intraday Tuesday before reversing lower to finish the session with a shooting star. By the end of the week, VIX closed at 14.84 – closing above the 50-day (14.28) for eight straight sessions. If the average is lost in the sessions ahead, there is rock-solid support at 13.
Thanks for reading!
