
Following futures positions of non-commercials are as of October 10, 2023.
10-year note: Currently net short 713k, down 20.9k.
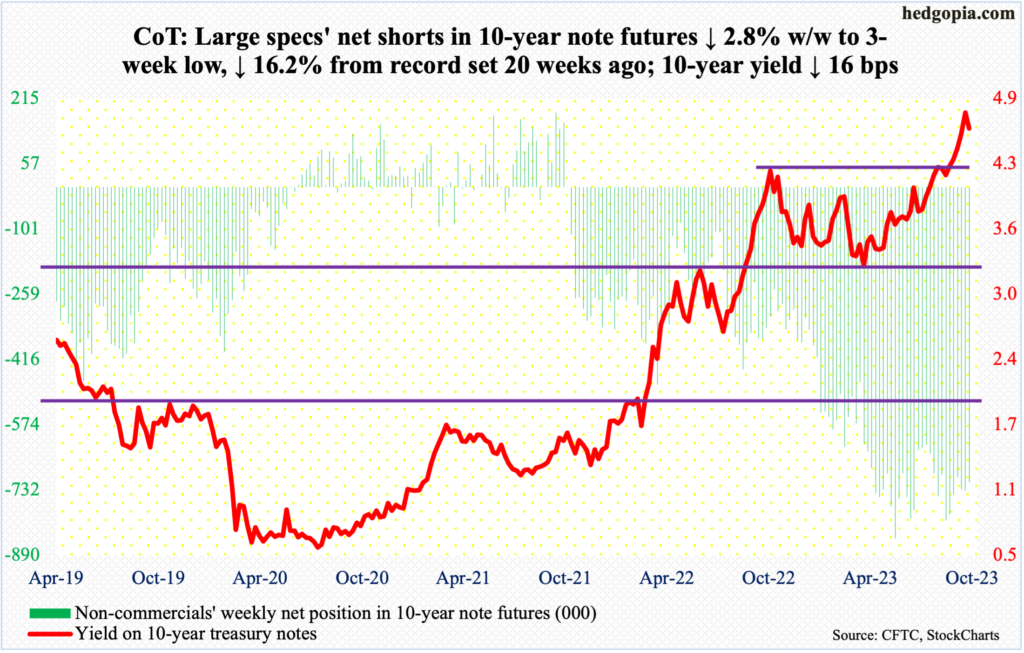
The 10-year treasury yield was volatile this week, to say the least. The five sessions went like this – up, down, down, up and down. In the end, these notes closed out the week down 16 basis points to 4.63 percent.
Earlier, the 10-year touched 4.89 percent last week before heading lower. Yields have come a long way. Early August last year, these notes were yielding 2.53 percent, and 1.13 percent in August 2021.
Bond bears (on price) have done exceedingly well, with yields knocking down one after another resistance.
Last October, the 10-year came under pressure after reaching 4.33 percent, subsequently bottoming at 3.25 percent early April this year. In the second half of August, the bears (on price) went after the October high at least three times – all unsuccessfully. In September, there were again several attempts; the resistance held firm – until the 21st when the 10-year gapped up 13 basis points to close at 4.48 percent.
Not surprisingly, such levels of import come with stop orders. Once they get taken out, it can become a self-fulfilling prophecy. In just 13 sessions, the 10-year went from a low of 4.31 percent to a high of 4.89 percent.
If this was a genuine breakout, the next time mid-4.30s get tested, bears such as non-commercials should use this as an opportunity to add to positions. A retest is yet to occur.
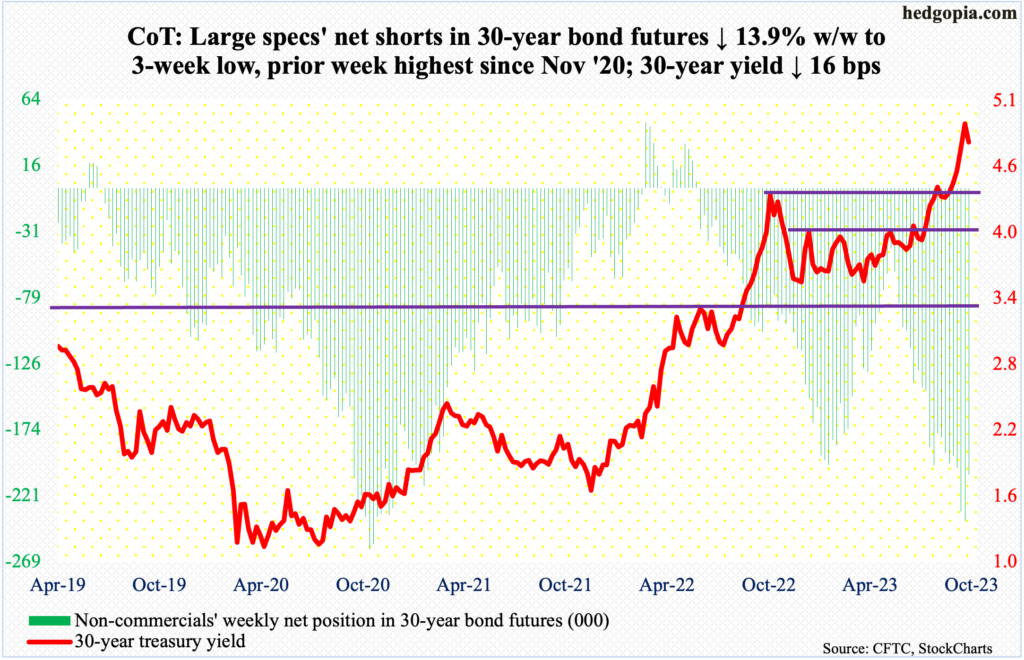
30-year bond: Currently net short 206.4k, down 33.2k.
Major US economic releases for next week are as follows.
On Tuesday, retail sales (September), industrial production (September) and the NAHB housing market index (October) are on dock.
August retail sales rose 0.6 percent month-over-month to a seasonally adjusted annual rate of $697.6 billion – a new record. From a year ago, sales were up 2.5 percent in August.
Capacity utilization inched up 0.3 percent m/m in August to 79.7 percent – a four-month high. In September last year, utilization hit 80.8 percent, which was the highest since January 2008.
Homebuilder optimism in September dropped five points m/m to 45, matching April’s reading. Last December’s 31 was the lowest since April 2020.
Housing starts (September) are due out Wednesday. Starts tumbled 11.3 percent m/m in August to 1.3 million units (SAAR), which was the lowest since June 2020.
Existing home sales (September) will be reported Thursday. August sales were down 0.7 percent m/m to 4.04 million units (SAAR) – just a stone’s throw away from January’s four million units.
WTI crude oil: Currently net long 359.2k, down 35.6k.
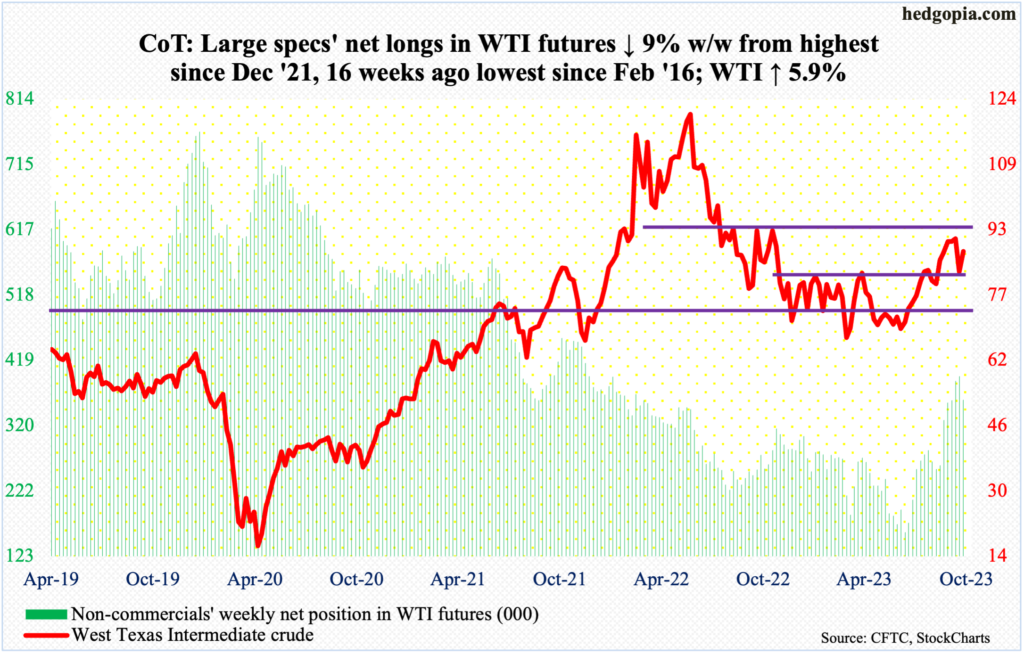
The Organization of the Petroleum Countries expects global demand for oil to grow 2.44 million barrels per day this year and 2.25 mb/d next year. The forecast is unchanged from last month. OPEC continues to expect decent demand despite output cuts from Saudi Arabia and Russia lasting until the end of the year.
West Texas Intermediate crude began the week with a 4.3-percent gap-up on Monday, weakened in the next three sessions and then jumped 5.8 percent on Friday to end the week up 5.9 percent to $87.69/barrel. The 50-day moving average was reclaimed on Monday, lost on Wednesday and then recaptured again on Friday.
The crude has been under pressure since hitting $95.03 intraday on September 28th. Earlier, it bottomed at $67.05 in late June. There is decent resistance at $93-$94.
In late August, WTI broke out of a 10-month range between $71-$72 and $81-$82. Last Friday’s low of $81.50 essentially amounts to a retest of this breakout. Immediate resistance lies at $88.
In the meantime, as per the EIA, US crude production in the week to October 6th jumped 300,000 b/d week-over-week to 13.2 mb/d, setting a fresh record; this preceded four weeks of sideways action at 12.9 mb/d. Crude imports increased as well, up 114,000 b/d to 6.3 mb/d. As did stocks of crude, which grew 10.2 million barrels to 424.2 million barrels – a seven-month high. Stocks of gasoline and distillates respectively declined 1.3 million barrels and 1.8 million barrels to 225.7 million barrels and 117 million barrels. Refinery utilization was down 1.6 percentage points to 85.7 percent – a 38-week low.
E-mini S&P 500: Currently net short 94.4k, up 21.2k.
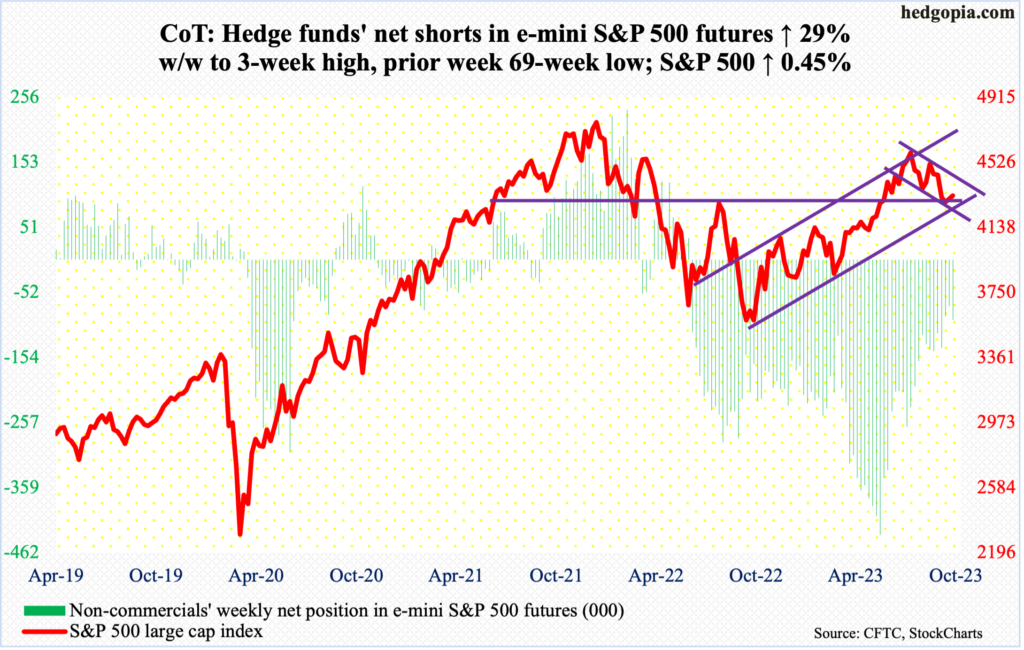
Last week, after going sideways just above the 200-day Tuesday through Thursday, the S&P 500 lifted off the average on Friday. The momentum continued early this week as by Tuesday it was up 1.8 percent for the week but faded in the last two sessions (more on this here). Sellers showed up Thursday at Tuesday’s high (4385).
A gap-up from September 21st would have gotten filled at 4400. The 50-day – declining – is at 4404. Plus, there was channel resistance at 4450s; the large cap index has traded in a descending channel since it retreated on July 27th at 4607.
By the time the week was over, the S&P 500 was only up 0.45 percent to 4328 – right at 4320s support. The daily RSI decidedly turned lower from just above the median. Odds favor 4320s get breached in the sessions ahead. The 200-day lies at 4221.
In the week to Wednesday, after six consecutive weeks of inflows totaling $20.7 billion, S&P 500-focused ETFs – SPY (SPDR S&P 500 ETF), VOO (Vanguard S&P 500 ETF) and IVV (iShares Core S&P 500 ETF) – saw redemptions of $2.2 billion (courtesy of ETF.com).
Euro: Currently net long 75.5k, down 3.4k.
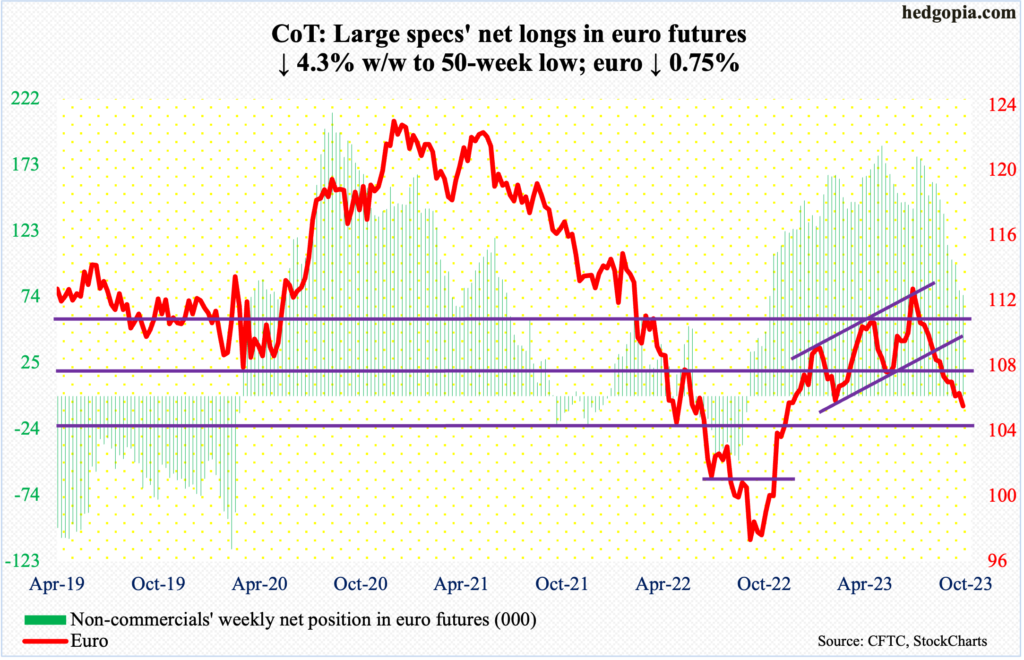
Rally attempts early in the week drew offers at the May low. At Wednesday’s intraday high of $1.0636, the euro was up 0.4 percent for the week. It then came under pressure the next couple of sessions to finish the week down 0.75 percent.
On May 31st, the euro bottomed at $1.0635 before rallying to peak at $1.1270 on July 27th. Subsequently, $1.0630s became a point of interest for both bulls and bears several times in September, before losing it on the 25th. The currency eventually bottomed at $1.0448 on the 3rd this month. Lateral support at $1.04-$1.05 goes back to at least March 2015.
When it was all said and done, the weekly produced a shooting star. This follows a couple of weekly hammers and a long-legged doji before that.
Inability to take out $1.0630s raises the odds that this month’s low acts as a magnet for now.
Gold: Currently net long 71.4k, down 19.8k.
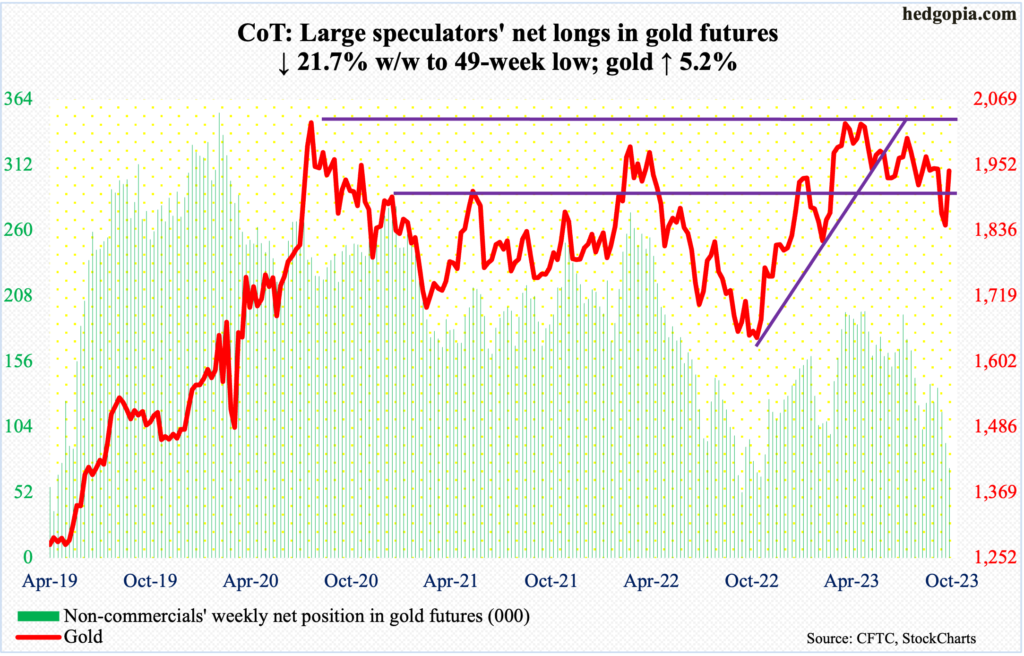
Non-commercials continue to reduce net longs in gold futures, which are now at a 49-week low. The weekend’s geopolitical problems in the Middle East did not seem to affect their willingness to cut down long exposure.
But as the week progressed, investors increasingly were gravitated toward the yellow metal. In fact, gold began with a one-percent gap-up on Monday, culminating in a 3.1-percent jump on Friday to end the week up 5.2 percent to $1,941.50/ounce.
As a result, gold bugs have recaptured $1,920s, which were lost in the week before.
Before this, gold ended last week at $1,845 – a must-hold level for the bulls – having been denied at $2,080s in early May. The metal currently sits right at trendline resistance from that high. A breakout looks imminent.
Nasdaq 100 index (mini): Currently net long 7.8k, up 6.4k.
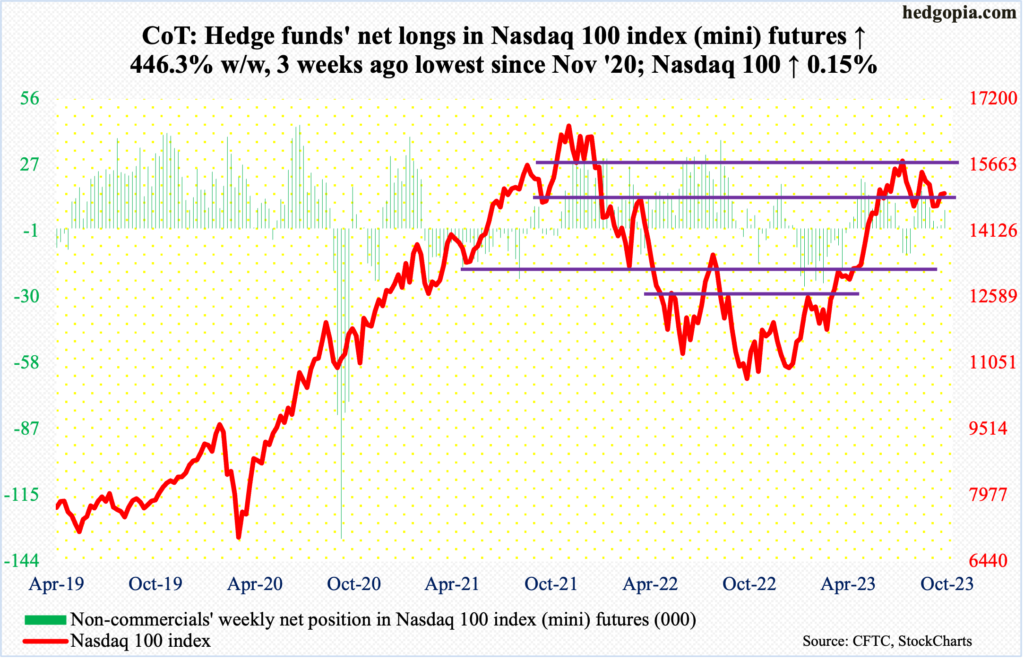
The Nasdaq 100 (14995) was up 0.15 percent this week. Tech bulls were unable to hold on to gains of 2.4 percent by intraday Thursday, with the session high 15334 just about kissing the daily upper Bollinger band as well as trendline resistance from July 19th when the index turned back lower at 15932. By Friday, the 50-day was compromised; the average was reclaimed Tuesday.
On September 27th, the Nasdaq 100 stopped going down at 14433. As things stand, bears are probably eyeing this level.
Russell 2000 mini-index: Currently net short 66.6k, up 3.3k.
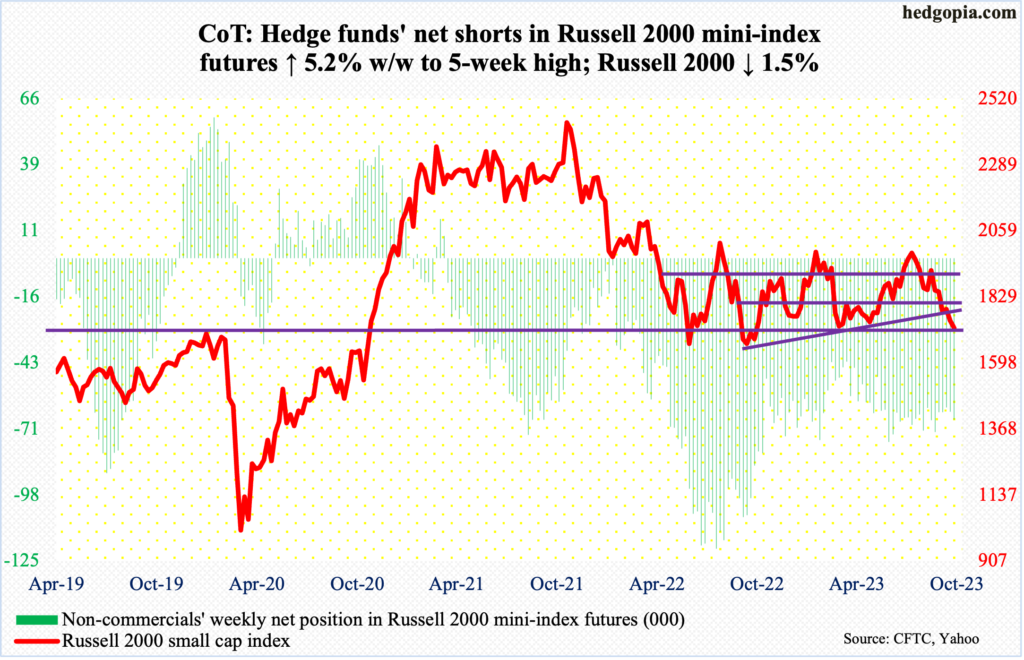
The Russell 2000 could not quite rally up to 1800. It managed to reach 1787 on Wednesday, before coming under pressure to close the week down 1.5 percent to 1720.
The small cap index three weeks ago breached the neckline of a head-and-shoulders pattern at 1800, which also constitutes the midpoint of a range between 1700 and 1900 intact since January last year.
If the head-and-shoulders pattern completes, downside risk is toward 1600. For that to happen, the bears first need to reclaim 1700. Last week, the index fell as low as 1710 and bounced. This week’s low was 1715, which was posted on Friday. Next week, small-cap bulls may not be so lucky.
US Dollar Index: Currently net long 19.5k, up 662.
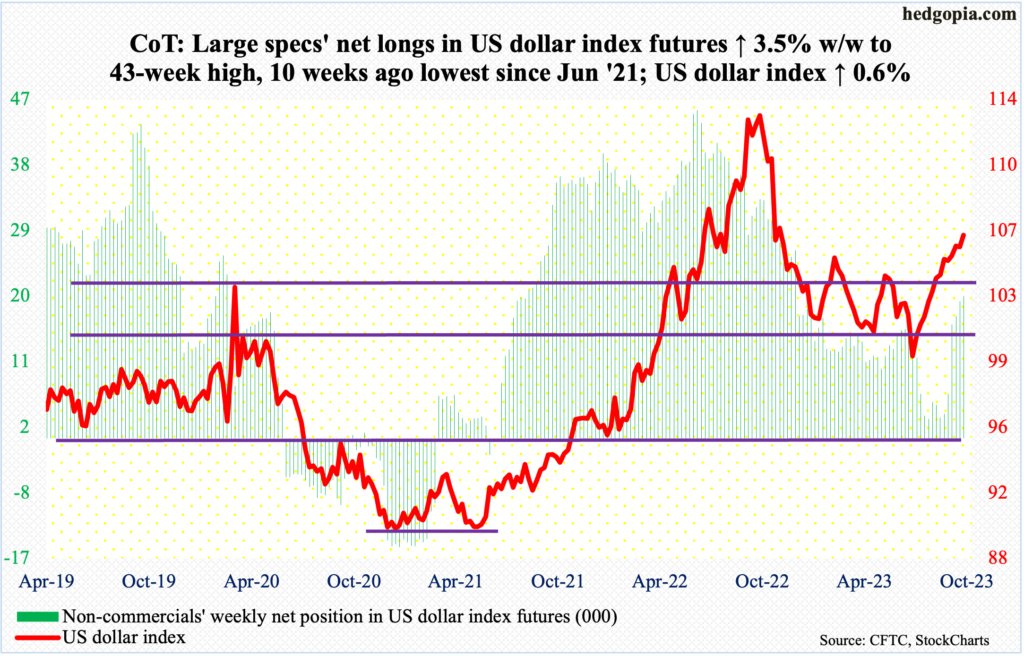
Short-term horizontal support at 105.10s was not even genuinely tested, with intraday lows of 105.31 and 105.29 on Wednesday and Thursday respectively. Those lows were bought, with the week finishing up 0.6 percent to 106.43.
Dollar bulls are probably eyeing the October 3rd long-legged doji high of 107.05. Earlier, the US dollar index bottomed at 99.22 on July 18th, having peaked last September at 114.75.
When it was all said and done, the week produced a candle that looks more like a hanging man (bearish) than a hammer (bullish). This follows last week’s weekly shooting star.
VIX: Currently net short 14.7k, down 19.5k.
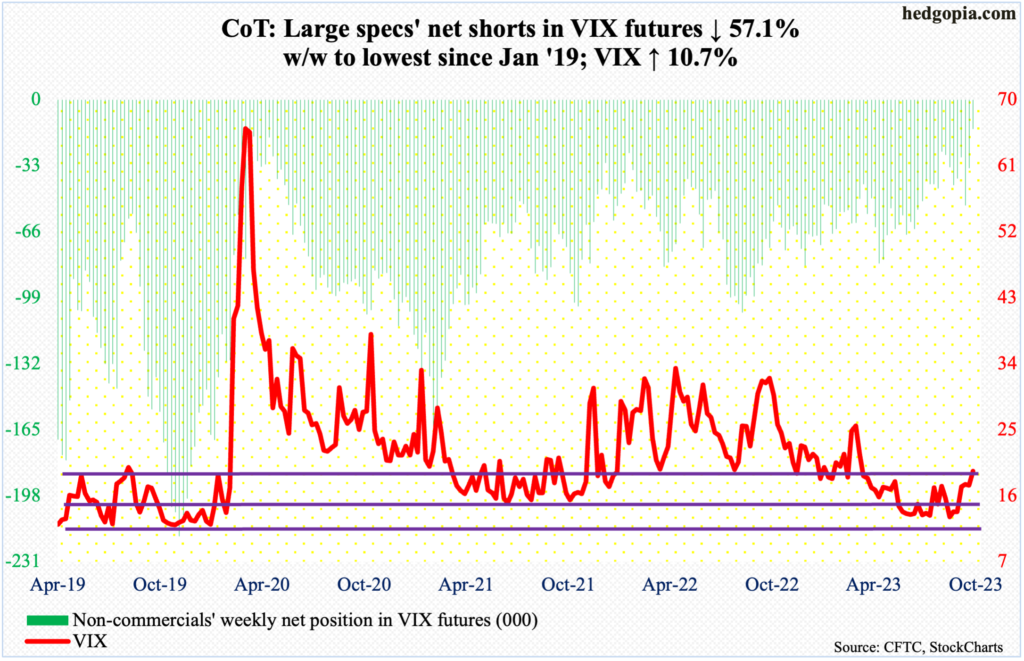
Volatility acts like it wants to perk up. Thursday’s intraday drop to 15.44, breaching the 50-day, did not last very long, reclaiming the average by close (16.69). VIX ended Friday at 19.32.
In the meantime, non-commercials reduced net shorts in VIX futures to merely 14,682 contracts – the lowest since January 2019. In the past, VIX has shown a tendency to peak once these traders either get long or get close to doing that.
Thanks for reading!
