
Following futures positions of non-commercials are as of January 2, 2018.
10-year note: Currently net short 75.8k, down 7.8k.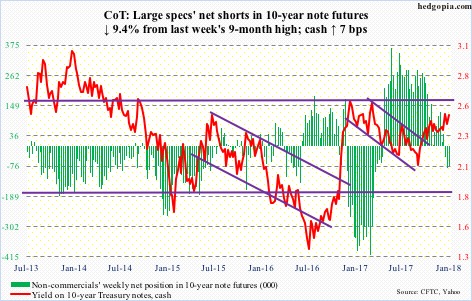
It is on. Doves versus hawks. At least for now.
FOMC minutes for the December 12-13 meeting highlighted the growing tension between the two camps. Simply put, one is focused on inflation, and the other on jobs and the low unemployment rate. The Phillips Curve has ceased to work.
During that meeting, the fed funds rate did go up 25 basis points to a range of 1-1/4 to 1-1/2 percent. There were two dissenters – Neel Kashkari of Minneapolis and Charles Evans of Chicago. They will not be voting this year.
The FOMC consists of 12 voting members – seven Federal Reserve Board members and five of 12 Fed district presidents, of which New York always votes. The remaining four serve one-year terms on a rotating basis. This year, Atlanta, Cleveland, Richmond, and San Francisco vote.
After Janet Yellen, current chair, leaves, the number of seats open for President Trump to fill rises to three. He has already nominated three, of which Randal Quarles’ has been confirmed. Jerome Powell’s as the new chair and Marvin Goodfriend’s as a member will need to be resubmitted as the Senate ended 2017 session without voting on the matter. Lael Brainard is the only leftover from the Obama administration.
The point is, it is probably prudent not to put too much weight behind what the Yellen-led Fed was thinking. The dot plot continues to suggest three hikes this year. Markets are under.
Trump constantly talks about how stocks have done well in his first year. In all likelihood, the new Fed will take its cue from stocks – go ahead and fulfill the hoped-for three hikes as long as the latter do not revolt.
30-year bond: Currently net long 83.8k, down 991.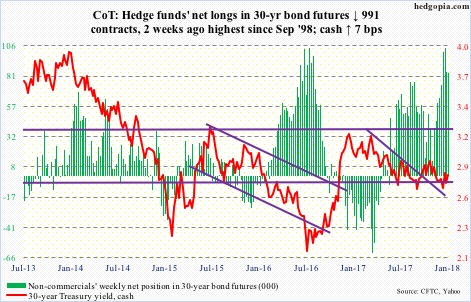
Major economic releases next week are as follows.
The NFIB small business optimism index (December) and JOLTS (November) are due out Tuesday.
Small-business optimism in November jumped 3.7 points month-over-month to 107.5 – a 34-year high. Job openings fell five points from October’s 35, which was the highest since November 2000.
Non-farm job openings (JOLTS) fell 181,000 in October from record 6.18 million in September.
Thursday has December’s PPI-FD on tap. Producer prices rose 0.4 percent m/m in November, while core PPI was up 0.3 percent m/m. In the 12 months through November, they respectively increased 3.1 percent and 2.4 percent.
Friday brings CPI (December) and retail sales (December).
Consumer prices – headline and core – rose 0.4 percent and 0.1 percent m/m in November. In the 12 months through November, they respectively rose 2.2 percent and 1.7 percent. This was the eighth straight month of year-over-year core inflation of sub-two percent.
Retail sales in November rose 5.8 percent y/y to a seasonally adjusted annual rate of $492.7 billion. This was the highest growth rate since sales advanced 6.2 percent in March 2012.
Crude oil: Currently net long 668.1k, up 2.5k.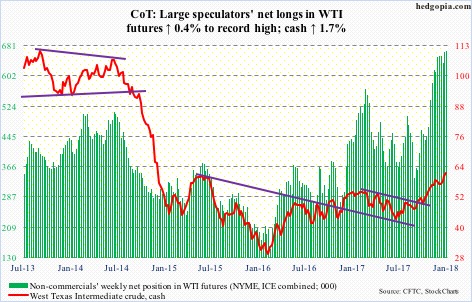
Iran tensions were the latest excuse oil bulls latched on to to keep up the upward momentum.
Spot West Texas Intermediate crude ($61.44/barrel) rallied another 1.7 percent – up 48 percent from the June low last year through this week’s high of $62.21, which was the highest since May 2015.
The crude is extended on nearly all timeframe. Thursday produced a doji just outside the daily upper Bollinger band. Let us see if the bears are able to make something out of this. Nearest decent support lies at $59.
The EIA report for the week of December 29 – out Thursday – showed U.S. crude production rose 28,000 barrels per day to 9.78 million b/d.
Both gasoline and distillate stocks increased as well – up 4.8 million barrels and 8.9 million barrels to 233.2 million barrels and 138.8 million barrels, respectively.
Crude stocks, however, fell 7.4 million barrels to 424.5 million barrels. This was the lowest since September 2015.
Refinery utilization rose a percentage point to 96.7 percent – the highest since August 2005.
E-mini S&P 500: Currently net long 172.6k, up 67.9k.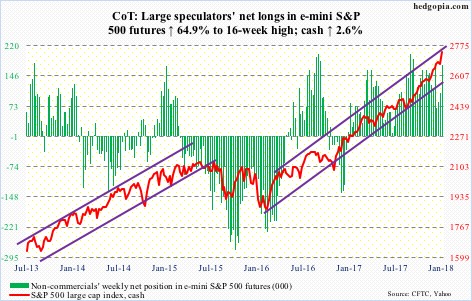
One more mini-breakout on the cash (2743.15) – this time out of a daily flag setup.
Several metrics are beginning to look ridiculous – the monthly RSI, for instance, at north of 86! – but this also points to the bulls’ ability to persistently keep up the pressure. The next time the S&P 500 comes under pressure, they now have 2700 to defend.
This week’s 2.6-percent rally had the full support of non-commercials, but came without much cooperation from flows. At least in the week ended Wednesday, U.S.-based equity funds (including ETFs), lost $8.4 billion (courtesy of Lipper).
In the same week, VOO (Vanguard S&P 500 ETF) and IVV (iShares core S&P 500 ETF) took in $174 million and $677 million, in that order (courtesy of ETF.com). But $2.6 billion came out of SPY (SPDR S&P 500 ETF), following $23.7 billion in inflows in the prior four.
Euro: Currently net long 127.9k, up 35.7k.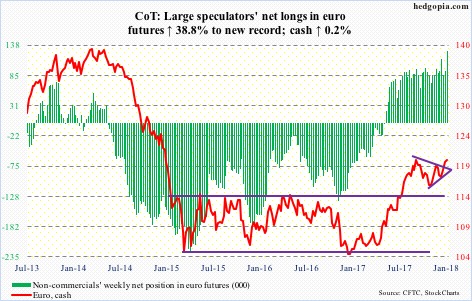
The September 8th (2017) high of $120.69 was tested on the cash ($120.29). Resistance around that level goes back nearly two decades.
In the most recent advance since the low 13 sessions ago through this week’s high of $120.89, the euro rallied 2.9 percent.
On the monthly chart, a potentially bullish cup and handle looks to be forming. A breakout here will be massive, if the bulls can pull it off. But right now, a pause is likely.
Non-commercials are already net long up to the gills.
Gold: Currently net long 163.3k, up 27.3k.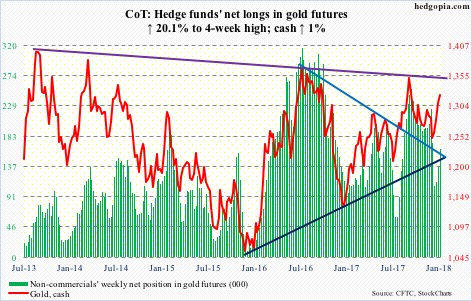
The cash ($1,322.30/ounce) continued to rally along the daily upper Bollinger band, rising to an intraday high of $1,327.30 on Thursday. Ideally, gold bugs would love to test a slightly falling trend line from July last year – around $1,350.
But indecision candles are appearing on the daily chart. A little giveback would not be that surprising. There is plenty of support underneath – the all-important $1,300 plus both the 50- and 200-day moving averages in the $1,270s.
Flows continue to be tentative, although it has not mattered much.
In the week to Wednesday, IAU (iShares gold trust) took in $28 million, while GLD (SPDR gold ETF) lost $49 million (courtesy of ETF.com).
Nasdaq 100 index (mini): Currently net long 17.9k, up 15k.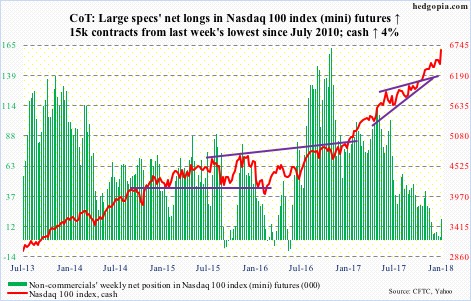
Shorts likely got cooked.
Mid-December (last year), short interest on QQQ (PowerShares QQQ trust) jumped 20.4 percent period-over-period to 64.2 million. On XLK, it shot up 20.1 percent to 38 million.
At one time, they were looking spot-on, as the Nasdaq 100 came under slight pressure after peaking at 6522.70 on the 18th last month. That was until the bulls defended the 20-day last Friday, followed by a new high of 6654.98 this Friday.
For the week, the cash surged four percent. Flows were not much of a factor. In the week to Wednesday, QQQ lost $2.2 billion (courtesy of ETF.com). But non-commercials were.
Russell 2000 mini-index: Currently net long 46.7k, down 3.5k.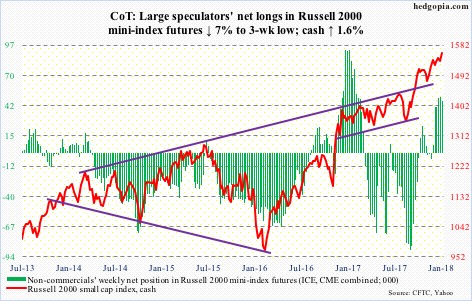
The cash (1560.01) had gone sideways in the prior five weeks. This week, the atmosphere was perfect for a breakout, but the bulls could not pull it off.
The Russell 2000 did reach a new all-time high of 1560.84 – just past the prior high of 1559.61 on the 4th last month – but conviction was lacking.
In the week through Wednesday, IWM (iShares Russell 2000 ETF) lost $1.8 billion, while IJR (iShares core S&P small-cap ETF) attracted $16 million (courtesy of ETF.com).
A breakout is still possible – duration and magnitude notwithstanding – particularly so if flows improve. Non-commercials, on the other hand, already have decent net long exposure.
US Dollar Index: Currently net long 2.2k, down 299.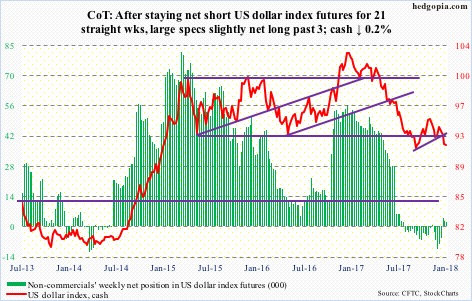
The cash (91.67) came one step closer to testing the September 8th low of 90.99, having dropped to 91.47 Tuesday. At the same time, that low was not breached in the next three sessions. If indeed the dollar index is trying to stabilize, more important perhaps is what transpires at the broken-support-turned resistance of 92-93. Both Wednesday and Thursday, 92 brought sellers.
VIX: Currently net short 91.6k, down 5.6k.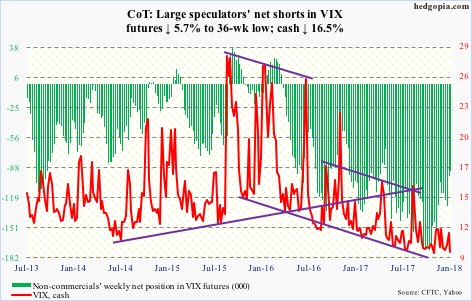
On both Wednesday and Thursday, the daily lower Bollinger band on the cash (9.22) provided support. Several times in the recent past, VIX has shown a tendency to rally off of that band. Should one occur, the question is, will that once again be used as an opportunity to sell volatility, as has persistently been the case?
Things are complacent. Truth be told, though. Complacency thus far has paid off, with strong showing by stocks to start out the new year.
How complacent?
In the options market, the 21-day moving average of the CBOE equity put-to-call ratio was .565 on Thursday. This was the lowest since July 2014. The question is not if this sooner or later gets unwound, rather when – just the nature of things.
Thanks for reading!
