
Following futures positions of non-commercials are as of February 20, 2024.
10-year note: Currently net short 729.1k, down 31.5k.
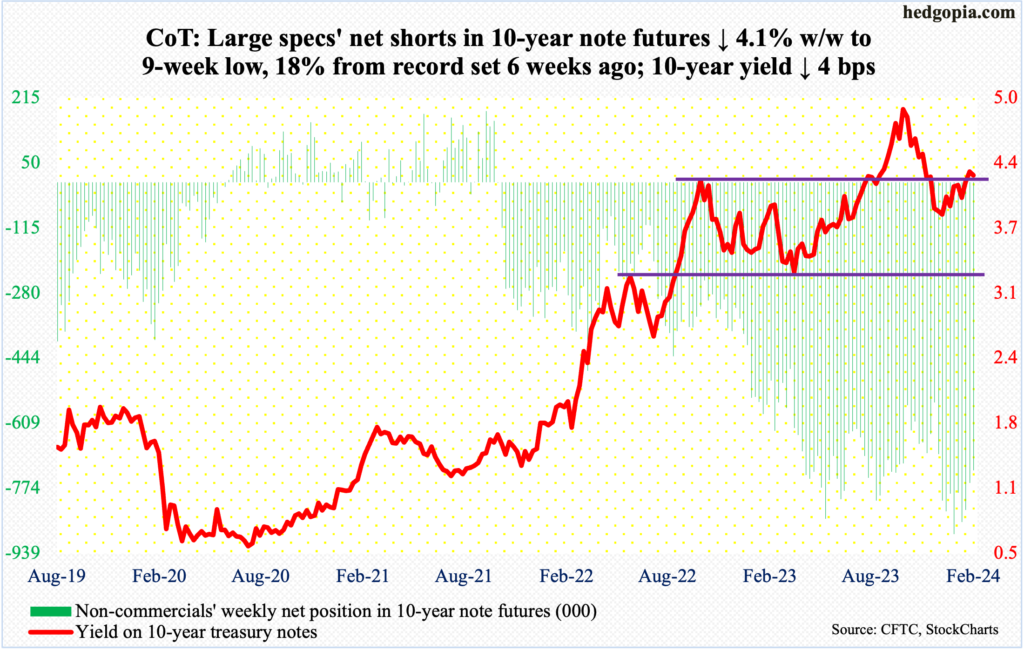
In the futures market, fed funds traders have now reduced rates outlook to three 25-basis-point cuts this year. This is right in line with what the December dot plot telegraphed – up from two at the September meeting. This was widely viewed as a dovish pivot, which lit a fire under risk-on assets, including equities.
At one time, these traders were expecting six to seven cuts this year. It took a lot for them to cut their expectations in half. Stronger-than-expected economic data in recent weeks played a major role. Then there was this persistent pushback by FOMC officials against markets’ pie-in-the-sky rates optimism.
Even as these traders have now adjusted their expectations lower to be on par with FOMC guidance, the risk is, come March (19-20) meeting, the dot plot goes back to guiding two cuts this year, which was the case before the December meeting. The economy continues to churn out strong numbers and inflation remains above the Federal Reserve’s two-percent objective. January’s CPI was hotter than expected; all eyes are now focused on if the PCE (personal consumption expenditures) price index – due out Thursday – confirms the CPI message (more on this here).
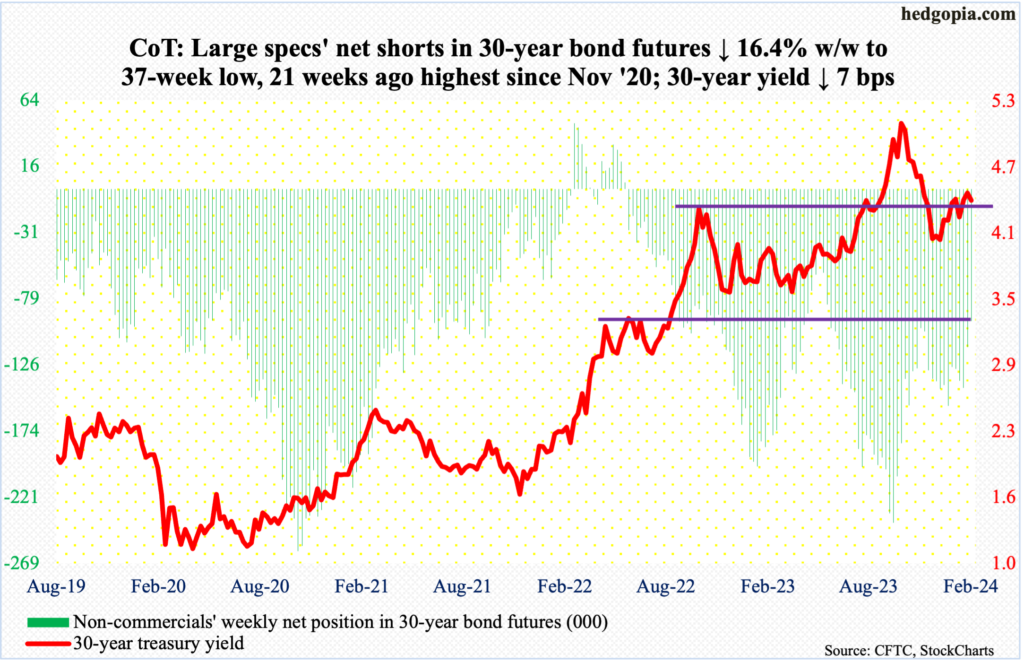
30-year bond: Currently net short 94.8k, down 18.6k.
Major US economic releases for next week are as follows.
New home sales (January) are due out Monday. December sales were up eight percent month-over-month to a seasonally adjusted annual rate of 664,000 units – a two-month high.
Tuesday brings durable goods orders (January) and the S&P Case-Shiller home price index (December).
Orders for non-defense capital goods ex-aircraft – proxy for business capex plans – inched up 0.2 percent m/m in December to $74.2 billion (SAAR). This was a new high.
GDP (4Q23, first revision) will be out Wednesday. The first print showed that real GDP grew at an annualized rate of 3.3 percent in the December quarter. This was the sixth consecutive positive reading.
Personal income/spending (January) is scheduled for Thursday. In the 12 months to December, headline and core PCE increased 2.6 percent and 2.9 percent respectively. They peaked in 2022 at 7.1 percent (June) and 5.6 percent (February), in that order.
The ISM manufacturing index (February) and the University of Michigan’s consumer sentiment index (February, final) will be out Friday.
Manufacturing activity in January jumped two percentage points m/m to 49.1 percent – still in sub-50 contraction territory, but this was the highest reading since October 2022.
February’s preliminary reading showed consumer sentiment rose six-tenths of a point m/m to 79.6 – a 31-month high.
WTI crude oil: Currently net long 237.8k, up 28.2k.
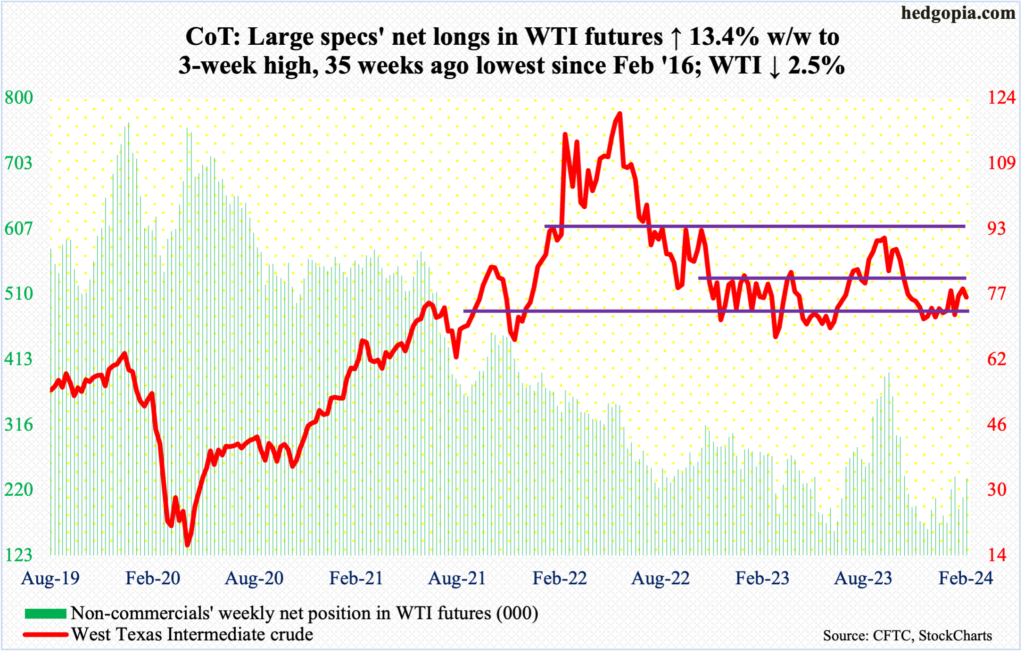
This resistance is proving tough to crack. Two weeks ago, oil bulls defended the lower bound of a 17-month range between $71-$72 and $81-$82. For over three months now, the upper bound has not been tested. Rather, West Texas Intermediate crude has been retreating from just under $80.
This week, the crude hit $78.92 intraday Friday before selling off 2.7 percent in that session to end the week down 2.5 percent to $76.49/barrel. The weekly RSI, too, is turning back down at the median.
Odds favor more weakness in the sessions ahead.
In the meantime, as per the EIA, US crude production in the week to February 16th remained unchanged week-over-week for three weeks in a row at 13.3 million barrels per day. This is a record and was first hit in the week to December 15th, then five more times after that. Crude imports increased 184,000 b/d to 6.7 mb/d. As did crude inventory, which grew 3.5 million barrels to 443 million barrels. Gasoline and distillate stocks, on the other hand, declined – down 293,000 barrels and 4.1 million barrels respectively to 247 million barrels and 121.7 million barrels. Refinery utilization was unchanged at 80.6 percent.
E-mini S&P 500: Currently net short 218.5k, up 2.8k.
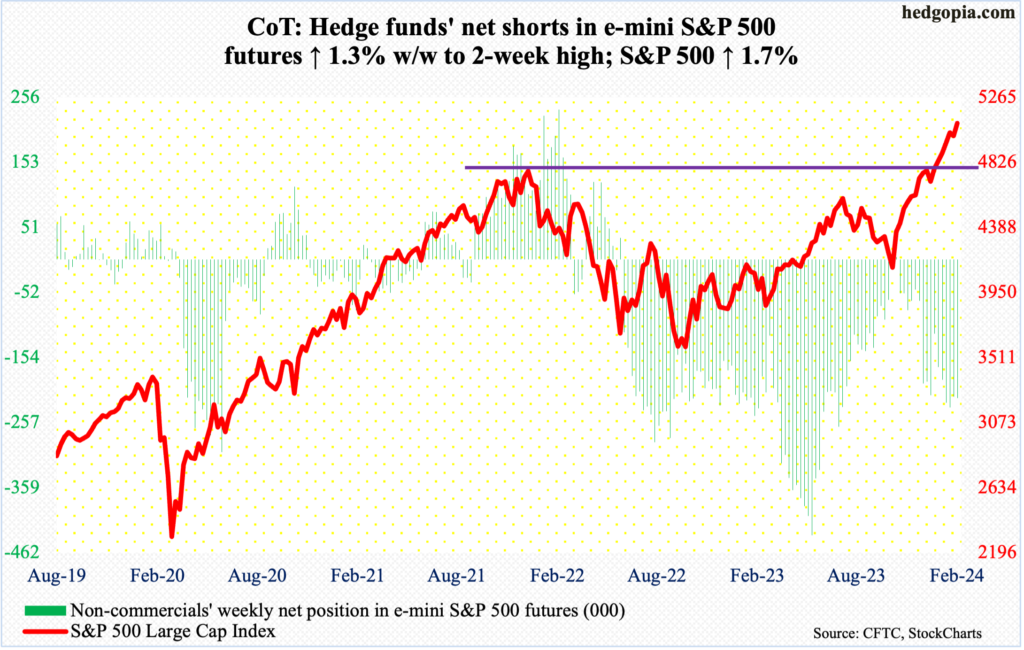
After beginning the first two trading sessions tentatively, equity bulls used Nvidia (NVDA)’s much-better-than-expected January-quarter results to gap up the S&P 500 on Thursday, adding 105 points in that session alone. For the week, the large cap index was up 1.7 percent – its 15th up week in 17.
The only Achilles heel was seen on Friday when the bulls initially tried to maintain Thursday’s momentum but came up short, tagging 5111 intraday but closing at 5089. It is too soon to say if this will end up being an opportunity for the bears. If it turns out it is, then the nearest support lies at 5030s.
Bulls’ unwillingness to take on leverage continues to be an issue (more on this here).
Euro: Currently net long 68k, up 15.2k.
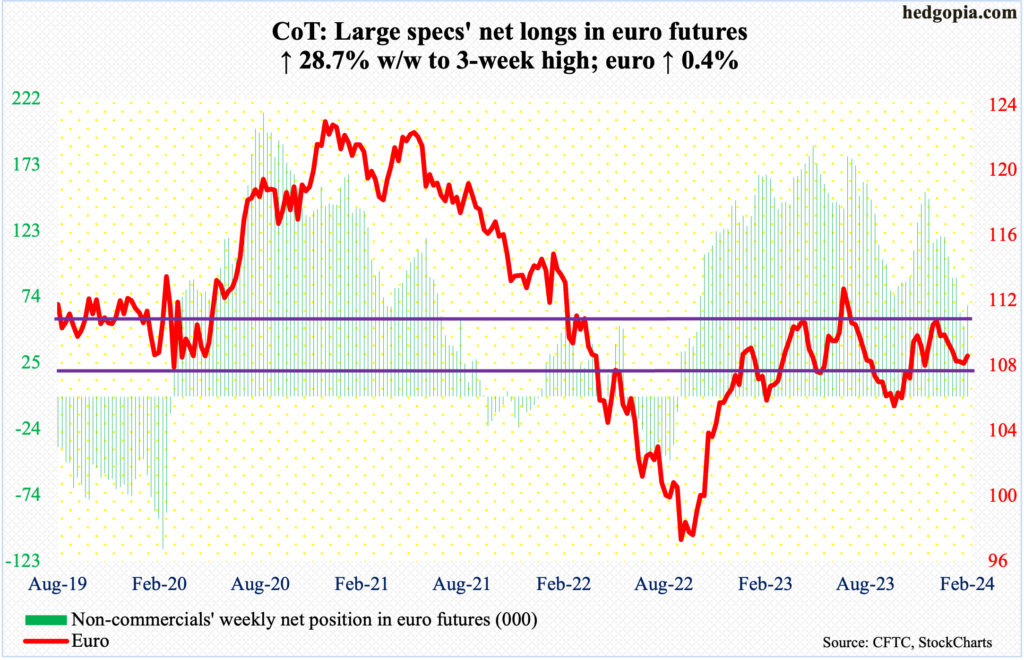
For at least going back to March 2015, $1.07-$1.08 has attracted both bulls and bears. In all four sessions this week, the euro tagged $1.08 intraday but managed to close north of it in only two, ending the week up 0.4 percent to $1.0821.
The currency has been under pressure since peaking at $1.1125 on December 27th, trading within a descending channel. This week, it poked its head out of it. This is potentially bullish.
Gold: Currently net long 140.3k, up 9.1k.
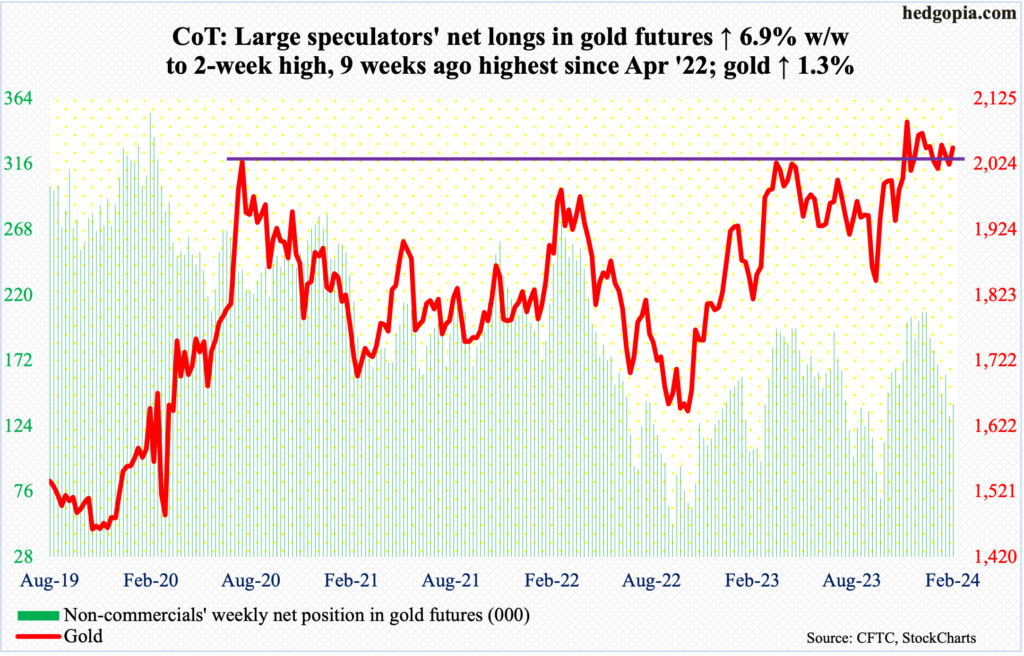
Gold acts like it wants to once again go attack $2,080s, which has rejected breakout attempts for over three years now.
In August 2020, the metal posted a new all-time high of $2,089 and retreated. This occurred again in March 2022 when gold tagged $2,079 and in May last year when $2,085 was ticked, followed by rejections in December, early January this year as well as early this month.
This week, after a few attempts, gold finally recaptured the 50-day moving average ($2,039), rallying 1.4 percent to $2,049/ounce. Gold bugs have the ball for now.
Nasdaq (mini): Currently net long 25.6k, down 6.5k.
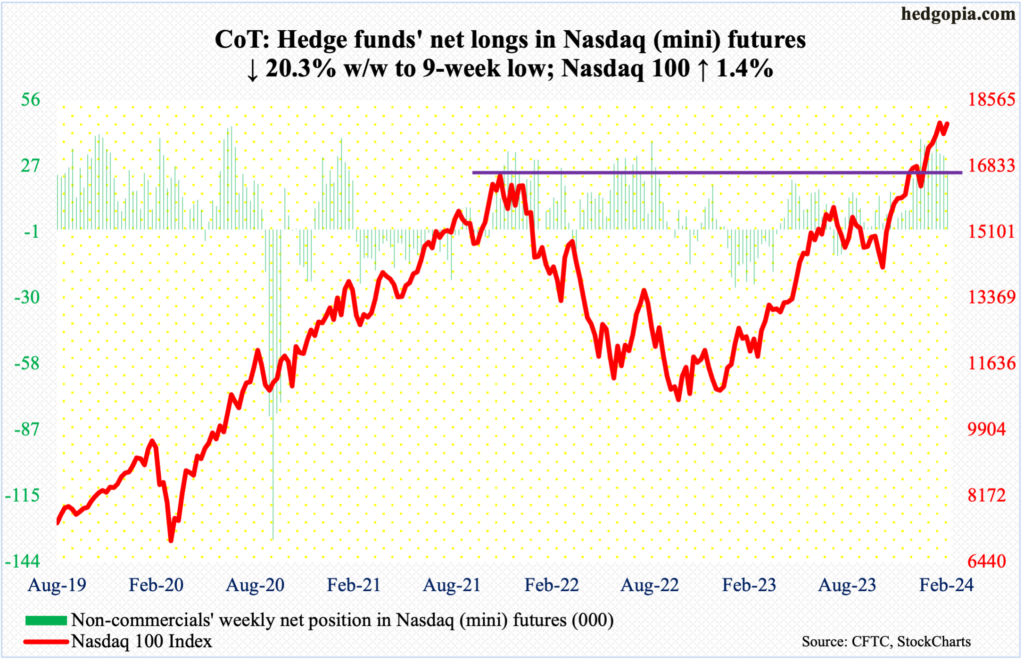
Amidst all the NVDA-related frenzy this week, the Nasdaq 100 was still unable to bust out of 18000, which has stopped the tech-heavy index for three weeks now. Friday’s intraday high of 18092 rallied past last week’s high of 18041 as well as 17988 the week before that, but when it was all said and done, the index reversed the session lower 0.4 percent to 17938.
Perhaps importantly, NVDA, which surged 16.4 percent on Thursday to $785, continued to rally Friday, touching $824 intraday but only to reverse to close at $788. It is early, but this could very well be a warning shot across the bows of NVDA bulls, which must defend $740s in the sessions ahead.
Russell 2000 mini-index: Currently net short 24.2k, down 246.
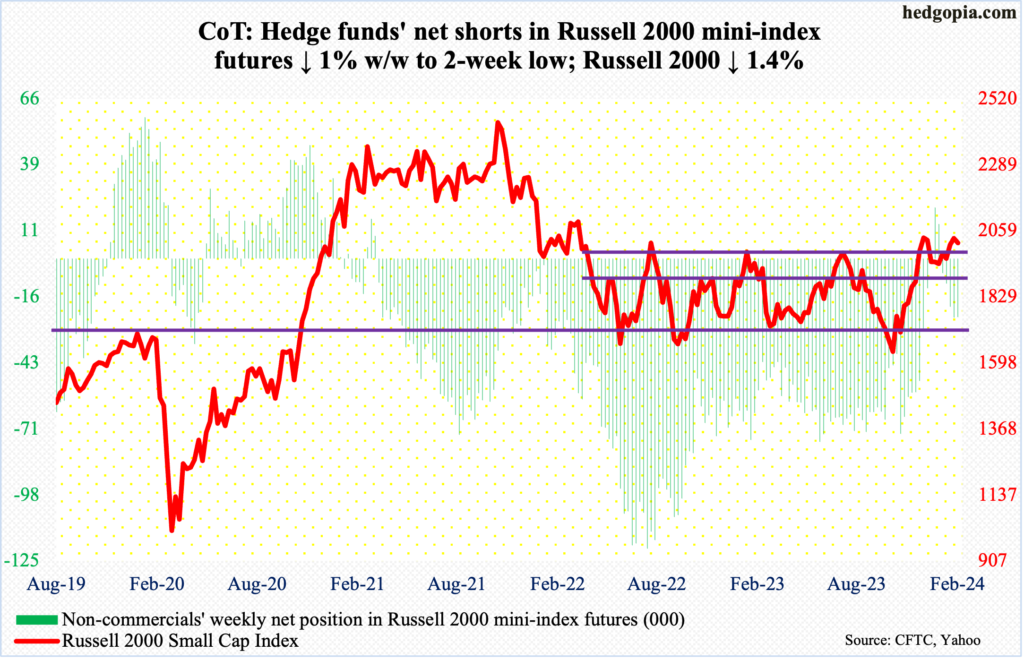
In a week in which the S&P 500 rallied strong on the back of NVDA’s results, the Russell 2000 was given no love, to say the least. The small cap index gave back 1.4 percent to 2016.
Last week, the Russell 2000 did rally toward the December 27th high of 2072 but only to then weaken.
Earlier on December 13th, the index broke out of a 200-point range between 1900 and 1700, which had been in place since January last year. A measured-move target of the breakout would amount to 2100.
As things stand, should the bulls fail to save 2000, breakout retest at 1900 is the path of least resistance.
US Dollar Index: Currently net long 1.5k, down 456.
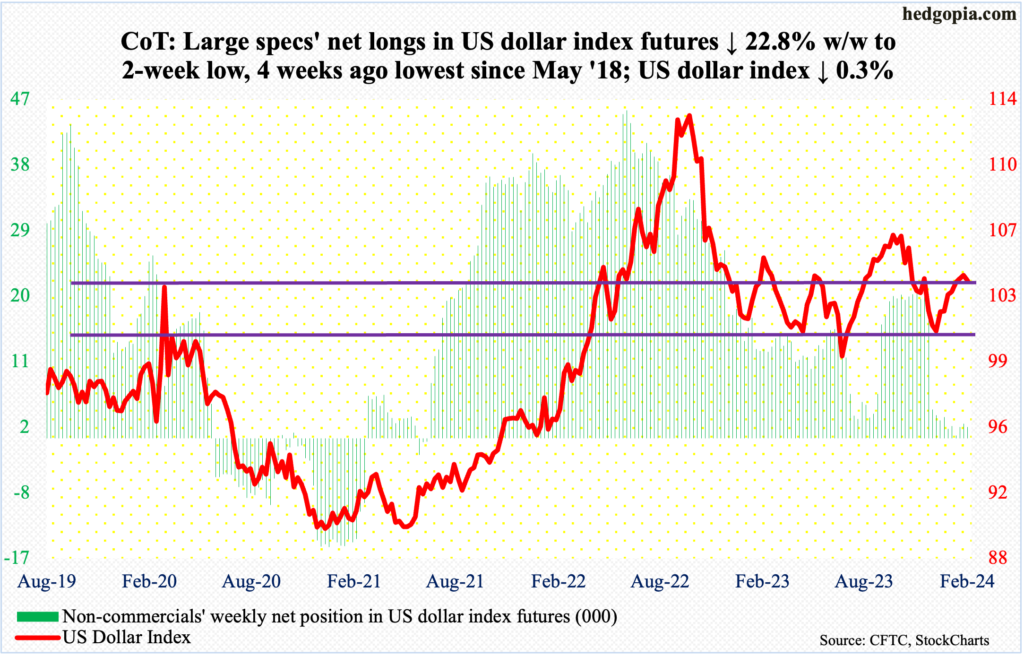
After seven consecutive up weeks, the US dollar index dropped 0.3 percent this week to 103.86. This follows last week’s spinning top and a shooting star before that. This week’s could be a hanging man. Time will tell.
The index this week did fall out of an ascending channel in place since it bottomed at 100.32 on December 28th.
Earlier, it peaked on October 3rd at 107.05 and began to really come under pressure early November. Post-Fed pivot on December 13th, it sliced through horizontal support at 103-104. It has made a return trip to that level, but reclaiming it is proving difficult for dollar bulls.
VIX: Currently net short 39.1k, down 11.9k.
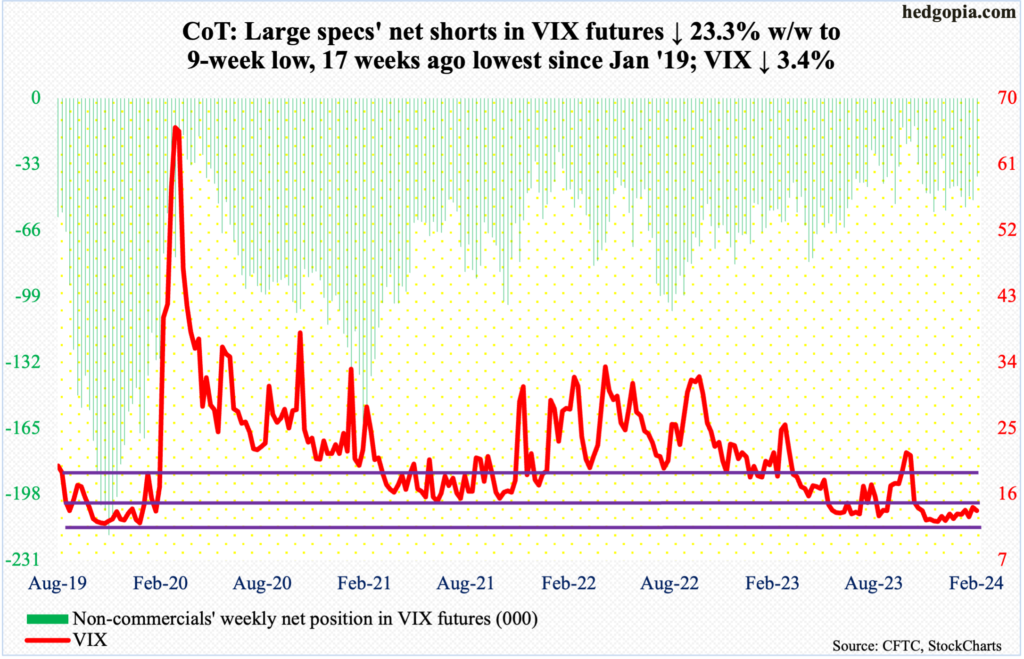
VIX tried to mount a rally and did exactly that early on, reaching 16.12 intraday Wednesday. But by Friday, the volatility index ended the week down 0.49 points to 13.75.
The weekly RSI seems to want to turn lower at the median. This will come to fruition, should a rising trendline from December 12th, when VIX bottomed at 11.81, gets breached at 13.
Thanks for reading!
