
Following futures positions of non-commercials are as of August 7, 2018.
10-year note: Currently net short 586.3k, down 3.8k.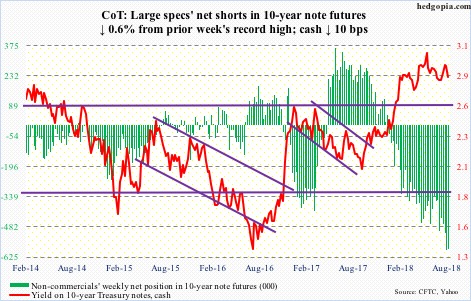
The 10-year Treasury yield (2.86 percent) continues to work on a potentially bearish head-and-shoulders formation. On August 1, it hit 3.02 percent intraday before getting repelled at the daily upper Bollinger band. Staying above three percent has proven difficult. For the first time since January 2014, yields rose over three percent in April this year, followed by another test mid-June.
Should the 10-year continue lower, the neckline will be tested at 2.8-2.85 percent. It will be a crucial test. If nothing else, just for the fact that non-commercials are neck-deep in net shorts in 10-year note futures. A breach of this support likely forces a squeeze – magnitude notwithstanding. In a scenario in which a self-fulfilling prophecy kicks in, yields can come under decent pressure.
30-year bond: Currently net short 31.9k, up 11.3k.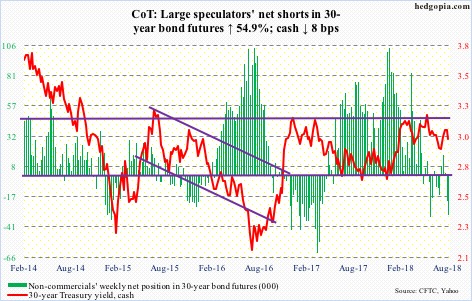
Major economic releases next week are as follows.
Tuesday, the NFIB small business index for July is reported. It fell six-tenths of a point month-over-month in June. May’s 107.8 was the second highest reading in its 45-year history.
Retail sales (July), productivity (2Q18, preliminary), industrial production (July) and the NAHB housing market index (Aug) are on tap Wednesday.
Retail sales jumped 6.6 percent year-over-year in June to a seasonally adjusted annual rate of $506.8 billion. This was the fastest growth rate since February 2012.
Non-farm output per hour rose 0.4 percent in 1Q18. Productivity remains subdued.
Capacity utilization rose 2.3 percent y/y to 78 percent in June. Utilization has risen since bottoming at 75 percent in November 2016.
Builder sentiment in July was unchanged m/m at 68. Last December’s 74 was the highest since July 1999.
July’s housing starts is scheduled for Thursday. Starts collapsed 12.3 percent m/m in June to 1.17 million units (SAAR). May’s 1.34 million was the highest since July 2007.
Friday brings the University of Michigan’s consumer sentiment index for August. July inched down three-tenths of a point m/m to 97.9. March’s 101.4 was the highest since January 2004.
Crude oil: Currently net long 656.8k, up 4.2k.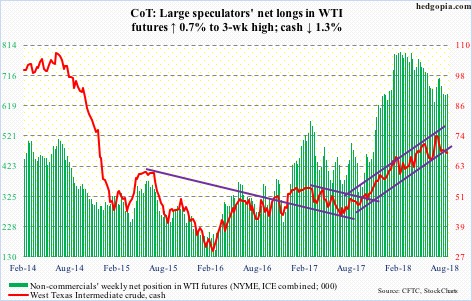
Spot West Texas Intermediate crude ($67.63/barrel) continued to face resistance at $69-69.50. Intraday Monday, the crude rose to $69.92 but ended the session only slightly up with a long wick. Wednesday, it sliced through the 50-day moving average dropping 3.2 percent. Support at $66-67 is in play again. In fact, it was tested Wednesday through Friday, and held. A loss of this support makes the crude vulnerable to a test of the 200-day at $64.11.
The Wednesday decline came in the midst of continued US-Iran tensions and a mixed EIA report. News of China retaliating with matching tariffs on US goods likely played a role, as the nation is a big importer of oil. In the week to August 3, US stocks of gasoline and distillates rose 2.9 million barrels and 1.2 million barrels to 233.9 million barrels and 125.4 million barrels respectively. Crude imports increased 182,000 barrels per day to 7.93 million b/d.
Crude stocks, however, fell 1.4 million barrels to 407.4 million barrels. Crude production fell 100,000 b/d to 10.8 mb/d. Refinery utilization inched up five-tenths of percentage point to 96.6 percent.
E-mini S&P 500: Currently net long 165.2k, down 5.1k.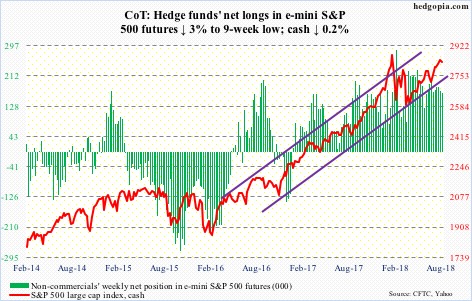
So close yet so far! The cash (2833.28) Tuesday came within 9.45 points from surpassing its all-time high of 2872.87 on January 26. August’s advance has come on increasingly weak volume, with the first four sessions this week bumping against the daily upper Bollinger band. Daily momentum indicators are stretched.
On August 2, bulls defended breakout retest at 2800. A retest looks imminent.
In the week through Wednesday, US-based equity funds (including ETF’s) lost $962 million (courtesy of Lipper.com). In the past 10 weeks, $47 billion was redeemed, versus inflows of $3.2 billion.
In the same week, $6.3 billion was withdrawn from SPY (SPDR S&P 500 ETF), even as VOO (Vanguard S&P 500 ETF) and IVV (iShares core S&P 500 ETF) gained $382 million and $402 million, in that order (courtesy of ETF.com).
Euro: Currently net long 10.6k, down 12.3k.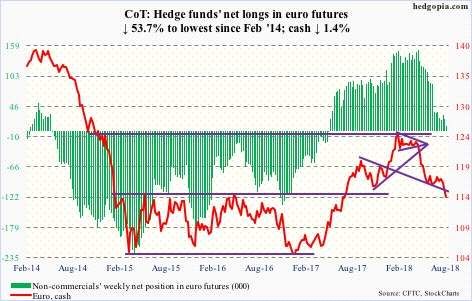
There goes $115 on the cash ($114.18). Monday’s intraday low of $115.365 came within striking distance of testing $115.19 reached May 29. This was another successful test of the upper bound of support at $114-115. Come Friday, Turkey did not help. News that ECB concerns were growing over EU banks’ Turkey exposure put the Turkish lira under further pressure. The euro fell one percent in that session.
After going sideways in a rectangle for nearly two and a half years, the euro broke out of $114-115 in July last year. The loss of $115 also means a break of a rising trend line from early 2017.
Non-commercials are not helping. They continue to cut back net longs.
Gold: Currently net long 12.7k, down 22.6k.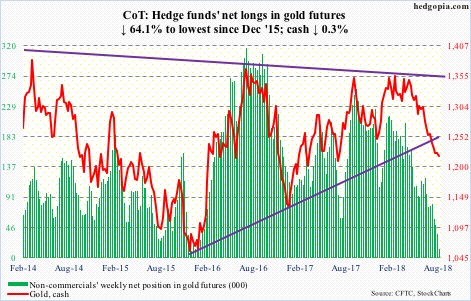
As far as flows are concerned, it is the same old same old. In the week ended Wednesday, GLD (SPDR gold ETF) bled $414 million and IAU (iShares gold trust) $18 million (courtesy of ETF.com).
And non-commercials continue to reduce net longs – now lowest since December 2015.
Amidst this, the cash ($1,219/ounce) continues to act as if it is trying to hammer out a bottom. The metal dropped to an intraday low of $1,210.70/ounce on July 19. That low is intact, with sideways action since. Daily Bollinger bands have contracted sharply. Near-term resistance lies at $1,235.
Nasdaq 100 index (mini): Currently net long 36.7k, down 6.6k.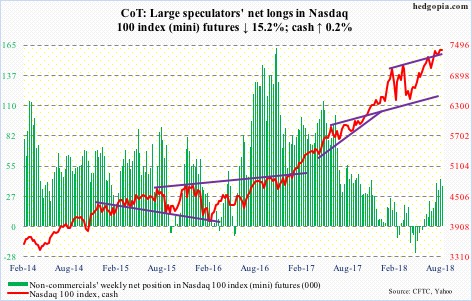
Thursday, the cash (7408.3) came within 13.02 points of matching its all-time high of 7511.39 reached July 25. In the week to Wednesday, QQQ (PowerShares QQQ ETF) took in $1.5 billion (courtesy of ETF.com). July’s record high came in a shooting star week, and was rejected at six-month channel resistance. The following week produced a hanging man. This week, the Nasdaq 100 index was up 0.2 percent, but it was not able to hang on to its gains, with another candle with a long wick. In fact, there has not been much conviction behind the rally since it pushed off of the 50-day seven sessions ago. The daily chart is extended. Near-term support lies at 7300. The 50-day is at 7257.35, which is where a rising trend line from early April rests.
Russell 2000 mini-index: Currently net long 13.2k, down 19.6k.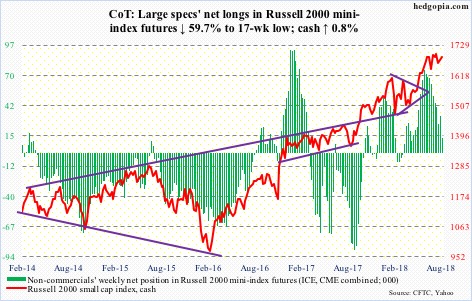
The bull-bear tug of war continued on the cash (1686.8). To recall, over the last eight weeks, small-cap bulls have been denied at 1700-plus three times – 1708.10 on June 20, 1708.56 on July 10 and 1706.83 on July 24. Concurrently, the Russell 2000 small can index has traced out higher lows. Bulls would love to turn this action into healthy consolidation eventually resulting in a breakout. With that said, subtle signs of fatigue are showing up on the daily chart. At least near term, bulls have their work cut out.
In the week to Wednesday, IWM (iShares Russell 2000 ETF) lost $545 million, even as IJR (iShares core S&P small-cap ETF) took in $117 million (courtesy of ETF.com).
US Dollar Index: Currently net long 30.1k, up 1.6k.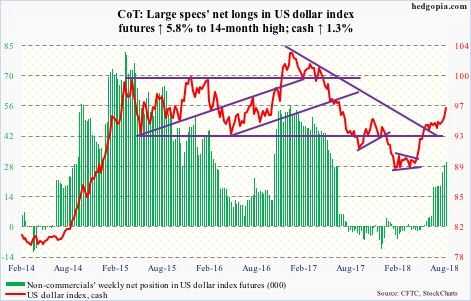
After getting repelled at 95-plus for 10 straight weeks, the cash (96.22) continued to attack that resistance, but with no success. This changed Friday when Turkey-inspired slide in the euro helped. The euro makes up 57.6 percent of the US dollar index. The only thing is that the breakout is the result of weakness in the euro, but not dollar-related fundamentals. Dollar bulls will take it. Non-commercials slowly but surely have been adding to net longs. From their perspective, all the better if the Chinese yuan (6.85) breaks seven to the dollar.
VIX: Currently net short 113.8k, up 10.3k.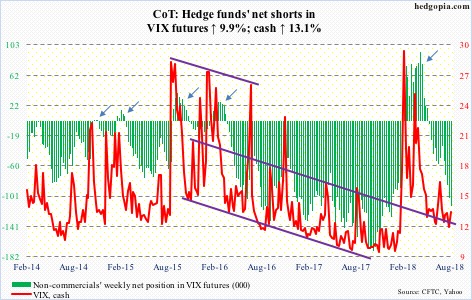
The cash (13.16) Thursday breached 11 as it fell intraday to a low of 10.17, which was the lowest since January 12 this year. Intraday, that session also broke three-month support at just north of 11, but ended up closing up 3.9 percent with a hammer reversal right at the daily lower Bollinger band. The bands are narrow. This often precedes a sharp move – either way. As suppressed as volatility is, odds are it will be to the upside. For three and a half months now, resistance at 19-plus has proven tough to crack. Immediately ahead, the 200-day lies at 14.45.
In the meantime, the VIX-to-VXV ratio closed out the week at 0.865, but dropped to 0.777 on Wednesday – well into oversold territory. As the ratio rises, VIX (measures 30-day volatility versus VXV’s 90-day) will begin to command higher premium than VXV.
Thanks for reading!
