
Major U.S. stock indices rallied to fresh new highs last week. Even small-caps, which until recently had been lagging their large-cap brethren, joined the party.
With seasonality in their favor, will the bulls be able to build on this or some backing and filling is in order? The Russell 2000 small cap index, for instance, broke out last week but into daily overbought condition.
In the very near term, things seem like a toss-up, but with downward bias. Several options- and volatility-related metrics suggest as much.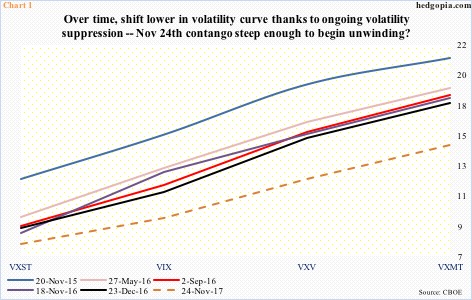
The volatility curve – VXST (measures expectations of nine-day future volatility in the S&P 500)-VIX (30 days)-VXV (90 days)-VXMT (six months) – is in contango. More often than not, this sooner or later leads to downward pressure on stocks – duration and magnitude notwithstanding – as near-term volatility gets bid up. (Backwardation similarly will have an opposite effect.)
Chart 1 plots six instances of contango going back a couple of years. In five of these, the spread between VXST and VXMT was minus eight or higher. The sixth one – the dashed line, which is as of last Friday – was minus 6.93. A week earlier – on the 17th – this had risen to 7.49.
Is the curve steep enough to begin unwinding? Possibly.
This much is clear.
Over time, the whole curve has shifted down, which is not surprising given the persistent volatility suppression.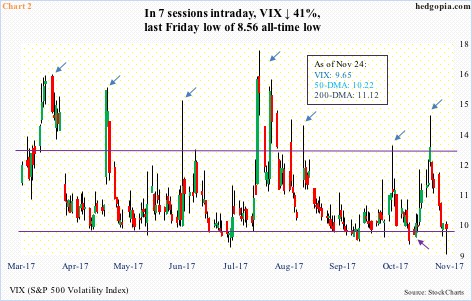
VIX just made a new all-time low. Last Friday, it dropped intraday to 8.56, before recovering to close the session down 0.23 to 9.65. It bounced off the daily lower Bollinger band. This was preceded by a drop from an intraday high of 14.51 on the 15th – only six sessions ago.
Chart 2 only goes back eight months, yet has witnessed several spikes that ultimately proved to be an opportune time to short volatility (blue arrows). The latest, of course, was seven sessions ago. That reversal also preceded an intraday nine-session jump from 8.99 (indigo arrow) to the afore-mentioned 14.51. Incidentally, that one, too, bottomed on the daily lower Bollinger band.
In fact, Chart 2 also shows several such jumps in VIX. The problem, from volatility bulls’ perspective, those did not last very long. One needed to be extremely nimble to take advantage of these spikes.
If another jump is around the corner, then there is plenty of unwinding left.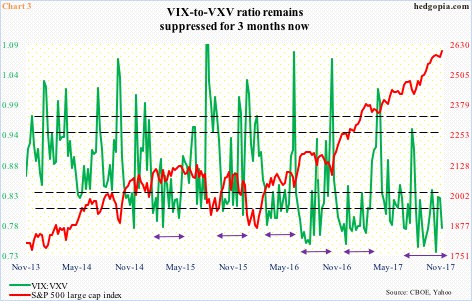
The VIX-to-VXV ratio remains severely oversold.
For 14 weeks now, VIX:VXV closed out the week between mid- to high-0.70s and low-0.80s, with seven of them in 0.70s, of which three were sub-0.75. The ratio has lingered in oversold territory for too long.
The chart also shows several instances in the past during which the ratio remained languished in oversold territory. But the longer it stays there, the higher the odds of a snapback. If nothing else, just to unwind the oversold condition.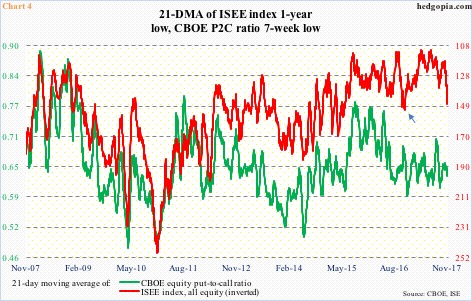
In this context, Chart 4 is relevant.
It plots the CBOE equity put-to-call ratio with the ISEE index, all equity. The latter is a call-to-put ratio, hence inverted.
The ISEE index excludes trades from market makers and broker/dealers, and only uses opening long trades. Thus, from the sentiment viewpoint, it can be considered a clean number.
Last Friday, its 21-day moving average read 147.6, up from 111 on July 3 this year. The S&P 500 bottomed early July, and has rallied eight-plus percent since.
In September-November last year, the index experienced a similar increase – from 111.9 on September 28 to 147.9 on November 23, before reversing (arrow in Chart 4). Conceivably, as overbought as this metric is, it could similarly reverse from the current level.
The difference this time around is that the CBOE put-to-call ratio may have a little bit more to go. On December 12 last year, the green line bottomed at 0.587. Last Friday, it was at 0.628. The odds of a reversal would have grown if it dropped to high-0.50s to low-0.60s – which may not be that far off considering that the ratio was in mid- to high-0.50s (daily, not the average) in four of the past five sessions.
In this scenario, the odds of stocks coming under pressure rise – likely just in time for seasonality dip-buyers to get in.
Thanks for reading!
